Comparative Analysis of Student Dissatisfaction of the Continuing Academic Semesters at UNTELS
 , Dora Yvonne Arce Santillan 1, Jorge Isaac Castro Bedriñana 2, Teodoro Neri Díaz Leyva 1, Denisse Marie Barrientos Pichilingue 1
Adv. Sci. Technol. Eng. Syst. J. 4(6), 203–207 (2019);
 DOI: 10.25046/aj040626
Student dissatisfaction is of the utmost importance when it comes to establishing a process of continuous improvement in a University. Currently, at the National Technological University of Lima Sur (UNTELS) there is no information regarding the levels of student dissatisfaction with the services offered by UNTELS. In this context, the purpose of this research project is to collect information from the students of the Professional Careers of Systems Engineering, Environmental Engineering, Mechanical and Electrical Engineering, Electronic Engineering and Communications, and Business Administration of the academic semesters 2017-I, 2017-II and 2018-I. To assess student dissatisfaction, a physical questionnaire was applied; through which the indicator of the highest level of dissatisfaction was determined, being “Sufficient work tables or capacity”, corresponding to the category of laboratory service, whose value of dissatisfaction is 65.61%, 47.23% and 52.11%; in the academic semesters 2017-I, 2017-II and 2018-I, respectively. Next, the indicators whose level of research is greater than 40% were determined, with three indexes of higher percentage of increase, these are; Registration and enrollment, Internet Service and the Efficiency of Administrative Personal Work; These results are intended to take relevant actions for the continuous improvement of the educational quality of UNTELS..
1. Introduction
In search of quality assurance of university higher education, the Peruvian State according to Supreme Decree No. 016-2015-MINEDU states that, “The general objective of the policy of quality assurance of university higher education is to identify that all Young people in the country have the opportunity to access a quality educational service, which offers comprehensive training and continuous improvement, focused on the achievement of competent professional performance. Under this policy it is essential to quantify the percentage of satisfaction and dissatisfaction of university students, both academic services and administrative services provided by the University. [1]
For this, it is important to evaluate perceptions so that relevant improvements can be made and maintain good for the level of satisfaction improved. It is appropriate to comment, that all this effort to improve the service should seek that the student is prepared in a positive environment and with the appropriate tools for their development as a professional future reach the optimum possible. [2]
Dissatisfaction is made up of factors that have to do with the possibilities and opportunities that the university offers the student to start or continue his studies; taking into account the way in which its policies favor performance and permanence in the institution. It is also proven that these variables establish criteria for the decision of permanence and academic dropout, among which are: deficiency in physical, technological and human resources, disagreement with the university, lack of academic planning by teachers, discomfort with the university environment, inadequate treatment received at the university by professors and administrators, schedule programming, the institutional proposal is limited according to their expectations, and limited funding opportunities offered by the university. [3]
Also, dissatisfaction arises from not reaching expectations, which are reasonable and sustained possibilities of something happening, that is, it is not any hope or aspiration. It is constituted from previous experiences, desires and attitudes. Some characteristics of the expectations are: they are generally expected to be fulfilled, they are based on past experiences that can be of success or failure, influence the context, can be positive or negative and are changing according to the experiences. [4]
It should be noted that hygienic factors or extrinsic factors are also factors that are related to dissatisfaction; other factors are the conditions surrounding the study situation, such as class schedules, physical environment, student services, transportation, security, class interruptions and the relationship with teachers. These elements cannot be regulated by students. When they are unfavorable they produce dissatisfaction and discomfort; manifesting itself in low academic performance, high levels of repetition and in the worst case, dropout. [5]
In this sense, the National Technological University of Lima Sur (UNTELS) has the responsibility of offering quality and excellence education, for which it is necessary to have relevant initial information on student dissatisfaction regarding professional competences, personal and social attitudes, teaching staff, university environments, library services, laboratory services, computer center, administrative service of the faculty and professional school and support services of the University, which leads the authorities to make relevant decisions in order to establish the assurance of the educational quality at UNTELS.
2. Methodology
2.1. Type and level of Research
This research is non-experimental and descriptive, since it presents a single variable, this being student satisfaction; It is descriptive since it seeks the characterization of a fact, phenomenon, individual or group, in order to establish its structure or behavior. [6]
2.2. Population and Sample
In student satisfaction surveys. It is clear that a source of information about the teaching and learning processes are the students themselves. [7]
In that sense, the study population is made up of 3,119 students, which is the result of adding the number of students surveyed belonging to the seventh, eighth, ninth and tenth cycle of the Academic semesters 2017-I, 2017-II and 2018-I, of all professional schools of the National Technological University of South Lima. In the present investigation, the entire population has been considered as a sample, since the survey was compulsory applied to all students.
2.3. Applied Techniques in the Collection of Information and Measuring Instruments
For the collection of information, a segmented survey instrument was used in specific indicators for its analysis, which consider the degree of satisfaction in relation to professional competences, personal and social attitudes, teaching staff, university environments, library services, library services laboratory, computer center, administrative service of the faculty and professional school and support services of the University; The proposed measuring instrument, prior to its application, was validated through expert judgment.
It should be noted that questionnaires were used to measure satisfaction, since they are simple, fast and moderately cost tools; and being the first time this research is carried out, the National Technological University of South Lima, opted for an easy to understand tool. In addition, the questionnaires are more suitable for use in quantitative data and have a wide scope.
Likewise, the method used to obtain objective views of the students for an authentic research study is that of Maxwell, this method suggests four components: [8]
- The relationship established by the researcher with the study.
- The sources of information and the selected sample.
- Data collection.
- The analysis of the results.
In the first component, the relationship of research with aspects related to educational programs is established.
In the second component, it is recommended that the groups include “people who have information about the phenomenon since they are experts in the area with the privilege of witnessing the facts”; This point is represented by the students of the seventh, eighth, ninth and tenth cycle of the Academic semester 2017-I, 2017-II and 2018-I, of the professional careers of Systems Engineering, Mechanical and Electrical Engineering, Environmental Engineering, Business Administration and Electronic Engineering and Telecommunications. [8]
In the third component, it anticipated the difficulties that might arise regarding the responsibility for participating in the survey; to do this, communications were prepared via email and communications in each classroom, to encourage student participation. The students’ responses were recorded in the instrument, in addition, emotional reactions and body language were evaluated by a professional. These observations nurtured the validity of the survey.
Finally, in the fourth component, the results obtained were analyzed; it should be noted that quantitative research gives greater precision, to adequately explain the results and to make comparisons between them.
3. Results
Below are the results obtained from the application of the data collection instrument of the “Student Satisfaction Survey”, the same ones that were carried out via the web, during the academic semesters 2017-I, 2017-II and 2018- I.
The following Figure 1 shows the results of the indicators of greatest dissatisfaction of all categories in the academic semesters 2017-I, 2017-II and 2018-I.
As shown in Figure 1, the indicator that shows the highest percentage of dissatisfaction in the 2017 – I semester is Sufficient Work Tables or Capacity, this indicator is related to the category of Laboratory Services, then there is the Internet Service and the Recreation and Sports Areas, which belong to the categories of Computing Center and Environments of the University respectively. While in the 2017 – II semester, it is Sufficient Work Tables or Capacity, this indicator is related to the category of Laboratory Services, then there are Registries and Enrollments and the Number of Computers, which belong to the Support Service categories from the University and Computer Center respectively.
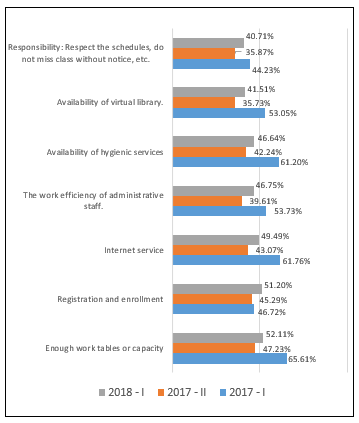 Figure 1: Comparison of the indicators of greater dissatisfaction of all categories of the academic semester 2017-I, 2017-II and 2018-I. (UNTELS)
Likewise, the indicator that shows the highest percentage of dissatisfaction in the semester 2018 – I, is Sufficient Work Tables or Capacity, this indicator is related to the category of Laboratory Services, then there are Registries and Enrollments and the work efficiency of administrative staff, which belong to the categories of University Support Service and Administrative Service of the Faculty and Professional School respectively.
Table 1: Indicators of greater increase in student inssatisfaction between all categories
| Indicator
|
Levels of Dissatisfaction | ||
| Semester
Academic 2017-I |
Semester
Academic 2017-II |
Semester
Academic 2018-I |
|
| Enough work tables or capacity | 65.61% | 47.23% | 52.11% |
| Registration and enrollment | 46.72% | 45.29% | 51.2% |
| Internet service | 61.76% | 43.07% | 49.49% |
| The work efficiency of administrative staff. | 53.73% | 39.61% | 46.75% |
| Availability of hygienic services | 61.20% | 42.24% | 46.64% |
| Availability of virtual library | 53.05% | 35.73% | 41.51% |
| Responsibility: Respect the schedules, do not miss class without notice, etc. | 44.23% | 35.87% | 40.71% |
Once the results of the comparison of the indicators of greatest dissatisfaction between all categories are obtained, the indicators whose level of dissatisfaction is greater than 40% are shown, in the academic semester 2018-I and that showed an increase in dissatisfaction compared to the academic semester 2017-II and 2017 – I.
With the results of the indicators with the greatest dissatisfaction, we will now determine in which professional career, there are the greatest number of dissatisfied students, for this, we use the results of table 1, and we will choose the 3 indicators that have the highest percentage of variation in relation to the previous semester, that is, the indicator for the 2017-II semester, which presents a greater increase compared to the 2018-I semester.
Table 2: Total of unsatisfied students by professional career of the indicator records and registration
| Category: University Support Services | |
| Registration and enrollment | Total Unsatisfied Students |
| Electric engineering and telecommunications | 104 |
| Systems engineer | 99 |
| Mechanical and Electrical Engineering | 77 |
| Environmental engineering | 90 |
| Business Administration | 77 |
| Category: Computer Center | |
| Internet Service | Total Unsatisfied Students |
| Electric engineering and telecommunications | 86 |
| Systems engineer | 87 |
| Mechanical and Electrical Engineering | 56 |
| Environmental engineering | 77 |
| Business Administration | 62 |
Table 3: Total of unsatisfied students by professional career of the indicator internet service
Table 4: Total of unsatisfied students by professional career of the indicator the efficiency of administrative personal work
| Reliability statistics | ||
| Semestre | Cronbach’s Alpha | Number of elements |
| 2017-I | ,990 | 69 |
| 2017-II | ,990 | 69 |
| 2018-I | ,991 | 69 |
Table 5: Alfa de cronbach of the semester 2017-I, 2017-II and 2018-I
| Administrative Service of the Faculty and Professional School | |
| The Efficiency of Administrative Personal Work | Total Unsatisfied Students |
| Electric engineering and telecommunications | 98 |
| Systems engineer | 88 |
| Mechanical and Electrical Engineering | 79 |
| Environmental engineering | 84 |
| Business Administration | 72 |
As can be seen in Table 2, the professional career that shows the greatest dissatisfaction in relation to Registries and Enrollment, is the Electronic Engineering and Telecommunications career, also in Table 3, it is observed that the career that presents the highest level of dissatisfaction in In relation to the Internet Service, it is the Systems Engineering degree; finally, it is observed in Table 4, that the professional career of Electronic Engineering and Telecommunications is the career that presents the greatest degree of dissatisfaction in relation to the Efficiency of Administrative Personal Work of the Faculty and Professional School.
4. Discussion
Once the comparative analysis of student dissatisfaction of three continuous academic semesters has been carried out, at UNTELS, we will carry out the Cronbach Alpha test, using the reliability statistics of the SPSS program; Reliability has several concepts, although broadly it can be defined as the absence of measurement errors in a questionnaire, or as the accuracy of its measurement.
As a general criterion, George and Mallery (2003, p. 231) suggest the following recommendations to evaluate Cronbach’s alpha coefficients. [9]
- Alpha coefficient> 0.9 is excellent
- Alpha coefficient> 0.8 is good
- Alpha coefficient> 0.7 is acceptable
- Alpha coefficient> 0.6 is questionable
- Alpha coefficient> 0.5 is poor
- Alpha coefficient <0.5 is unacceptable
The results of the Cronbach Alpha test performed on the results obtained in the semester 2017 – I, 2017 – II and 2018 – I.
As observed in the results, Cronbach’s Alpha is greater than 0.9, this value is classified as excellent; since, Cronbach’s alpha coefficient ranges between 0 and 1 and the closer it is to 1, the more reliable the data.
Continuing with the statistical analysis we will perform the frequency test in order to determine the amount of the number of dissatisfactions, of the indicators that show the greatest increase in student dissatisfaction among all categories, for this we will use Table 1, where the comparative analysis performed; It should be noted that only the results of the last two semesters 2017-II and 2018-I have been taken; since, it is irrelevant to take the 2017-I semester as a reference; because there is already information on the academic semester 2018-I; and the concern is to address the indices of dissatisfaction that show a tendency to increase between the semesters 2017-II and 2018-I.
Table 6: Number of unsatisfied students
| Unsatisfied Students | ||
| 2017 – II | 2018 – I | |
| Enough work tables or capacity | 341 | 457 |
| Registration and enrollment | 327 | 449 |
| Internet service | 304 | 434 |
| The work efficiency of administrative staff. | 285 | 410 |
| Availability of hygienic services | 305 | 409 |
| Availability of virtual library. | 240 | 364 |
| Responsibility: Respect the schedules, do not miss class without notice, etc. | 305 | 409 |
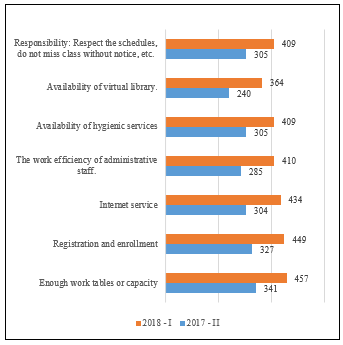 Figure 2: Number of unsatisfied students. (UNTELS)
The following shows the number of dissatisfied students per indicator whose level of dissatisfaction is greater than 40%. The following shows its graphic representation.
5. Discussion
In relation to the results of the present investigation, the following discussions are then carried out:
Regarding the “Registration and enrollment” indicator, it is evident that in the academic semester 2018-I a level of dissatisfaction of 51.20% was shown, compared to the semester 2017-II and 2017-I, which showed a level of dissatisfaction of 45.29 % and 46.72%, respectively; it is possible that this increase is reflected, due to the implementation of a new curriculum mesh; and in the rejection on the part of the students, in their understanding that this change of mesh was going to carry out the backward movement of their academic cycles; and in turn the registry and registration office was not in a position to carry out this process. According to Gómez (2016), 60% of students surveyed indicate that the enrollment process is not good and demand that the online system be prioritized, acquiring cutting-edge technology to improve the enrollment process. [10]
Regarding the “Internet Service” indicator, it is evident that a level of dissatisfaction of 49.49% in the academic semester 2018-I, although the value has decreased compared to the other semesters, it is still a necessary indicator to improve; it is possible that this dissatisfaction is due to the fact that there is no high network coverage, capable of covering the demand of the students; reason why resources are not used, such as the laboratory, library, and other University services. For Li (2008), the internet is the most requested and necessary service for the students of the San Martín de Porres University. [11]
Regarding the indicator “The efficiency in the work of administrative staff”, it is evident that in the academic semester 2018-I, a level of dissatisfaction of 46.75% was shown, this value has increased compared to the academic semester 2017-II, whose dissatisfaction It was 39.61%. This result is compared with that carried out by Li (2008), which indicates that, in most of the Peruvian Universities, 20% of students show dissatisfaction in the attention and work of the administrative staff, since there is no good treatment, nor a willingness to make student requests. [11]
6. Conclusions
It is concluded that the indicator of the highest level of dissatisfaction was determined, of all categories, being the indicator “Sufficient work tables or capacity”, belonging to the category Laboratory Services, whose value of dissatisfaction is 65.61%, 47.23% and 52.11 %; in the academic semesters 2017-I, 2017-II and 2018-I, respectively; This is due to the fact that laboratory equipment is not located in the most appropriate environment, that is, there is a bad dimensioning, so it is not possible to locate more work tables.
It is concluded that the Internet Service indicator, presented the greatest dissatisfaction increase in the 2018-I academic semester, compared to the 2017-I and 2017-II academics; this is because there is no high network coverage, able to meet the demand of the students; reason why resources are not used, such as the laboratory, library, and other University services.
It is concluded that the indicator “Efficiency in the work of administrative staff” is the one that shows the highest number of dissatisfied students; in the career of Electronic Engineering and Telecommunications; It is possible that this increase is due to the fact that there are no customer service training programs (students) for the personnel in charge of the different administrative offices.
- PCM-Peru. (September 25, 2015). Coordination Secretary of the PCM. Obtained from the PCM Coordination Secretary: http://sc.pcm.gob.pe/wp-content/uploads/files/politicas/Format os / DS% 20016-2015-MINEDU% 20 +% 20Anex.pdf
- Cieza, J., Castillo, A., Garay, F., & Poma, J. (2018). Satisfaction of the students of a Peruvian medical school. Lima: Heredian Medical Magazine
- Ariza, S. & Marín, D. (2009). Intervening factors in the school dropout of the Faculty of Psychology, Los Libertadores University Foundation. Psychological thesis Network of Scientific Journals of Latin America and the Caribbean, (4), 72-85.
- Carrillo, A. & Ramírez, S. (2011). Academic and work expectations of students coming to graduate from a degree in Educational Psychology. (Bachelor thesis). Available at http: //digitalacademico.ajus co.upn.mx: 8080 / thesis / handl e / 1234 56789/9257
- Tobón, M., Durán, M, & Áñez, A. (2016). Academic and professional satisfaction of university students. Venezuela: Electronic Journal of Humanities, Education and Social Communication
- Rica, U. C. (04 of 09 of 2017). Universia.net Obtained from Universia.net: http://noticias.universia.cr/educacion/noticia/2 017/09/04/1155475 / types-research-descriptive-exploratori a-e xpli cativa.html
- Malpica, F. (2013). 8 Key Ideas. Quality of educational practice. Barcelona: GRAÓ.
- Rodríguez, C., & Rodríguez, M. (2016). Usefulness of Maxwell’s methodology in research design. Bogota: University of the Andes.
- George, D., & Mallery, P. (2003). SPSS for Windows step by step: A Simple Guide and Reference. Boston: Allyn & Bacon.
- Gómez, N. (2016). Redesign of Processes to Improve Tuition at the Faculty of Administrative Sciences of the National University of San Marcos. Peru: Research Rev. of the Faculty of Administrative Sciences, UNMSM
- Castañeda, R. (2013). Factors associated with dropping out of university students. (Postgraduate thesis). San Martin de Porres University. Lima