SCMS: Tool for Assessing a Novel Taxonomy of Complexity Metrics for any Java Project at the Class and Method Levels based on Statement Level Metrics

Adv. Sci. Technol. Eng. Syst. J. 4(6), 220–228 (2019);
 DOI: 10.25046/aj040629
Software is the primary and indispensable entity in our technologically driven world. Therefore, quality assurance, and in particular software testing, represents a vital component in the software development cycle. Throughout the years, many tools have been developed to collect metrics of software that had been implemented. These tools have some differences but continue to play an important role in improving the quality of software products. This paper introduces a newly developed tool, named Spectra Complexity Metrics System (SCMS), which compiles a novel taxonomy of complexity metrics of any given software written in the Java programming language. Our suggested metrics have been invented to identify and evaluate the characteristics of Java computer programs. They aim at increasing the efficiency of the testing process by significantly reducing the number of test cases without having a significant drop in test effectiveness. We assess our proposed taxonomy of different complexity metrics based on the product levels (statement, method, and class) and their characteristics. For further evaluation, our software metrics coverage is compared to other existing software metric tools. The results show the novelty of our taxonomy of complexity metrics and the capability of our tool to compute these measurements based on all three of the product level categories. We have published our tool at https://github.com/issararab/SCMS under an open-source license.
1. Introduction
Over the current decade, concerns over present and future software quality have grown, as have the range and complexity of software and its applications. Increasingly, developers, researchers, and users are dissatisfied with the quality of available software. Hence, we have seen a growing focus on software testing, where the engineers’ main job is to assess and quantify the quality of a given product. The key challenge in this field is to reduce costs and maximize benefits. Those challenges have motivated software engineers to develop metrics or rules for quantifying given characteristics and attributes of software entities. For good quality software, these characteristics should be understandable and measurable [1]. These metrics aim to validate and verify the quality and the assurance of software. As it is extremely time-consuming and requires a great deal of time and effort, the overall testing process needs to be automated for testing practices [2].
This article is an extension of a paper previously presented in the International Conference on Software Engineering Research and Practice (SERP 2015), in Las Vegas, NV, USA [3]. Our contribution in this paper consists of explaining the theory behind our suggested taxonomy and presenting the first tool, SCMS, that compiles this introduced set of metrics. Furthermore, we are benchmarking the software metrics coverage against state-of-the-art tools. Our SCMS tool will be used to evaluate the complexity metrics, primarily following a static analysis, of any program written in Java language. The strength of this tool is that it is implemented to compute metrics at three different levels (statement, method, class). The tool outputs a CSV file of either the 20 metrics of all classes or the 9 metrics of all methods of a given Java project, based on statement level metrics. The set of metrics is discussed in later sections.
2. Related Work
Numerous tools have been implemented to compute metrics from a program’s source code. These tools are very important factors in the reliability of the metrics, as their rules are well defined formulas producing after each run the same value on a similar input. There are numerous commercial, non-commercial and open source metric tools that are available for measuring code complexity.
One commonly used metric tool is an Eclipse plug-in for Java programming language maintained by IBM, which calculates numerous metrics for the source code during build cycles and warns the tester, via the problem view of ‘range violations’ for each metric [4]. These violations are derived from rules built in the tool which can be modified to fit local conditions. This allows the user to stay continuously aware of the program’s source code’s health. One of the advantages of using this Eclipse plug-in tool is the possibility of exporting the metrics in HTML, CSV or XML format.
VizzAnalyzer Framework [5] is another software tool that measures the quality of a Java implemented software system. In the VizzAnalyzer implementation, Welf et al. [5] rely on the RECODER meta-programming library [6], providing a compiler front-end for Java programs and an API for accessing AST and semantic analysis results. The software computes a set of metrics that are well established in the literature, such as metrics from the C&K metric suite as well as newly developed metrics including Data Abstraction Coupling (DAC), Package Data Abstract Coupling (PDAC), Edge Size, Tight Class Cohesion (TCC), Tight Package Cohesion (TPC), and Lack of Documentation (LOD) [5].
In what concerns other programing languages, Pymetrics is a famous open source complexity metrics measurement tool implemented by Charney [7]. It is a tool that compiles metrics for Python source code only. Metrics include McCabe’s Cyclomatic Complexity [1, 8], LOC, etc. One of the main features of this tool is the output format. It allows users to customize their own reports as well as the option to output either to stdout, SQL files, or CSV files.
According to the article in [9], test tools can be divided into seven groups: design, implementation, evaluation, load, performance, GUI, dynamic and static analysis. In our study, we focus only on the last category, that deals with static and dynamic complexity metric tools. In this category, the most famous and widely used assessment metrics by far are the LOC (lines of code) and Cyclomatic Complexity [1, 8, 3]. However, the use of Object-Oriented (OO) languages has pushed researchers to come up with novel taxonomies of complexity metrics to evaluate OO solutions. The metrics introduced in [10] are very popular in dealing with Object-Oriented design and are used in the coding phase. The approach presented is based on mathematical formula that describe the relationships between the different variables. Moreover, the metrics proposed are designed to determine quantitative measures by studying the operators and operands used in the code. These metrics are referred to as ‘Software Science’ and are used in the development stage in order to assess the code. Another set of metrics is presented by Chidamber et al. in [11]. These metrics deal with many principles related to Object-Oriented development for the sake of enhancing software maintenance.
Numerous metrics have been introduced, discussed, scrutinized, and published. Those measurements were implemented in multiple commercial and open source tools, which raises one important question: do these metric tools produce the same values for the same metrics on the same input? This has been investigated by Lincke et al. in [12]. The authors conducted an experiment with ten commercial and free metrics tools. Using these tools, a set of nine complexity metrics were computed on the same software systems. Their investigation showed that, given the same input, metrics tools deliver different results. One reason for the disparity is the looseness of the definition of most metrics. Different tools may interpret even a simple metric such as LOC differently (e.g. are blank lines counted or not).
3. Novel Taxonomy of Complexity Metrics
In general, a metric is defined as a measurement and any measurement can be a useful metric. Software engineers use measurement throughout the entire development cycle by measuring the characteristics of software to get some notion of whether the software fulfills the requirements consistently and completely. Additionally, metrics measure the design quality and whether the software is ready for testing. Project Managers measure attributes of the product to be able to tell when the software will be ready for delivery and whether the budget will be exceeded. Customers measure aspects of the final product to determine if it meets their requirements and if its quality is sufficient. FInally, maintainers must be able to assess and evaluate the product to see what should be upgraded and improved [3].
Software metrics can be clustered into four main categories [1]:
- Product
- Process
- People
- Value of the Customer
In this paper, our focus was on the product metrics as being the main selectors for test cases. As opposed to the previous work done in the domain, we focus on the development of a comprehensive taxonomy based on two main criteria:
- Which product level is the metric applied on?
- And which feature does the metric measures at a given product complexity level?
The suggested taxonomy of metrics can be projected into a 2-dimensional space where each axis represents one criterion as shown in Figure 1 [3]. Each datapoint in the graph represents the metric computed by SCMS tool given its coordinates, where x-axis (kind) represents the type of metrics measured and the y-axis (scope) represents the product level at which the metric is applied. The grouping of data points in the graph visualizes the number of metrics under a similar type compiled at a given product level. For instance, the top right cluster of points shows that 4 metrics under data usage type are computed at the class level.
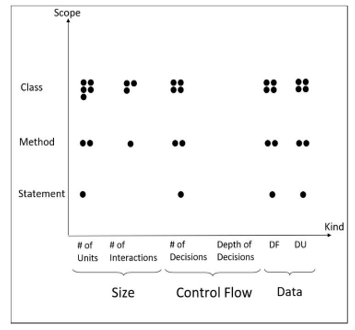 Figure 1: Our suggested taxonomy dimensions compiled by SCMS tool where y-axis (scope) represents the product level at which the metric is applied and the x-axis (kind) represents the type of metrics measured. The small clusters of datapoints in the graph shows the number of metrics under a similar type compiled at a given product level
4. Metrics at Statement Level
4.1. Data Complexity
Data complexity metrics are studied in our work by two different means, data flow and data usage. Data flow measures how the data behaves taking into consideration its interactions within the system [3, 13, 14]. It is defined as the number of ‘formal parameters of activities and the mappings between activities’ data. It tracks the flow of the data through the system in order to detect errors related to the usage and interactions of variables between each other. Data flow has been the choice of many testers due to its close relationship with the Object-Oriented principle of cohesion. On the other hand, data usage for a statement is defined to be the number of variable values used in that statement plus one if the computed equation is being assigned to a variable in that statement. It is based on the number of data defined in the unit being considered or the number of data related to that unit. From a software testing point of view, the data usage metric is simply the sum of uses (p-uses and c-uses) plus definition variables in a given statement.
4.2. Control Flow Complexity
McCabe’s Cyclomatic complexity metric [a, h, c] is a widely and well-established measurement in the literature used in this category. It has been implemented by many software complexity tools for different programming languages and especially for Object-Oriented ones. Basically, the idea behind Thomas McCabe’s metric is that software complexity increases with the number of control paths generated by its code [8]. A control path is determined by the existence of a control block, also named scope, that includes predicates as a condition to fork a flow in a path. From these observations, we chose the scope level metric of a given statement as the measurement of choice for this category. This method requires counting how many control constructs (do-while, if-else, while, for, etc.) are present in the source code [15].
4.3. Size Complexity
Size Complexity is one of the oldest measures in software engineering to quantify the length, functionality, and complexity of software [16]. One of the most widely used and easiest to compute measures in this category is the number of Lines of Code (LOC). However, many other size metrics are based on Halstead Software Science Definition [10]. It is a traditional measurement of complexity metrics tackling the issue from one single view, which is the number of operators.
Halstead measure counts all the types of operators including traditional operators (ex. +, /, and ||) and punctuations (ex. ; and () ), where one opening and closing pair of parenthesis is counted as one. From our point of view, the most important metric to identify the complexity of a statement is just the number of traditional operators. While, you can blow up Halstead metric by adding as many parentheses as one wants without altering the complexity of the system. Hence, for simplicity, we suggest using a subset of Halstead measurement dealing only with traditional operators, by counting the number of operators used in each statement.
4.4. Statement Level Metrics Summary
Table 1 represents the four metrics compiled by SCMS tool at the statement level of a Java code.
Table 1: Statement level spectrum of metrics computed by SCMS tool
| Metric Short Name | Short Description |
| NumOp | Number of Operators |
| NumLev | Number of Levels |
| DF | Data Flow |
| DU | Data Usage |
5. Metrics at Method Level
A method consists of a set of statements performing a specific functionality. Therefore, metrics at this granularity can be derived from previously computed statement metrics. For method level measurements, we suggest two strategies: the first is to calculate the sum of the same precomputed measurement of all statements in the method, and the second is to compute the maximum value of the same metric among all statements constructing the method [3, 17, 18]. This adds up to eight metrics at the method level derived from the statement level metrics. Additionally, we added a 9th metric, InMetCall, which counts the number of methods within the same class calling the method being studied.
Table 2 represents and defines the nine metrics compiled by SCMS tool at the method level of a Java code. The output is in CSV format including the class path to the method as well as its type.
Table 2: Method level spectrum of metrics computed by SCMS tool
| Metric Short Name | Short Description |
| MaxOp | Maximum number of operators of each statement in the method. Metric based on the statements results |
| TotOp | Total number of operators of each statement in the method. Metric based on the statements results |
| MaxLev | Maximum number levels at each statement in the method. Metric based on the statements results |
| TotLev | Total number of levels at each statement in the method. Metric based on the statements results |
| MaxDF | Maximum number of data flow of each statement in the method. Metric based on the statements results |
| TotDF | Total number of data flow of each statement in the method. Metric based on the statements results |
| MaxDU | Maximum number of data usage of each statement in the method. Metric based on the statements results |
| TotDU | Total number of data usage of each statement in the method. Metric based on the statements results |
| InMetCall | Number of within class method calls of the method in question |
6. Metrics at Class Level
The main entity in Object-Oriented design is the class. A class is a combination of attributes and methods. From this definition, we can derive the class level metrics given precomputed measurements at method level. Following the same approach applied to compute method level metrics, we again compute the total and the maximum of each measurement of the methods in a class [3, 17, 18].
We then add two additional metrics: the in-out degree of that class, which is the number of methods outside of that class that are called by at least one method in that class, and the number of public members within the class, i.e. attributes and methods in a class [c]. The public members within a class are defined as the public fields and the public methods declared in that class. Table 3 and Figure 2 depict the 20 metrics compiled by SCMS tool at the class level of a Java program as outputted in the CSV file by SCMS tool. Figure 2 shows how the 18 class level metrics, blue, are derived from the 9 method level ones, green, adding on top the In-Out Degree and the Number of Public Members.
7. Spectra Complexity Metric System (SCMS)
Spectra Complexity Metric System (SCMS), is a software that allows any Java software engineer to assess the complexity of a Java program using the above described metrics.
The tool is implemented using the Java 1.8 and Maven 3 framework. It makes use of the ASTParser pre-built Java library that allows you to convert a given Java class into an Abstract Syntax Tree for evaluation.
Table 3: Class level spectrum of metrics computed by SCMS tool
| Metric Short Name | Short Description |
| Tot2Op | Counts the total number of operators. (method output based) |
| TotMaxOp
|
Counts the total of the max operators. (method output based) |
| Max2Op | Counts the max of max operators. (method output based) |
| MaxTotOp | Counts the max of the total number of operators. (method output based) |
| Tot2Lev
|
Counts the total number of levels in the whole class code. (method output based) |
| TotMaxLev
|
Counts the sum of the maximum level in each method. |
| MaxTotLev
|
Counts the max of the total number of levels in each method. |
| Max2Lev
|
Counts the max level in the whole class, i.e. the deepest branch. (method output based) |
| Tot2DU | Counts the total number of data usage in the class. (method output based) |
| TotMaxDU
|
Counts the total number of the max data usage in the class. (method output based) |
| MaxTotDU | Counts the max of the total number of data usage in each method. (method output based) |
| Max2DU | Counts the max of max data usage. (method output based) |
| Tot2DF
|
Counts the total number of data flows in a class. (method output based) |
| TotMaxDF
|
Counts the total of the max data flows in each method of the class. (method output based) |
| Max2DF
|
Counts the max of max data flows in each method of the class. (method output based) |
| MaxTotDF
|
Counts the max of the total data flows in each method of the class. (method output based) |
| TotInMetCall
|
Counts the total number of within class method calls. (method output based) |
| MaxInMetCall
|
Counts the max number of within class method calls. (method output based) |
| inOutDeg | Counts the number of in class call of external methods. Similar to out degrees of a dynamic call graph. |
| pubMembers | Counts the number of members in a class. |
Figure 3 shows the UML class diagram of our tool, where CMSRunner class represents the main entry point of the software. The main class uses FileUtils functionalities to extract all the java files in the project to be assessed; then, it translates each file into an abstract syntax tree via the class Parser. This parse tree is then traversed, using AstClassExplorer and AstStatementExplorer, to retrieve the relevant information to our suggested taxonomy in
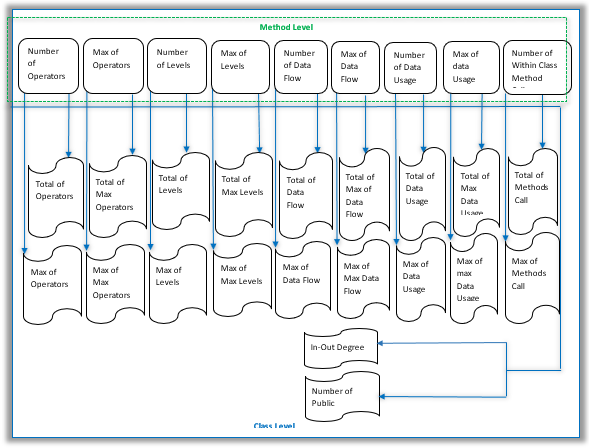 Figure 2: Taxonomy of class level complexity metrics derived from the method level ones as they are compiled by SCMS tool
order to populate the metrics fields. The metrics are organized by Scope (product level) as fields in the classes Statement, Method, and Class shown in the UML diagram.
8. SCMS Tool Evaluation and Benchmarking
In this evaluation, we focus on the product metrics category to compare existing software tools with our suggested taxonomy. As a first step, we want to showcase the importance of automated tools to calculate complexity metrics. Then provide a detailed description of the selected tools in order to make the comparison with our software. And finally, we compared our SCMS tool with the different tools based on three main levels, namely statement, method, and class level.
8.1. Manual vs. Automated Metric Evaluation
Software quality assessment has been researched by engineers and pioneers in the field to express quality attributes of a software. Therefore, solid numbers and measures should be generated for a program to better assess its complexity. Many tools have been developed to collect metrics from a system that has been implemented. Moreover, these tools have differences in myriad aspects.
The two questions that might be asked here are: why do we need tools? And why can’t we measure the complexity of a program manually or only by reading through the program’s code? The answer to these questions is that the complexity of a software has increased tremendously [16]. A system now may contain thousands of lines of code which makes measuring its complexity manually not viable.
Therefore, there is a need for tools that analyze files and components of a system rapidly and generate reports. The results will then be used to optimize the process of test case generation. These measurements can give a software developer a deep view of the different non-functional requirements such as maintainability and performance. Furthermore, a tool follows repeatable and consistent calculation procedures in assessing a program. Therefore, compiled information can be easily interpreted and analyzed via graphical and data visualization techniques. On the other hand, calculating metrics manually adds an overhead to the software testers, which may lengthen the testing phase,usually taking much more time than the development period. The manual process is very tedious, especially when it comes to complex software that contains a very large number of units [16]. Therefore, complexity metrics tools are essential in assessing the quality of a program.
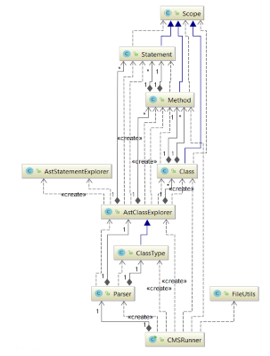 Figure 3: Simplified UML class diagram of SCMS tool
8.2. Selection Process of Tools
An investigation through the available tools online showed that most of the tools provide process and product quality attributes. In order to make a reliable benchmarking of our software, we only picked tools computing product quality metrics based on three criteria. The first criterion was to select tools that have a large set of product metrics. Second, the focus was only on tools calculating complexity metrics for object-oriented programming languages. Third, the selection was based on the ease and regularity of how tools are deployed and used. Usability of the tools was a key selection criterion in our study.
8.3. Selected Tools Summary
8.3.1 JHawk Tool
The first software tool we examined is called JHawk. JHawk was developed to compute complexity metrics for Java programs. The tool is described mainly as a static code analysis tool since it takes as input the program code to compute metrics. The computed metrics are based on several aspects ranging from relationships between components, volume, and complexity. The JHawk tool delivers both the process and the product quality metrics. We retrieved only the list of product metrics. JHawk calculates complexity metrics on all levels. The system level is the container or the upper layer as it wraps all the remaining levels which are method, class, and package level. Table 4 shows a sample set of metrics calculated by the JHawk tool at the method and class levels [19].
Table 4: Class and method level metrics measured by JHawk
| Level | Metric Name | Metric Description |
| Method | Number of Arguments | The number of arguments per method |
| Variable Declaration | The number of variables declared in the method | |
| Number of Statements | The number of statements in the method | |
| Number of Loops | The number of loops (for, while…) in the method | |
| Number of Operators | The total number of operators in the method | |
| Number of Operands | The total number of operands in the method | |
| Class | Number of Statements | The number of statements in the class |
| External Method Calls | The external methods called by the class and methods in the class | |
| Lines of Code | The number of lines of code in the class and its methods | |
| Modifiers | The modifiers (public, protected, etc) applied to the declaration of the class | |
| Local Methods Calls | The local methods called by the class and by methods in the class that are defined in the hierarchy of the class | |
| Instance variable | The instance variables defined by the class |
8.3.2 Analyst4J
Analyst4J was developed both as a plugin for Eclipse Integrated Development Environment, and as an application that can be installed and executed independently [12]. Analyst4J was designed to provide several functionalities of a Java program including:
- Computing metrics
- Analysing source code
- Generating reports containing information about a Java program
Analyst4j V1.5.0 version supports regression testing by analyzing code before and after being changed. It provides an easy to read report about the design and maintainability of the system to be used. Moreover, code quality can be easily analyzed by the tool. Analyst4J can be integrated with bug finding tools in order to maintain Java programs. It also provides several complexity metrics for java programs including complex classes and methods.
8.3.3 CCCC Tool
CCCC is a software tool designed mainly to measure Cyclomatic Complexity of code in a program. It is generally used for two main programming languages which are C and C++. The generated output from this tool is a web page containing detailed information of all the program source code. This tool is freely available for download and use [20].
CCCC generates the following information about a given program:
- The number of lines for each module in a program
- McCabe Cyclomatic Complexity metric
- Coupling between different components
- Object-oriented metrics as depth of inheritance tree
- Chidamber and Kemerer complexity suite
8.3.4. JMetric Tool
This tool was created by Cain and Vasa [21] for a project at COTAR in Australia. It calculates object-oriented metrics for the Java code. JMetric was installed to retrieve the product metrics it calculates. This tool computes complexity metrics at five different levels: project, package, class, method, and variable level. Table 5 shows a sample set of the computed metrics by JMetric at the method and class levels relevant to our product measurements comparison study.
Table 5: Class and method level metrics measured by JMetric
| Level | Metric Name | Metric Description |
| Method | Number of Statements | The number of statements in the method |
| Collaboration | Collaboration with other methods or units | |
| Cyclomatic Complexity | Cyclomatic complexity of the method | |
| Lines of Code
|
The total number of lines of code in the method | |
| Class | Number of Statements | The number of statements in the class |
| Number of Methods | The number of methods in the class | |
| Lines of Code | The number of lines of code in the class and its methods | |
| Public Methods | Count the number of public methods in the class | |
| Local Methods Calls | The local methods called by the class and by methods in the class that are defined in the hierarchy of the class | |
| Instance variable | The instance variables defined by the class |
8.3.5. NDepend Tool
NDepend was designed to analyze code developed in .NET technology. This tool has a large support for code metrics since it analyzes the program code at six different levels:
- Metrics on application
- Metrics on assemblies
- Metrics on namespaces
- Metrics on types
- Metrics on methods
- And metrics on fields
Table 6 shows a partial list of metrics calculated by the NDepend tool [22].
Table 6: Sample of complexity metrics computed by NDepend
| Level | Metric Name | Metric Description |
| Application | NbLinesOfCode | Computing the number of logical lines of code of the application |
| NbLinesOf Comment | Number of lines of comment that can be found in the application | |
| NbMethods | Number of methods for the whole application/program | |
| NbFields | The number of fields. The field can be either regular, enumeration value, or other types. | |
| Method | NbLinesOfCode | Number of lines of code inside a method |
| NbOverloads | The number of overloads of a method | |
| NbLinesOf Comment | Number of comments within a method | |
| NbParameters, | Number of methods inside a method | |
| NbVariables | Number of variables in a method | |
| Field | Size of Instance | The size in bytes of instances |
| Afferent coupling at field level (FieldCa) | The number of methods
that directly use a field |
8.3.6. Chidamber and Kemerer Java Metrics (CKJM) Tool
The Chidamber and Kemerer metrics were among the first introduced metrics in the history of software metrics.
CK metrics objectives are [23]:
- To measure unique aspects of OO approach
- To measure complexity of the design
- To improve the development of the software
Diomidis Spinellis developed a tool named CKJM [24] to compute the Chidamber and Kemeres suite of metrics. This tool measures these metrics by processing the bytecode of compiled Java files. Java files are compiled prior to be given as input to the CKJM. For each class of the program or project, CKJM provides as output the six well known metrics of Chidamber and Kemerer. The six metrics that are calculated by the CKJM are:
- WMC: Weighted methods per class
- DIT: Depth of Inheritance Tree
- NOC: Number of Children
- CBO: Coupling between object classes
- RFC: Response for a Class
- LCOM: Lack of cohesion in methods
8.4. Comparison to SCMS tool
In our benchmarking, we considered only similar metrics to our presented novel taxonomy computed by CSMS and discarded the rest. The four stated metrics at the level of a statement will be used as the basis to derive other high-level complexity metrics, namely for the method and class level.
Table 7: Statement level comparison
| Tools | Metrics | |||
| Name | Level Number | Data Flow | Data Usage | Number of Operators |
| SCMS | x | x | x | x |
| Analyst4j | x | |||
| JMetric | x | |||
| CCCC | x | |||
| CKJM | x | |||
| JHawk | x | |||
| NDepend | x | |||
Table 8: Method level comparison
| Tools | Metrics | ||||||||
| Name | Total # of levels | Max # of levels | Total # of operators | Max # of operators | Total # of DF | Max # of DF | Tot # of DU | Max # of DU | # In Method Calls |
| SCMS | x | x | x | x | x | x | x | x | x |
| NDepend | x | x | x | x | x | ||||
| Analyst4j | x | x | x | x | x | ||||
| JMetric | x | x | x | x | |||||
| CCCC | x | x | x | ||||||
| CKJM | x | x | x | ||||||
| JHawk | x | x | x | ||||||
As illustrated in Table 7, the only metric that is measured at the statement level by all the selected tools is the data flow (DF) metric. This shows the uniqueness and the added value of our tool. Likewise, at the method level in Table 8, we see that the closest tools to our software are NDepend and Analyst4j with a coverage of 55% of our suggested taxonomy. Also, three metrics in our suggested set is covered by all of the selected tools. Those are the total number of operators, the total number of DF and the maximum DF. Furthermore, since the class level metrics are derived from the method level ones by computing the sum and the maximum, we can conclude that only six metrics from a total of 18 metrics are covered at the class level by all those selected tools. Therefore, we show the novelty and the added value of our suggested taxonomy and Spectra Complexity Metric System.
9. Conclusion and Future Work
This paper presents a tool, SCMS, which evaluates and assesses a novel comprehensive taxonomy of complexity metrics, following a bottom-up approach, of any given software written in Java language. These measurements can then be used to optimize the process of test case generation by targeting the complex units in the system. The taxonomy tackles the issue from two dimensions. The first being the scope/product dimension and it covers the metrics at three granularity levels: statement, method, and class level. The second being the type of evaluation, which covers three types of metrics measurements: the size focusing on the number of units/operators, the control flow focusing on the number of decisions, and the data type focusing on both the data flow and the data usage. Those metrics have as a goal to increase the efficiency of the testing process by significantly reducing the number of test cases without having a significant drop in test effectiveness. The paper also covers the design and technology used to implement SCMS tool by providing a UML class diagram of the software which can offer insights for a starting point of any future development of new complexity metric tools. Finally, we have compared our tool with the major existing Java related tools that cover a large set of product level metrics in the market. We showed the novelty of our taxonomy of complexity metrics and the capability of our tool to compute these measurements based on the three different product categories. The tool is available as an open source at https://github.com/issararab/SCMS .
In the future, we will investigate the usability of this tool as well as other tools with their potential in software diagnosability and fault detection. Our aim is to gather a large set of features/metrics and combining them with machine learning algorithms to artificially predict the faulty units in a software. Our unit level of interest as of now is the class level.
- T. J. McCabe, C. W. Butler, “Design complexity measurement and testing”, in 1989 ACM 32, 12, 1415-1425. DOI: http://dx.doi.org/10.1145/76380.76382
- I. Arab, S. Bourhnane, Reducing the cost of mutation operators through a novel taxonomy: application on scripting languages, in 2018 Proceedings of the International Conference on Geoinformatics and Data Analysis (ICGDA ’18). ACM, New York, NY, USA, 47-56. DOI: https://doi.org/10.1145/3220228.3220264
- F. Bouchaib and K. Magel. (2015). “Taxonomy Dimensions of Complexity Metrics” Int’l Conf. Software Eng. Research and Practice , pp. 96-102: Las Vegas, Nevada, USA. Available: https://www.researchgate.net/publication/281858313_Taxonomy_Dimensions_of_Complexity_Metrics
- https://marketplace.eclipse.org/content/eclipse-metrics (accessed on May 2019)
- L. Welf, E. Morgan, L. Jonas, P. Thomas, P. Niklas, VizzAnalyzer- A Software Comprehension Framework, 2003 Available: https://www.researchgate.net/publication/241753972_VizzAnalyzer-_A_Software_Comprehension_Framework
- A. Ludwig, RECODER Homepage, http://recoder.sf.net, 2001.
- R. Charney, Programming Tools: Code Complexity Metrics, Jan 2005, Available: https://www.linuxjournal.com/article/8035
- T. J. McCabe, “A Complexity Measure”, in July 1976 IEEE Trans. Softw. Eng. 2, 4, 308-320. DOI: https://doi.org/10.1109/TSE.1976.233837
- P. Pohjolainen, Software Testing Tools, Department of Computer Science and Applied Mathematics, 2002. Available: http://cs.uef.fi/uku/tutkimus/Teho/SoftwareTestingTools.pdf
- M. H. Halstead. “Elements of Software Science (Operating and Programming Systems Series)”. Elsevier Science Inc., New York, NY, USA, 1977
- S. R. Chidamber, C. F. Kemerer, “A Metrics Suite for Object Oriented Design”. in June 1994 IEEE Trans. Softw. Eng. 20, 6, 476-493. DOI=http://dx.doi.org/10.1109/32.295895
- R. Lincke, J. Lundberg, W. Löwe,”Comparing software metrics tools”. in 2008 In Proceedings of the 2008 international symposium on Software testing and analysis (ISSTA ’08). ACM, New York, NY, USA, 131-142. DOI: https://doi.org/10.1145/1390630.1390648
- J. Cardoso, “Control-Flow Complexity Measurement of Processes and Weyuker’s Properties,” Word Academy of Science, Engineering and Technology, August 2005.
- J. Cardoso, “Control-flow Complexity Measurement of Processes and Weyuker’s Properties.” in 2007 International Journal of Mathematical and Computational Sciences Vol:1, No:8, 2007. doi.org/10.5281/zenodo.1076476
- J. Cardoso, How to Measure the Control-flow Complexity of Web processes and Workflows, Workflow Handbook, Future Strategies Inc., pp.199-212, 2005
- A. Arenas, J. Duch, A. Fernandez, S. Gomez, “Size Reduction of Complex Networks Preserving Modularity”, in 2007 New Journal of Physics 9, P. 176, iopscience.iop.org/article/10.1088/1367-2630/9/6/176
- Y. Shin, A. Meneely, L. Williams, J. A. Osborne, “Evaluating complexity code churn and developer activity metrics as indicators of software vulnerabilities”, in 2011 IEEE Transactions on Software Engineering, vol. 37, no. 6, pp. 772-787
- B. Falah, K. Magel. (2013 ) “Test Case Selection Based on a Spectrum of Complexity Metrics”. Proceedings of 2012 on International Conference on Information Technology and Software Engineering (ITSE), Lecture Notes in Electrical Engineering , Volume 212, pp. 223-235, DOI: 10.1007/978-3-642-34531-9_24
- Virtual Machinery, “Download JHawk Trial Version”, Virtual Machinery, 2017. [on ligne]. Available: http://www.virtualmachinery.com/jhdownload.htm
- B. Wicht, (August 2011) “How to Compute Metrics of C++ project using CCCC”. [on ligne]. Available: https://baptiste-wicht.com/posts/2011/08/compute-metrics-of-c-project-using-cccc.html
- A. Cain, R. Vasa, and D. Franek, Source Forge.( accessed. 20.05.2019) Available: https://sourceforge.net/p/jmetric/wiki/Home/
- P. Smacchia, “Partitioning Your Code Base Through .NET Assemblies and Visual Studio Projects,” Redgate Hub, accessed. 10.06.2019 Available: https://www.red-gate.com/simple-talk/dotnet/net-framework/partitioning-your-code-base-through-net-assemblies-and-visual-studio-projects/.
- S. R. Chidamber and C. F. Kemerer , “Towards a Metrics Suite for Object Oriented Design”, in October 1991 C onference proceedings on Object-oriented programming systems, languages, and applications (OOPSLA ’91), Andreas Paepcke (Ed.). ACM, New York, NY, USA, 197-211. DOI=http://dx.doi.org/10.1145/117954.117970
- Diomidis Spinellis. Tool writing: A forgotten art? IEEE Software, 22(4):9–11, July/August 2005. (doi:10.1109/MS.2005.111).