Fraud Detection Call Detail Record Using Machine Learning in Telecommunications Company

Adv. Sci. Technol. Eng. Syst. J. 5(4), 63–69 (2020);
 DOI: 10.25046/aj050409
Fraud calls have a serious impact on telecommunications operator revenues. Fraud detection is very important because service providers can feel a significant loss of income. We conducted a fraud research case study on one of the operators that experienced fraud in 2009 and 2018. Call Detail Record (CDR) containing records of customer conversations such as source and destination number, call start time, duration of calls at the operator can be a source of information to use in fraud detection. The method used in this study uses machine learning with unsupervised learning techniques which are quite popular methods used in fraud detection. The purpose of this study is to propose an effective method that can be applied to detect fraud on the CDR. Variables used include caller number, number dialled, duration, fee and destination city of the dataset totalling 11,418 rows from record periods 01 to 31 May 2018. In analyzing our CDR using the K-Means and DBSCAN algorithms, we then evaluate the results to calculate accuracy by comparing to actual fraud data. Based on evaluations using confusion matrix on actual CDR fraud, we obtained the K-Means algorithm to show a better accuracy value to model fraud on telecommunications CDR compared to DBSCAN.
1. Introduction
Fraud in the telecommunications industry has a serious impact on revenue and customer relationships, especially when losses continue to increase over time [1]. As the telecommunications industry advances, the problem of telecommunications fraud has also grown in recent years [2]. The telecommunications company, which is the case study in this research has adopted VoIP (Voice over Internet Protocol) since 2015, which previously applied EWSD (Electronic Worldwide Digital Switch) technology. The company experienced a fraud incident in 2009 with a total loss of up to Rp 1 billion, fully borne by the company. The case was caused by traffic from customers to use telephone numbers to international numbers with quite expensive rates and frequent calls. As we know IP technology allows connections that are more flexible than analogue but also open more gaps for attackers to abuse the network and use unauthorized services. Despite using VoIP technology much better than EWSD, it still happens in 2018 with a total loss of up to Rp 28 million in which the company bore 15%, the customer bore 85%. This number has dropped dramatically compared to cases that have been experienced before, but this is still an important thing to follow up for the company due to the unavailability of anomalous detection that handles this event. Instead of reducing similar risks, precautions are taken by closing international call gates for call traffic to the destination country that was once indicated as an anomaly. This problem motivates us to provide a solution for fraud modelling to find out the call history of potential customers as an anomaly, by grouping potential calls as a fraud. With this effort, it is expected that the customer will fully bear the final use burden that is billed to the customer because it does not include improper use.
Fraud according to the Black’s Law Dictionary is intentional fraud or dishonesty committed by one or more individuals, generally intended for financial gain [3]. Telecommunications fraud is a combined illegal activity of subscription identity theft, unauthorized access and fraudulent sharing of international traffic revenue [4]. Fraud detection is a popular application used by the Revenue-assurance division to detect and stop all types of fraud on wired and wireless networks [5]. Fraud detection is very important because providers can feel a significant loss of income due to anomalies [6]. Telecommunications companies often experience huge financial losses due to fraud incidents caused by their services, and this makes the importance of fraud detection to reduce the impact of this risk [7]. Fraud on telecommunications can be divided into several types, and the most typical is accessing calls using the original customer account to make fraudulent calls [8]. Imagine an unknown call from a local number, and that from a friend or family who lives abroad, it’s really strange to receive international calls from a local number, basically this also fraud [9]. Current technology has provided protection against various attacks, but not many are designed to detect complex fraud operations [10]. When using VoIP, several problems in security and quality of service will arise, VoIP infrastructure must be equipped with a security shield to protect itself from various forms of security threats [11]. The traditional approach to detecting fraud in telecom is usually only by blacklisting the numbers that commit fraud. It can be tricked by changing their numbers which is very easy to do on VoIP technology [12].
The pattern of call traffic is expected to be understood by telecommunications provider with the availability of CDR (Call Detail Record) [13]. The CDR contains spatio-temporal data sets that researchers can use in various fields, and also by investigators [14]. CDR have contained metadata such as source and destination number, call start time, call duration, associated with each telephone call [15]. When the CDR is combined, we can pair accounting and historical data from each call so that it is possible to get a complete picture of service and customer billing [16]. The CDR contains billions of detailed call records with descriptive information available for mining, which is very important for marketing and can also be used to identify fraud activities [17]. Analysis of the CDR can determine the specific activities of users in a particular region at a certain date or time, abnormal behavior, or when there are changes in the pattern of user activity in the region can be considered an anomaly [18]. Massive data sources such as CDR to effectively analyze large amounts of data are the main challenges faced by telecommunications operators, especially when new techniques and machine learning algorithms that require large enough memory [19].
In large data sets in many cases, the original tags of the data are not always available, so it is not possible for researchers to use supervised learning methods. This is the main reason why unsupervised learnings such as clustering are widely used in data mining for CDR. K-means algorithm is the most common partitioning method [20]. Another technique is to classify data into groups using DBSCAN (Density-Based Spatial Clustering of Applications with Noise), which is a density-based clustering algorithm [21]. Some existing clustering methods can balance accuracy and efficiency, but cluster quality is not so good that researchers usually combine other algorithms or use optimization strategies to improve the clustering method [20].
Based on the fraud problem above, we propose a fraud detection mechanism that can be applied effectively in telecommunications companies. Our approach is to analyze and clustering the CDR to find anomalies traffic using machine learning. Through machine learning, we can get a bunch of suspicious calls and help companies find fraud in the cluster. In this study, we made the following contributions:
- Propose an effective method implemented to detect fraud within call detail record analysis, utilizing variables that are quite prominent on traffic patterns in the telecommunications company case study.
- Using machine learning with unsupervised learning techniques to detect anomaly traffic, using the K-means algorithm and DBSCAN to find the best performing techniques for detecting fraud.
- In this study, we used a CDR which contained a fraud label to evaluate the performance of the method used. The results obtained show that our approach can detect fraud quite accurately.
2. Related Works
Related works are based on fraud detection using the methodology of unsupervised learning and semi-supervised. Presentation of the concept of identification and verification of anomalies using clustering methods to process the partitioning of data groups into a small number of groups and subgroups using the K-means algorithm. Information is obtained from the cellular network CDR which is exploited to determine the user’s anomalous behavior at a certain date and time. The results obtained are a number of clusters with different data points, where groups that have fewer objects or data points are groups that contain anomalous activity. Evaluation is done by training the neural network model with anomaly and anomaly free data and observing the mean squared error. The conclusion is to use the k-mean clustering technique to show unusual user activity or referred to as an anomaly [22].
Another approach taken is to analyze the difference between fraud and normal call characteristics using the K-means algorithm for a series of statistical features, including the number of calls per number, average talk time, variant talk, time, number of roaming calls, and number of numbers called , etc. The results show that elements in the cluster with high call counts, low talk ratios, low call success rates, call durations have high peak values and large standard deviations, but the small average value in this cluster is most likely fraudulent activity. Evaluate using Hopkins statistics and choose the appropriate grouping parameters through network search. Hopkins statistics are calculated on a data set obtained after principal component analysis, and the results are 0.998 with data having a high tendency to the group. The conclusion in this paper using CDR data to train the K-Means model, potential category information and some feature patterns can be found through various cluster analysis. The method in this article does not require class annotations, which reduces data acquisition difficulties. When the amount of data increases, the accuracy in fraud detection increases [23].
There is further research that combines K-means with Dynamic Time Warping (DTW) to determine the distance between sample points and produce a partition basis on time series data with each individual feature. Furthermore, the results of grouping individual features are included in the final result. The results show that experiments in real-time data sets show the effectiveness of this method. The results of the grouping were evaluated using internal (Number of Quadratic Errors) and external indicators (Purity of each group was calculated from primitive data labels). On this basis, several features were chosen to do a combinational grouping based on K-means. The conclusion in this study, most of the features built can describe user behavior and identify groups with a higher proportion of fraud. Experiments show that the grouping method that combines better than traditional K-means. In addition, combinational grouping methods based on grouping single features have helpful results, which can help identify fraud groups that have certain behavioral models [20].
The difference between this study and the previous study is that practiced two algorithms to analyze CDR to provide results in fraud detection, which are K-Means and DBSCAN. The minPts value for calculations on DBSCAN is same with k value in K-Means clustering, which is obtained through the elbow method. While the eps parameter values on DBSCAN, we propose various from the default is 0.5, 1 and 1.5 therefore to obtain the appropriate eps value used that is 1.5, and the variables we use in the experiment are only those that we think need to be analyzed and provide enough information to analyze fraud. For the results of this study, we conducted an evaluation using accuracy, recall, and precision from the CDR which contained actual fraud information. Accordingly, we will immediately receive result the methods we use with machine learning.
3. Research Methodology
The research framework can be the basis for determining the steps to be taken in research. Next will be followed by a discussion of methods that will be used to realize solutions to research problems.
3.1. Proposed Methods
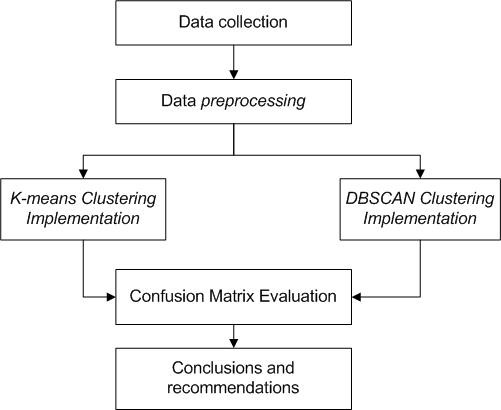
Based on the latest methods and trends methods for detection of anomalies in the field of telecommunications. In this paper we propose that DBSCAN and K-Means use research variables that influence fraud activities, namely source number, destination number, duration, cost, and destination country. With this combination it is hoped that CDR can better analyze the identification of anomalies in the call log. In addition, the CDR used contains actual fraud in accordance with identification from the company. So, it will be easier to evaluate the results of the algorithm used to measure the accuracy of the results obtained. Research framework can be seen in Figure 1.
3.2. K-Means
K-means is one of the algorithms that enters the application of data mining with a non-hierarchical clustering method, while the required clustering is data that has no label or class [24]. K-means method is quite simple, starting with the selection of the number of clusters as many K pieces and then K pieces of data are taken randomly from the dataset as centroids to represent a cluster. All data is then calculated the distance from the centroid and each data will be a member of a cluster represented by a centroid that has the closest distance to the data. Finally, the recalculation of the centroid value obtained from the average value of each cluster [25]. The steps in the K-Means algorithm are as follows [24]:
- Determine the value of K.
- Take K from the dataset randomly as centroid.
- Calculate the distance of each data with each centroid
Definition 1: Calculate the Euclidean distance between two points in space [26] :
$$d(x_i, y_j) = \sqrt{(x_{i1} – y_{j1})^2 + (x_{i2} – y_{j2})^2 + \cdots + (x_{in} – y_{jm})^2} \tag{1}$$
Where \(d(x_i, y_j)\) : distance between data x to data y, \(x_i\) : data x, and \(y_i\) : data y.
Definition 2: The average distance between data objects:
$$MeanDist = \frac{1}{c_n^2} \sum d(x_i, x_j)\tag{2}$$
Where n is the number of data objects in the data set, \(C_n^2\) is the number of couples taken from n data points.
- Determine the cluster membership of each data. Data becomes a member of the cluster with the closest centroid distance.
- Update the centroid point value.
$$\mu_k = \frac{1}{N_k} \sum_{i=1}^{N_k} x_i \tag{3}$$
\(\mu_k\) : centroid point of the K-cluster
\(N_k\) : the amount of data in the K-cluster
\(x_i\) : i data in K-cluster
- Repeat steps two through five until there are no more cluster member changes.
The K-means Flowchart can be seen in Figure 2
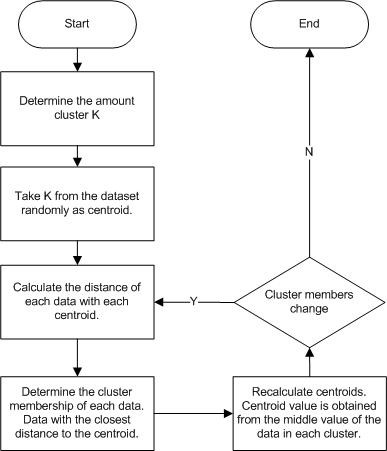
Figure 2: K-Means Flowchart [24]
3.3. DBSCAN
Density-Based Spatial Clustering of Application with Noise (DBSCAN) is a clustering algorithm based on data density. The concept of density is the amount of data (Minpts) within the eps radius (ɛ) of each data [27]. The DBSCAN flowchart algorithm can be seen in Figure 3.
$$N_{Eps(p)} = \{ \underline{q} \in D \mid \underline{dist}(p, q) < \underline{eps} \} \tag{4}$$
𝑁𝐸𝑝𝑠(𝑝) : Minimum number of points for a cluster
𝑒𝑝𝑠 : Maximum distance from spatial data
𝑑𝑖𝑠𝑡(𝑝, 𝑞) : The distance between point p and point q
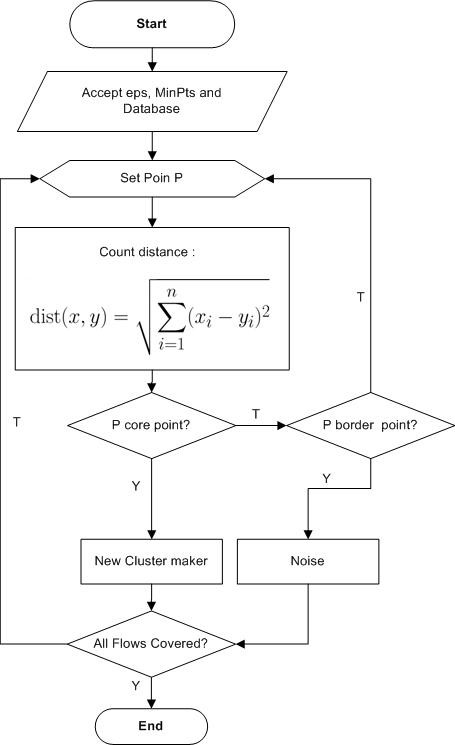
- Determine the eps and minpts values.
DBSCAN algorithm requires two parameters : Eps, which is used to determine the neighbouring area of an object (or point) and MinPts, which is the minimum number of points in the Eps radius [28]. In this study, it is proposed to determining the value of Eps and MinPts with trial and error parameter, meaning that it determines the value of a parameter must be doing several times to get the expected number of clusters.
- Specify random P points to start clustering.
- Calculate all distances between points that have a density-reachable to the value of P.
- If the number of points is greater or equal to MinPts then P is a core point and a cluster will be formed.
- If p is a border point, it will proceed to another point.
DBSCAN can only be used on 2-dimensional spatial data. In another study, the DBSCAN algorithm was modified so that it could be used on spatial objects in 3-dimensional space [29]. This equation will be used to calculate distances in 3D space :
$$d(x_1, y_1, z_1), d(x_2, y_2, z_2) = \sqrt{(x_1 – x_2)^2 + (y_1 – y_2)^2 + (z_1 – z_2)^2} \tag{5}$$
3.4. Confusion Matrix
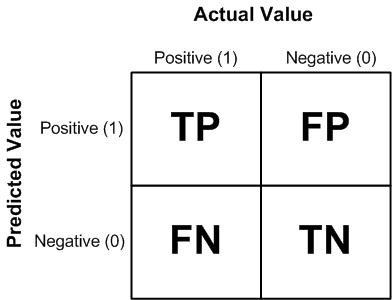
Accuracy singly takes not tell the full story when working with unbalanced class datasets, where there is a significant discrepancy between the number of positive (fraud) and negative (non-fraud) labels [1]. Precision, Recall [30] and accuracy [31] can be used as criteria for classifier evaluations. This parameter is related to True Positive and False Positive (TP / FP) which refers to the number of positive predicted true / false, and also True Negative and False Negative for the number of negative predicted true / false (TN / FN). Confusion Matrix can be used to measure machine learning performance in classification, it can be seen in Figure 4.
$$Precision = \frac{TP}{TP + FP} \tag{7}$$
$$Accuracy = \frac{TP + TN}{TP + TN + FP + FN} \tag{8}$$
4. Results & Discussion
Data preprocessing and evaluation of call fraud detection proposed using machine learning by utilizing Jupyter Notebook (Anaconda3) as a Python programming language tool.
4.1. Data collection
We use CDRs from customer billing records for the usage period from 01 to 31 May 2018. The data sources obtained were 11,418 rows and had many atribut and we choose 6 attributes to be used as research variables like anumber (Caller ID), bnumber (Called ID), duration, fee (cost), destination, and type. Dataset can be seen in Table 1.
Table 1. Dataset
| Index | anumber | bnumber | duration | fee | destination | type |
| 0 | 6277XXXX | 15002XX | 434 | 6000 | callcenter | Injapati |
| 1 | 6277XXXX | 15002XX | 172 | 2250 | callcenter | Injapati |
| 2 | 6277XXXX | 15002XX | 183 | 3000 | callcenter | Injapati |
| … | … | … | … | … | … | … |
| … | … | … | … | … | .. | … |
| 11415 | 6277XXXX | 0101760X | 242 | 18000 | Malaysia | VoIP 01017 |
| 11416 | 6277XXXX | 0101760X | 3 | 3600 | Malaysia | VoIP 01017 |
| 11417 | 6277XXXX | 0101760X | 7 | 3600 | Malaysia | VoIP 01017 |
4.2. Data Preprocessing
In the data preprocessing phase, the data will be cleaned to correct or delete data that is incorrect, incomplete, inaccurate, or has the wrong format to produce high-quality data. We also drop data with Local, Injapati and SLJJ call types. The remaining types of calls are international calls, among others SLI 001, SLI 007, and VoIP 01017. So, the current amount of data used for the calculation is 4,158. New dataset can be seen in Table 2.
Table 2. New dataset
| Index | anumber | bnumber | duration | fee | destination | type |
| 167 | 6277XXXX | 00176XXX | 14 | 2864 | Russia Fed | SLI 001 |
| 168 | 6277XXXX | 00196XXX | 7 | 3818 | Uni Emirat Arab | SLI 001 |
| 169 | 6277XXXX | 00149XXX | 20 | 4295 | Germany | SLI 001 |
| … | … | … | … | … | … | … |
| … | … | … | … | … | .. | … |
| 11415 | 6277XXXX | 0101760X | 242 | 18000 | Malaysia | VoIP 01017 |
| 11416 | 6277XXXX | 0101760X | 3 | 3600 | Malaysia | VoIP 01017 |
| 11417 | 6277XXXX | 0101760X | 7 | 3600 | Malaysia | VoIP 01017 |
After that, we change the value of the data of strings by encoding it into numbers so that it can be used as a variable for the clustering method. Encoding dataset can be seen in Table 3.
Table 3. Encoding dataset
| Index | anumber | bnumber | duration | fee | destination | type |
| 167 | 263 | 952 | 12 | 3 | 33 | 0 |
| 168 | 256 | 1167 | 5 | 6 | 46 | 0 |
| 169 | 169 | 126 | 18 | 8 | 15 | 0 |
| … | … | … | … | … | … | … |
| … | … | … | … | … | … | … |
| 11415 | 262 | 1210 | 240 | 37 | 52 | 2 |
| 11416 | 262 | 1211 | 1 | 5 | 52 | 2 |
| 11417 | 262 | 1211 | 5 | 5 | 52 | 2 |
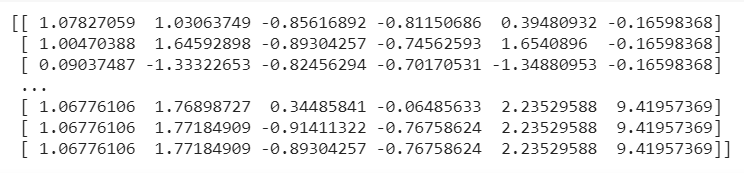
Finally, we create a scaler for change the data will have an average value of 0 and a standard deviation of 1 with Standard Scaler. The standard scaler technique is useful for compiling data according to different units from all dataset. Scaler dataset can be seen in Figure 6.
4.3. K-Means Clustering Implementation
In this research, the K value is defined by using the Elbow Method as a method that can be used to determine the best number of clusters by seeing at the percentage of comparison results within the number of clusters that will form an elbow at a point. While determining the value of k cluster on K-means the author utilises machine learning to find the Elbow Method to determine the number of clusters from the data set.
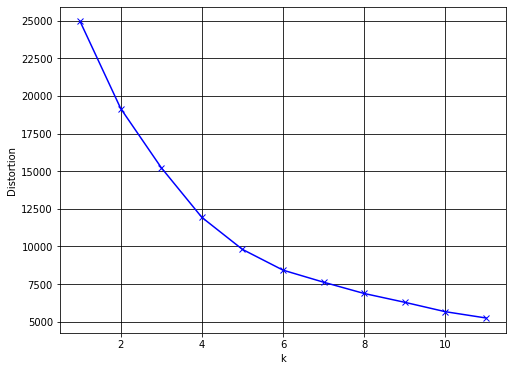
Figure 7 shows the curve value from Elbow method. Based on the graphic, it can be seen that the number of the maximum number of clusters is 6.
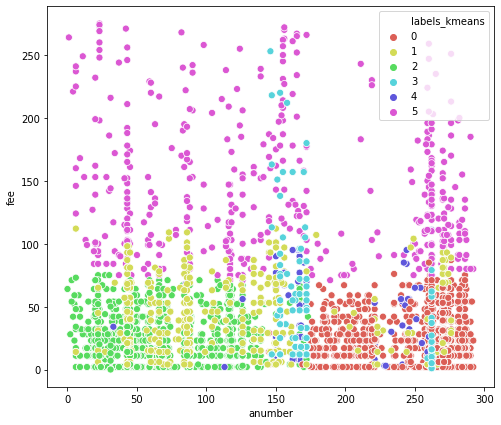
The above plot in figure 8 is useful for interpretation of normal traffic and anomalies in data groups. This graphical representation provides how well each object is located in each cluster. Axis x describes Anumber and Axis y describes Fee. From the graph, we clearly observe that some points originate from cluster 0 to cluster 5, where cluster 4 we consider to be an anomaly data and other clusters are normal data.
4.4. DBSCAN Clustering Implementation
When determining the eps value in DBSCAN clustering, the author tries a suitable value to use that is 1.1 and for the minPts parameter uses the same k value as K-Means which is 6.
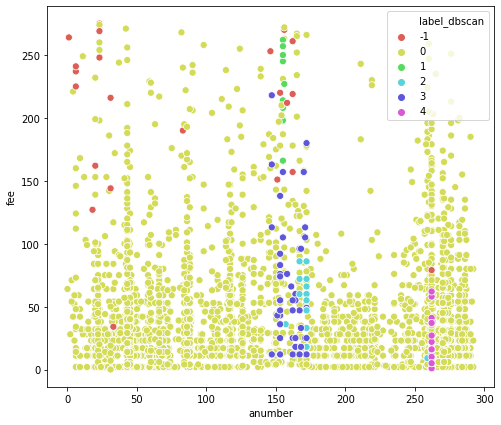
The above plot in figure 9 is useful for interpretation of normal traffic and anomalies in data groups. Axis x describes Anumber and Axis y describes Fee. From the graph, we clearly observe that some points are from cluster -1 to cluster 4 shows that the point in cluster -1 is an anomaly data.
4.5. Confusion Matrix Evaluation
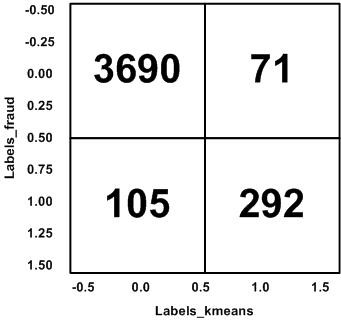
Based on the proposed method, we evaluate the results of fraud discovered from K-Means and DBSCAN clustering with actual fraud data. The evaluation practices Confusion Matrix to calculate accuracy, precision, and recall. Figure 10 shows the results of the confusion matrix for K-Means, the number of True Positives (TP) obtained is 3690, False Positive (FP) is 71, False Negative (FN) is 105 and True Negative (TN) is 292.
The result of the confusion matrix for DBSCAN can be shown on Figure 11, for the number of True Positives (TP) obtained is 3738, False Positive (FP) is 23, False Negative (FN) is 397 and True Negative (TN) is 0.
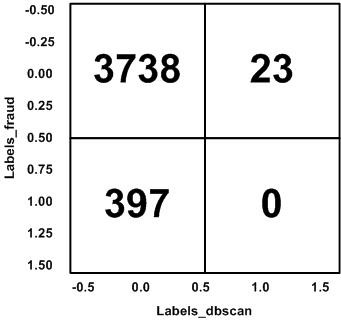
Table 4 below shows the performance comparison from the evaluation using the confusion matrix for the accuracy, precision, and recall of each algorithm.
Table 4. Performance comparison of the K-Means and DBSCAN algorithms
| Algorithms | Accuracy | Precision | Recall |
| K-Means | 0.972332016 | 0.981122042 | 0.957671958 |
| DBSCAN | 0.903990326 | 0.993884605 | 0.898989899 |
5. Conclusion
We have detected anomalies in telecommunications CDR using machine learning methods with the K-Means and DBSCAN algorithms. Our results found that this algorithm was quite good to be used in detecting fraud on telecommunications CDRs. This is demonstrated through the results of accuracy based on evaluations using actual fraud data. The problem of quality in clustering can be tested by comparing the results with other clustering algorithms. In our study, the accuracy of the algorithm used was not much different. K-Means algorithm shows better accuracy value compared to DBSCAN. So that we can conclude an effective method that can be applied to detect fraud in the CDR is the machine learning method using the K-Means algorithm.
The results of this study also address the problems that occur in case studies of telecommunications operators that do not yet have alternative approaches in detecting fraud in their services. Other problems such as fraud detection in large datasets can also be solved using this method because K-Means as one of the techniques of unsupervised learning can properly handle large amounts of data. Future research includes the application of other clustering methods, or other unsupervised learning techniques such as hierarchical grouping and other clustering algorithms. It is expected that further research can provide better results in telecommunications fraud detection includes more techniques for fraud detection then compared to each other.
Based on the results of our studies, we realize that fraud problems will always develop over time and their handling will also be different in each case. This causes the results of our research will not necessarily give good results if applied to other telecommunications operators and or indifferent fraud cases.
- M. Arafat, A. Qusef and G. Sammour, “Detection of Wangiri Telecommunication fraud using ensemble learning” in 2019 IEEE Jordan International Joint Conference on Electrical Engineering and Information Technology (JEEIT), 2019. https://doi.org/10.1109/JEEIT.2019.8717528
- M. Liu, J. Liao, J. Wang and Q. Qi, “AGRM: Attention-based graph representation model for Telecom fraud detection” in ICC 2019-2019 IEEE International Conference on Communications (ICC), 2019. https://doi.org/10.1109/ICC.2019.8761665
- S. Gee, Fraud and Fraud Detection: A Data Analytics Approach, Hoboken: John Wiley & Sons, Inc., 2015.
- V. Jain, “Perspective analysis of telecommunication fraud detection using data stream analytics and neural network classification based data mining” International Journal of Information Technology, 9(3), 303-310, 2017. https://doi.org/10.1007/s41870-017-0036-5
- T. Russell, Signaling system# 7 (Vol. 2), New York: McGraw-Hill, 2002.
- C. S. Hilas, P. A. Mastorocostas and I. T. Rekanos, “Clustering of telecommunications user profiles for fraud detection and security enhancement in large corporate networks: a case study” Applied Mathematics & Information Sciences, 9(4), 1709, 2015. https://doi.org/10.12785/amis/090407
- A. S. Yesuf, L. Wolos and K. Rannenberg, “Fraud risk modelling: requirements elicitation in the case of telecom services” in International Conference on Exploring Services Science, 2017. https://doi.org/10.1007/978-3-319-56925-3_26
- S. Subudhi and S. Panigrahi, “A hybrid mobile call fraud detection model using optimized fuzzy C-means clustering and group method of data handling-based network” Vietnam Journal of Computer Science, 5(3-4), 205-217, 2018. https://doi.org/10.1007/s40595-018-0116-x
- I. Ighneiwa and H. Mohamed, “Bypass fraud detection: Artificial intelligence approach,” arXiv preprint arXiv:1711.04627, 2017.
- E. Eifrem, “Graph databases: the key to foolproof fraud detection” Computer Fraud & Security, 2016(3), 5-8, 2016. https://doi.org/10.1016/S1361-3723(16)30024-0
- M. Kolhar, A. Alameen and M. Gulam, “Performance evaluation of framework of VoIP/SIP server under virtualization environment along with the most common security threats” Neural Computing and Applications, 30(9), 2873-2881, 2018. https://doi.org/10.1007/s00521-017-2886-y
- Q. Zhao, K. Chen, T. Li, Y. Yang and X. Wang, “Detecting telecommunication fraud by understanding the contents of a call” Cybersecurity, 1(1), 8, 2018. http://doi.org/10.1186/s42400-018-0008-5
- S. Zoldi, “Using anti-fraud technology to improve the customer experience” Computer Fraud & Security, 2015(7), 18-20, 2015. https://doi.org/10.1016/S1361-3723(15)30067-1
- E. Abba, A. M. Aibinu and J. K. Alhassan, “Development of multiple mobile networks call detailed records and its forensic analysis” Digital Communications and Networks, 5(4), 256-265, 2019. https://doi.org/10.1016/j.dcan.2019.10.005
- J. Liu, B. Rahbarinia, R. Perdisci, H. Du and L. Su, “Augmenting telephone spam blacklists by mining large CDR datasets” in Proceedings of the 2018 on Asia Conference on Computer and Communications Security, 2018. https://doi.org/10.1145/3196494.3196553
- A. Minessale II and G. Maruzzelli, Mastering FreeSWITCH, Packt Publishing Ltd, 2016.
- K. C. Mondal and H. B. Barua, “Fault analysis and trend prediction in telecommunication using pattern detection: Architecture, Case Study and Experimentation” in International Conference on Computational Intelligence, Communications, and Business Analytics, 2018. https://doi.org/10.1007/978-981-13-8578-0_24
- C. Gunavathi, R. S. Priya and S. L. Aarthy, “Big data analysis for anomaly detection in telecommunication using clustering techniques” in Information Systems Design and Intelligent Applications, 2019. https://doi.org/10.1007/978-981-13-3329-3_11
- N. R. Al-Molhem, Y. Rahal and M. Dakkak, “Social network analysis in Telecom data” Journal of Big Data, 6(1), 99, 2019. https://doi.org/10.1186/s40537-019-0264-6
- Y. Yu, X. Wan, G. Liu, H. Li, P. Li and H. Lin, “A combinatorial clustering method for sequential fraud detection” in In 2017 International Conference on Service Systems and Service Management, 2017. https://doi.org/10.1109/ICSSSM.2017.7996302
- R. Hong, W. Rao, D. Zhou, C. An, Z. Lu and J. Xia, “Commuting Pattern Recognition Using a Systematic Cluster Framework” Sustainability, 12(5), 1764, 2020. https://doi.org/10.3390/su12051764
- K. Sultan, H. Ali and Z. Zhang, “Call detail records driven anomaly detection and traffic prediction in mobile cellular networks” IEEE Access, 6, 41728-41737, 2018. https://doi.org/10.1109/access.2018.2859756
- X. Min and R. Lin, “K-means algorithm: Fraud detection based on signaling data” in In 2018 IEEE World Congress on Services (SERVICES), 2018. https://doi.org/10.1109/services.2018.00024
- J. Suntoro, Data Mining: Algoritma dan Implementasi dengan Pemrograman PHP, Elex Media Komputindo, 2019.
- S. Adinugroho and Y. A. Sari, Implementasi Data Mining Menggunakan Weka, Universitas Brawijaya Press, 2018.
- C. Xiong, Z. Hua, K. Lv and X. Li, “An improved K-means text clustering algorithm by optimizing initial cluster centers” in In 2016 7th International Conference on Cloud Computing and Big Data (CCBD), 2016. https://doi.org/10.1109/CCBD.2016.059
- G. C. Ngo and E. Q. B. Macabebe, “Image segmentation using K-means color quantization and Density-Based Spatial Clustering of Applications with Noise (DBSCAN) for Hotspot Detection in Photovoltaic modules” in 2016 IEEE region 10 conference (TENCON), 2016. https://doi.org/10.1109/tencon.2016.7848290
- F. O. Ozkok and M. Celik, “A new approach to determine Eps parameter of DBSCAN algorithm” International Journal of Intelligent Systems and Applications in Engineering, 5(4), 247-251, 2017. https://doi.org/10.18201/ijisae.2017533899
- I. D. Id and E. Mahdiyah, “Modifikasi DBSCAN (Density-Based Spatial Clustering With Noise) pada Objek 3 Dimensi,” Jurnal Komputer Terapan, 3(1), 41-52, 2017. https://doi.org/10.13140/RG.2.2.22346.67529
- M. Lenning, J. Fortunato, T. Le, I. Clark, A. Sherpa, S. Yi, P. Hofsteen, G. Thamilarasu, J. Yang, X. Xu, T. K. Hsiai, H. Cao and H. D. Han, “Real-time monitoring and analysis of zebrafish electrocardiogram with anomaly detection” Sensors, 18(1), 61, 2018. https://doi.org/10.3390/s18010061
- E. Alpaydin, Introduction to machine learning, MIT press, 2020.