Human Emotion Recognition Based on EEG Signal Using Fast Fourier Transform and K-Nearest Neighbor
 , Akbar Muslim 1, Dewi Eko Wati 2, Intan Puspitasari 2, Ahmad Azhari 3, Murein Miksa Mardhia 3
Adv. Sci. Technol. Eng. Syst. J. 5(6), 1082–1088 (2020);
 DOI: 10.25046/aj0506131
Human emotional states can transform naturally and are recognizable through facial expressions, voices, or body movements, influenced by received stimuli. However, the articulation of emotions is not practicable by every individual, even when feelings of joy, sadness, or otherwise are experienced. Biomedically, emotions affect brain wave activities, as the continuously functioning brain cells communicate through electrical pulsations. Therefore, an electroencephalogram (EEG) is used to capture input from brain signals, study impulses, and determine the human mood. The examination generally included observing a person’s frame of mind in response to a given stimulus where the immediate results were inconclusive. In this study, the associated classifications were normal, focused, sad, and shocked. The raw brainwave data from 50 subjects were recorded by employing a single-channel EEG called the Neurosky Mindwave. Meanwhile, the assessments were performed while the candidates’ minds were stimulated by listening to music, watching videos, or reading books. The Fast Fourier Transform (FFT) method was utilized for feature extractions, along with the K-nearest neighbours (K-NN) for classifying brain impulses. The parameter k had a value of 15, and the average classification accuracy was 83.33%, while the highest accuracy for the focused emotional state was 93.33%. The Neurosky Mindwave in conjunction with the FFT and KNN techniques is potential analytical solutions to facilitate the enhanced identification of human emotional conditions.
1. Introduction
The signal of the brainwaves has specific traits and characteristics of the person. The brainwaves cannot be imitated or interpreted by individuals so that there is no chance of resemblance. Identity recognition is essential to identify the features of the person [1].
Identity development is done using biometric technology, which aims at personality-implantation through the use of parts of the body or social behavior—application of Identity Recognition using Biometrics Technology for self-recognition by using parts of the body or human behavior [2-6]. In [7], the author has presented machine-learning algorithms to categorize EEG dynamics according to subject self-reported emotional states during music listening. Support Vector Machine was employed to classify four emotional states and obtained an accuracy of 82.29% across 26 subjects. Vanitha [8] has used Hilbert-Huang Transform (HHT) to remove artifacts and relevant time-frequency features from the EEG signal, and the extracted features are manipulated to detect stress levels using Support Vector Machine (SVM) Classifier on real-time stress detection.
EEG is used as a diagnostic tool by medicine. In comparison, a broader application of the EEG is to analyze a person’s mental state, thought patterns, or emotional state [9]. The EEG signal’s visual observation is real, given the very low amplitude of the EEG signal, and the pattern is very complex. In addition, EEG signals are strongly influenced by various variables, including emotional conditions, health, respondent activity, environment, electrical disturbances from other organs, and external stimuli. [10]. Conducting the introduction of the EEG signal requires a pattern of brain activity that is prominent and constant. This pattern emerged due to specific stimulation from volunteers. EEG signals are shown to provide more insight into the subject’s emotional processes and responses. The recorded EEG signals will get the waveform, the duration, the orientation of the signal, and the signal rhythm. [11, 12].
The EEG signal pattern data’s shape and position are not yet known because the signal pattern and response speed response of each individual’s brain to the received stimuli are different [13]. Therefore, we need a signal processing method EEG that can pattern specific brain activity [14].
In this study, the Fast Fourier Transform (FFT) based spectrum analysis method converts the EEG signal from the time domain to frequency domain. The FFT results were classified by K-Nearest Neighbor (KNN) as a training data set to characterize the brain wave output from the EEG as a material for analyzing differences in brain waves in each emotional state studied.
2. Data Acquisition
2.1. Neurosky Mindwave Mobile
Neurosky Mindwave Mobile is a brain-computer interface (BCI) device that can be used wirelessly and connected to several devices such as computers and smartphones via Bluetooth connection to collect input from the human brain wave activity [15].
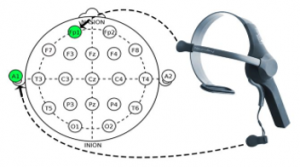
Figure 1: Neurosky Mindwave Mobile and electrode’s position
Mindwave provided single-channel EEG in the form of an electrode and placed in the forehead or Fp1 position to measure the brain’s electrical voltage and ear-clip on the left ear or A1 position as ground. With Neurosky’s ThinkGear and eSense technologies, connected devices can receive a real-time visual representation of brain waves generated from the electrodes [16, 17].
2.2. Subjects
In this study, EEG data were recorded from 50 subjects aged around 20 – 22 years old who were in healthy condition. All of the subjects were undergraduate students and were informed about the purpose of this experiment.
2.3. Stimuli
The use of appropriate stimuli is needed to get better brain wave recording results where a psychologist has validated the stimulus used for this study. Respondents were given stimuli in the form of listening to music, watching videos, and mathematical calculations to influence brain wave activity in the subject to produce an emotional condition that was following the object to be studied [18, 19].
2.4. Procedure of Data Collecting
Before starting data collection, make sure that the respondent is in good health. The data collection process is carried out in a quiet and calm place to make subjects feel comfortable and reduce disturbances affecting data collection. We use the computer laboratory at Ahmad Dahlan University for this research.
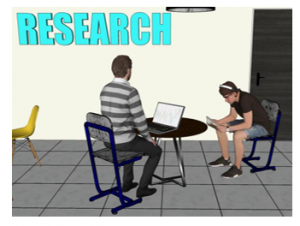
Figure 2: Illustration of the data collecting process
Data collection will be needed as much as 200 data with 50 respondents and carried out four times with a span of at least two days. The recording time for data collection is 7 minutes. When the recording begins, the respondent will be given a stimulus in instrumental music, video, and math questions [20].
3. Methods
3.1. Fast Fourier Transform (FFT)
FFT is applied in various fields,from digital signal processing and solving partial differential equations to algorithms to multiplicate integers in large numbers. FFT is an algorithm for calculating discrete Fourier transforms (DFT) quickly and efficiently. Because many signals in a communication system are continuous in the time domain, we use the Fourier transform to represent the frequency domain [21].

Figure 3: Time-domain signal and frequency domain of EEG signals
FFT is a reliable method for signal processing in the form of a sine wave as EEG signals, and it was proven in previous studies related to real-time applications because of superior speed compared to other available methods. However, it is not suitable for the analysis of short EEG signals [22]. The FFT formula is defined in (1).
![]()
where S(f) is a signal in the frequency domain, s(t) is a signal in the time domain, and is a constant value of a signal, f is frequency, and t is time.
FFT algorithm is used to reduce the complex transformations performed by DFT. For comparison, when using DFT, then the transformation complexity is N2. Meanwhile, with the FFT algorithm and faster transformation times, the complexity of the transformation is too decreased to (N) log (N).
3.2. K-nearest neighbor
- Nearest Neighbor is a method for classifying objects based on training data closest to the object. The data is then presented with a distance measure to be processed into a mathematical calculation. In this classification, the calculation is done by using Euclidean Distance. The training data with the closest distance are said to be neighbors and then sorted from the closest distance to the farthest distance. Each neighbor is different from one another or the like. Similar neighbors with the largest number among k neighbors correspond to the object being classified [23]. To find the neighbor, it uses distance metrics like euclidean distance as given in equation (2) .
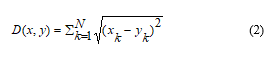
where D (x, y) is the distance between x and y facilities, xk-yk is the x and y coordinates of variable k (k = 1,3,5,… n). The value of k must be an odd number, and the number of training data is even to avoid ambiguity. This value is necessary to facilitate the achievement of classification results from the number of closest neighbors. When there is a class with the most neighbors, the test data will get that class result [24].
3.3. Hardware Design
The block diagram above shows that Neurosky Mindwave Mobile is a major component in this hardware system. Neurosky captures input from brain waves via electrodes attached to the FP1 area of the respondent’s head and sends an EEG signal via a Bluetooth connection, which acts as a communication protocol between Mindwave and PC / Laptop.

Figure 4: Hardware system diagram
3.4. Software Design
The block diagram above explains that when raw EEG data is obtained from recording brain waves using Neurosky Mindwave on respondents who have been given a stimulus. Raw data taken in the signal pre-processing stage is cut 2 seconds early to minimize noise at the beginning of the recording, due to external interference such as a Bluetooth connection between the recording device and the application, or due to the imperfect installation of the device on the respondent’s head. The next stage of feature extraction is carried out using the FFT algorithm to convert the EEG signal in the time domain into the frequency domain and extract all important frequency components from the EEG signal such as Delta waves (0.1 – 3 Hz), Theta (4 – 7 Hz.), Alfa (8 – 12 Hz), Beta (12 – 30 Hz), and Gamma (30 – 100 Hz) [25]. From the results of feature extraction, a huge amount of data is obtained, and data simplification must be done by not including data that is below the average value so that the classification results are more accurate for each emotion. Furthermore, grouping training data and test data are carried out using the KNN classification method in mathematical calculations with the Euclidean formula to calculate the closest distance to the results of the FFT feature extraction. The final step is to determine the accuracy of the KNN classification results on waves using the Confusion Matrix.

Figure 5: System design diagram
4. Result
In this research, several experimental stages were carried out. The first step is signal pre-processing to reduce noise in raw data, then feature extraction to change the form of RAW data from brain waves to the FFT spectrum. Second, monitoring the FFT results in each emotional state, followed by taking all the highest data from the FFT spectrum with a range of 0.2 Hz. Finally, KNN is used to classify emotions (normal, focused, sad, and shocked) and calculate accuracy using a confusion matrix.
4.1. Feature Extraction of Raw Data
As previously explained, FFT feature extraction with a sampling frequency of 512 Hz is used to convert the time domain signal from raw data to the frequency domain. We use MATLAB2016b software to do this process. The results of running the program can be seen in Figure 6 below.
The picture above shows the feature extraction program results, which produces two different forms of signal output with the same raw data input from subjects who have been given a stimulus in the form of listening to instrumental music. It can be seen that the signal in the time domain has data along with 2.13×10⁵ ms with the highest amplitude of 631, which is in the range of 1.32×10⁵ ms, while the signal in the frequency domain has data with a range of 0 – 50 Hz where the highest amplitude value is at a frequency of 2.26 Hz. These results will show a different value for each respondent due to different human brain wave activity against the given stimulus.
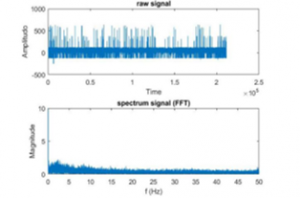
Figure 6: Feature extraction result of raw data
4.2. FFT Spectrum Comparison
In this stage, a comparison of four signal combinations resulted from FFT feature extraction that represented the subject’s emotional condition. The results of running programs are shown in Figure 7.

Figure 7: FFT spectrum of all emotional state
It can be seen that the spectrum of the FFT signal in four emotional states, namely Normal, Focus, Sad, and Shocked. When the spectrum is observed, there is a significant difference from the shape of the spectrum wherein the Focused and Normal emotional state, the difference in the form of the spectrum is very recognizable compared to the Sad and Shocked emotional states.
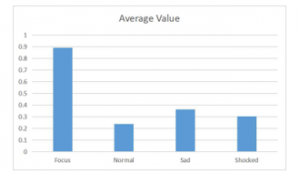
Figure 8: The average value of amplitude in the FFT spectrum
Then the amplitude value is compared to prove the truth of the observations. However, each spectrum with a frequency range of 0 – 50 Hz produces hundreds of thousands of data so that only the average value from data will be taken. Normal emotions get an average score of 0.2386, Focus 0.8904, Sad 0.3625, and Shocked 0.3044. Figure 8 shows the average value of the FFT spectrum.
From a comparison of the average values on each FFT spectrum, focus emotional state has the highest amplitude and lowest for Normal emotions, between Sad and Shocked emotions there is a small difference in the average results so that it can be proven the truth of observation result on the FFT spectrum.
4.3. Collecting Data Based on Spectrum Peaks
A reduction process is carried out at this stage at a frequency of 50 Hz to 10 Hz because the fluctuation of data values in the FFT spectrum always occurs at frequency range 0-10 Hz. Figures 9 to 12 show the results of the reduction process.
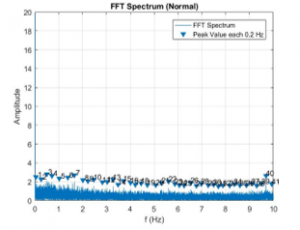
Figure 9: FFT Spectrum of Normal emotion
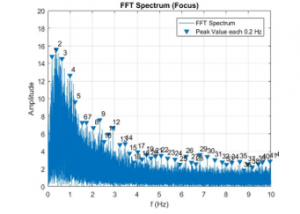
Figure 10: FFT spectrum of Focus emotion
The Values at the highest peaks of the marked frequency spectrum will be collected from the figure above. The frequency in the range 0 – 10 Hz produces 40 data by looking for the highest peak value every 0.2 Hz. Then, from 40 data, each 10 data’s average value will be sought to produce four average values used as material for the classification process. The results of the average value are shown in table 1.

Figure 11: FFT spectrum of Shocked emotion
Table 1: Frequency average value
| Focus | Normal | Sad | Shocked |
| 8.891733187 | 1.908573527 | 4.199081623 | 3.059306615 |
| 3.371044125 | 1.2510798 | 2.052021058 | 1.633249441 |
| 2.851979474 | 1.124556395 | 1.583934658 | 1.250179144 |
| 2.597699756 | 1.202698894 | 1.554512291 | 1.136366638 |
If the reduction process is not carried out in the FFT spectrum, then based on the previous discussion (4.2), it is explained that the frequency in the range 50 Hz produces hundreds of thousands of EEG data and a minimum average value, which can complicate the classification process. We get between the results of previous observations and the current calculations to get very similar results from this process. It can be proven that the results of recording brain waves with the stimulus used to produce good data quality.
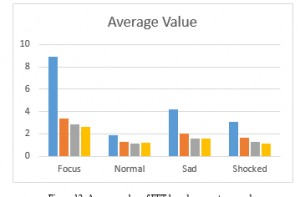
Figure 12: Average value of FFT based on spectrum peaks
4.4. KNN Classifier
In this process, 50 respondents studied and recorded brain waves four times obtained 200 data with 140 training data and 60 testing data. The KNN classification is then carried out to determine the results of the subject’s actual emotional state from the 60-testing data.
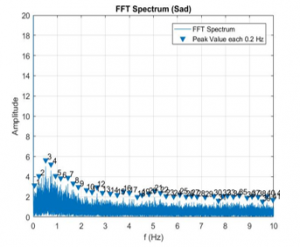
Figure 13: FFT spectrum of Sad emotion
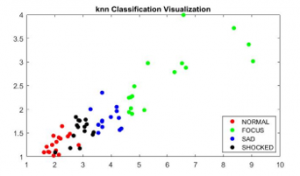
Figure 14: Visualization of KNN classification
The KNN classification results run through MATLAB2016b are displayed in a scatter chart and the coordinate points. It can be seen that each color at the coordinate point is a representation of the emotional condition of the subject, which forms a group based on the value obtained from 60 testing data. If observed, there are several color points whose coordinate values are closer to other neighboring groups. This indicates a change in the status of the color point. more clear results are shown in Table 2 below
Table 2: Result of KNN Classifier
| Match | Error | Match | Error | Match | Error | |
| k Values | 7 | 15 | 23 | |||
| Normal | 11 | 4 | 13 | 2 | 13 | 2 |
| Focus | 13 | 2 | 14 | 1 | 12 | 3 |
| Sad | 9 | 6 | 12 | 3 | 11 | 4 |
| Shocked | 12 | 3 | 11 | 4 | 12 | 3 |
| Total | 45 | 15 | 50 | 10 | 48 | 12 |
The table above shows that the KNN classification results using the k = 15 value are the best choice among k = 7 or k = 23. Sixty test data produces 50 data that corresponds to the original emotional state status, and 10 data does not match. Then perform accuracy testing using the confusion matrix as in table 3 below.
Table 3: Accuracy result using confusion matrix
| Accuracy | |||
| k Values | 7 | 15 | 23 |
| Normal | 73.33% | 86.66% | 86.66% |
| Focus | 86.66% | 93.33% | 80.00% |
| Sad | 60.00% | 80.00% | 73.33% |
| Shocked | 80.00% | 73.33% | 80.00% |
| Average | 74.99% | 83.33% | 79.99% |
From the table above, the highest average accuracy is obtained from the results of the KNN classification using a value of k = 15 with a result of 83.33%, where the accuracy value of the focused emotional state gets the highest result of 93.33%, followed by a normal emotional state of 86.66%, 80% sad emotional state, and shocked get the lowest accuracy of 73.33%. Differences in accuracy results using the right stimulus dramatically affects the accuracy obtained. Regulations about sad emotions and focus are needed to help improve the accuracy of the results obtained.
5. Conclusion
This study aims to identify human emotions towards a given stimulus by applying the FFT method as feature extraction from the raw data generated by recording brain waves using the Neurosky Minwave mobile with the KNN method using the variable k = 15 to classify the FFT spectrum. Accuracy in each emotional state studied was performed using a confusion matrix where the best accuracy was obtained for Focus emotions as much as 93.33%, followed by Normal emotions 86.66%, Sad 80%, and Shocked getting the lowest accuracy results of 73.33%. The results of the average accuracy in the classification of brain waves were 83.33%. This research found that FFT and KNN can be used as alternatives in the EEG signal analysis method.
Acknowledgment
The research is funded by Ministry of Research and Technology / National Agency for Research and Innovation Fundamental Research with contract number: 1627.9/LL5/PG/2020
- A. Yudhana, S. Mukhopadhyay, I.R. Karas, A. Azhari, M.M. Mardhia, S.A. Akbar, A. Muslim, F.I. Ammatulloh, “Recognizing Human Emotion patterns by applying Fast Fourier Transform based on Brainwave Features,” Proceedings – 1st International Conference on Informatics, Multimedia, Cyber and Information System, ICIMCIS 2019, 249–254, 2019, doi:10.1109/ICIMCIS48181.2019.8985227. This paper is an extension of work originally presented in International Conference on Informatics, Multimedia, Cyber and Information System (ICIMCIS).
- I. Jayarathne, M. Cohen, S. Amarakeerthi, “BrainID: Development of an EEG-based biometric authentication system,” 7th IEEE Annual Information Technology, Electronics and Mobile Communication Conference, IEEE IEMCON 2016, (October), 2016, doi:10.1109/IEMCON.2016.7746325.
- Z. Pang, J. Li, H. Ji, M. Li, “A new approach for EEG feature extraction for detecting error-related potentials,” 2016 Progress In Electromagnetics Research Symposium, PIERS 2016 – Proceedings, 3595–3597, 2016, doi:10.1109/PIERS.2016.7735380.
- B. Trowbridge, C. Rodriguez, J. Prine, M. Holzemer, J. McCormack, and R. Integlia, “Gaming, fitness, and relaxation,” in Games Entertainment Media Conference (GEM), 2015 IEEE, 2015, pp. 1–1.
- D. Bright, A. Nair, D. Salvekar, S. Bhisikar, “EEG-based brain controlled prosthetic arm,” Conference on Advances in Signal Processing, CASP 2016, 479–483, 2016, doi:10.1109/CASP.2016.7746219.
- A. Yudhana, Sunardi, Priyatno, “Development of Door Safety Fingerprint Verification using Neural Network,” Journal of Physics: Conference Series, 1373(1), 2019, doi:10.1088/1742-6596/1373/1/012053.
- Y.P. Lin, C.H. Wang, T.P. Jung, T.L. Wu, S.K. Jeng, J.R. Duann, J.H. Chen, “EEG-based emotion recognition in music listening,” IEEE Transactions on Biomedical Engineering, 57(7), 1798–1806, 2010, doi:10.1109/TBME.2010.2048568.
- V. Vanitha, P. Krishnan, “Real time stress detection system based on EEG signals,” Biomedical Research (India), 2016(Special Issue 2), S271–S275, 2016.
- S. Al Irfan, A. Yudhana, S.C. Mukhopadhyay, I.R. Karas, D.E. Wati, I. Puspitasari, “Wireless Communication System for Monitoring Heart Rate in the Detection and Intervention of Emotional Regulation,” Proceedings – 1st International Conference on Informatics, Multimedia, Cyber and Information System, ICIMCIS 2019, 243–248, 2019, doi:10.1109/ICIMCIS48181.2019.8985210.
- P.D. Purnamasari, P. Yustiana, A.A. Putri Ratna, D. Sudiana, “Mobile EEG Based Drowsiness Detection using K-Nearest Neighbor,” 2019 IEEE 10th International Conference on Awareness Science and Technology, ICAST 2019 – Proceedings, (June), 1–5, 2019, doi:10.1109/ICAwST.2019.8923161.
- M. Soleymani, S. Asghari-Esfeden, Y. Fu, M. Pantic, “Analysis of EEG Signals and Facial Expressions for Continuous Emotion Detection,” IEEE Transactions on Affective Computing, 7(1), 17–28, 2016, doi:10.1109/TAFFC.2015.2436926.
- V. Starcevic, D. Berle, K. Viswasam, A. Hannan, D. Milicevic, V. Brakoulias, E. Dale, “Specificity of the Relationships Between Dysphoria and Related Constructs in an Outpatient Sample,” Psychiatric Quarterly, 86(4), 459–469, 2015, doi:10.1007/s11126-015-9344-8.
- D. Nie, X.W. Wang, L.C. Shi, B.L. Lu, “EEG-based emotion recognition during watching movies,” 2011 5th International IEEE/EMBS Conference on Neural Engineering, NER 2011, 667–670, 2011, doi:10.1109/NER.2011.5910636.
- R.A. Surya, A. Fadlil, A. Yudhana, “Identification of Pekalongan Batik Images Using Backpropagation Method,” Journal of Physics: Conference Series, 1373(1), 2019, doi:10.1088/1742-6596/1373/1/012049.
- E.C. Djamal, M.Y. Abdullah, F. Renaldi, “Brain computer interface game controlling using fast fourier transform and learning vector quantization,” Journal of Telecommunication, Electronic and Computer Engineering, 9(2–5), 71–74, 2017.
- S. Sengupta, S. Biswas, S. Nag, S. Sanyal, A. Banerjee, R. Sengupta, D. Ghosh, “Emotion specification from musical stimuli: An EEG study with AFA and DFA,” 2017 4th International Conference on Signal Processing and Integrated Networks, SPIN 2017, 596–600, 2017, doi:10.1109/SPIN.2017.8050019.
- A. Azhari, L. Hernandez, “Brainwaves feature classification by applying K-means clustering using single-sensor EEG,” International Journal of Advances in Intelligent Informatics, 2(3), 167–173, 2016, doi:10.26555/ijain.v2i3.86.
- R. Das, E. Maiorana, P. Campisi, “EEG Biometrics Using Visual Stimuli: A Longitudinal Study,” IEEE Signal Processing Letters, 23(3), 341–345, 2016, doi:10.1109/LSP.2016.2516043.
- N. Masood, H. Farooq, “Investigating EEG patterns for dual-stimuli induced human fear emotional state,” Sensors (Switzerland), 19(3), 1–23, 2019, doi:10.3390/s19030522.
- E.C. Djamal, D.P. Pangestu, D.A. Dewi, “EEG-Based Recognition of Attention State Using Wavelet and Support Vector Machine,” 2016 International Seminar on Intelligent Technology and Its Applications (ISITIA), 139–144, 2016, doi: 10.1109/ISITIA.2016.7828648.
- C.S. Huang, C.L. Lin, L.W. Ko, S.Y. Liu, T.P. Su, C.T. Lin, “Knowledge-based identification of sleep stages based on two forehead electroencephalogram channels,” Frontiers in Neuroscience, 8(SEP), 1–12, 2014, doi:10.3389/fnins.2014.00263.
- R. Jaswal, “Brain Wave Classification and Feature Extraction of EEG Signal by Using FFT on Lab View,” International Research Journal of Engineering and Technology, 1208–1212, 2016.
- A.E. Putra, C. Atmaji, F. Ghaleb, “EEG-Based Emotion Classification Using Wavelet Decomposition and K-Nearest Neighbor,” Proceedings – 2018 4th International Conference on Science and Technology, ICST 2018, 1, 1–4, 2018, doi:10.1109/ICSTC.2018.8528652.
- S. Shukla, R. Chaurasiya, Emotion Analysis Through EEG and Peripheral Physiological Signals Using KNN Classifier, Proceedings of the International Conference on ISMAC in Computational Vision and Bio-Engineering 2018 (ISMAC-CVB), 2019, doi:10.1007/978-3-030-00665-11
- B. Senzio-Savino, M.R. Alsharif, C.E. Gutierrez, K. Yamashita, “Synchronous emotion pattern recognition with a virtual training environment,” Proceedings of the 2015 International Conference on Artificial Intelligence, ICAI 2015 – WORLDCOMP 2015, (July), 650–654, 2019.