Crystallinity and Hardness Enhancement of Polypropylene using Atmospheric Pressure Plasma Discharge Treatment

Adv. Sci. Technol. Eng. Syst. J. 5(6), 1250–1257 (2020);
 DOI: 10.25046/aj0506149
Atmospheric pressure plasma was used to treat polypropylene (PP) surfaces. Optical emission spectroscopy (OES) was used to determine the chemical species formed in the plasma as well as the electron temperature and density of the plasma. The flux of species (O and OH) produced during the plasma treatment interact with the polymer surface creating polar groups on the PP surface, which were evaluated by X-ray, Raman, and Attenuated total reflectance-Fourier transform infrared spectroscopy (ATR-FTIR) analyses. Moreover, the thermal properties of PP were investigated by thermogravimetric analysis (TGA) and differential scanning calorimetry (DSC) analysis. The plasma treatment increased the crystallite size and microhardness. This enhanced effect was produced from high concentrations of O and OH that induced functional polar groups containing C–O, C=O, and C=O–OH bonds appended to the PP surface. The polar groups produced by the air plasma can be attributed primarily to the oxygen radicals in the air plasma hitting the PP surface and to heat-induced oxidation rather than the incorporation of oxygen radicals or UV-induced oxidation from the plasma. The increase in hardness is attributed to the introduction of carbonyl and hydroxyl groups, cross-linking, annealing effects, and chemical etching.
1. Introduction
Atmospheric pressure plasma discharge treatment has become important because of its relatively simple process, low cost, easy operation, and applicability to vacuum-incompatible materials and processes compared with the low-pressure plasma process [1]. Typically, two categories of plasmas exist based on their gas temperatures: thermal and nonthermal (cold) plasmas [2, 3, 4]. In thermal plasmas, electron temperature is very close to those of heavy particles (both charged and neutral), and therefore, it cannot be used for the surface modification of heat-sensitive materials. However, nonthermal plasma electrons have a temperature that is 2–3 orders of magnitude higher than the temperature corresponding to the random motion of the background gas molecules. As a result of the very low heat capacity and density of electrons, plasma temperature is almost the same as room temperature. Subsequently, the ions remain rather cold, and a nonthermal plasma does not produce any thermal damage to the treated surfaces [2-4]. These characteristics are particularly advantageous for the treatment of heat-sensitive and fragile materials, such as polymers [5, 6].
Surface modification can be applied either directly or indirectly. Direct surface modification methods are used to modify an inert surface with free radicals for specific applications, whereas indirect surface modification methods are based on polymer grafting [5, 6]. The efficiency of plasma treatment methods depends on surface type, the gas phase of the plasma, and treatment conditions such as discharge type, pressure, frequency, discharge voltage and current, and treatment time. To modify surface properties without any change in the bulk material, it is essential to use successful surface modification methods such as atmospheric pressure plasma [5, 6].
Surface modification of polypropylene (PP) has been extensively studied to improve its properties, such as wettability (surface free energy), hydrophilicity, biocompatibility, and adhesion, using different atmospheric pressure plasma reactors [5, 7-11]. However, only two studies have shown PP hardness improvement: the first study [12] involved beta irradiation at several doses, showing substantial changes in PP structure and mechanical and micromechanical properties, and the second study [13] utilized atmospheric pressure plasma treatment by diffuse coplanar surface barrier discharge using ambient air as the working gas. They observed no significant changes in the mechanical properties of the films after plasma treatment. Therefore, the purpose of this study was to characterize and test the impact of the commercial plasma device on the PP surface. Therefore, optical emission spectroscopy (OES) was used to investigate chemical species that cause plasma surface modification, electron temperature (Te) and density (ne) were used to characterize the plasma, differential scanning calorimetry (DSC) was used to determine the melting points of materials, thermogravimetric analysis (TGA) was used to evaluate the degradation of materials subjected to plasma treatment, X-ray diffraction (XRD) was employed to analyze crystallite orientation and size, Raman spectroscopy and Attenuated total reflectance-Fourier transform infrared (ATR-FTIR) spectroscopy were performed to investigate the conformations of polymer chains, and atomic force microscopy (AFM) with a micro-durometer was used to study the morphology of the surfaces and determine the microhardness of PP.
2. Experimental
2.1. Plasma Source
A schematic illustration of the APC 500 plasma torch source (Diener Electronics, Germany) used for surface modification is shown in Figure 1. The plasma source [14] was operated at a voltage of 20 kV, discharge current of 25 mA, frequency of 40 kHz, and gas pressure of 1500 torr. The plasma gliding discharge was generated by two electrodes. The discharge extended from the electrode region because of air flow, and the active plasma covered an area of ~10 cm2. The samples were placed in the most homogenous region, which was at the center of the gliding plasma. OES was used for optical characterization of the plasma. For OES measurements, an Ocean Optics spectrometer (model HR2000CG-UV-NIR) was used in the spectral range 200–1100 nm, and the data were obtained with a step of 0.35 nm and an optical resolution of 1.0 nm (FWHM).
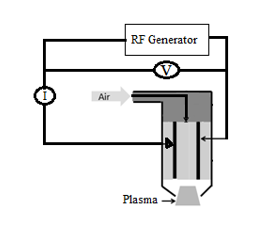
Figure 1: Diagram of the radio frequency atmospheric plasma generator
2.2. Materials
A commercially available isotactic (Lyondell Basell) PP cylinder with a density of 0.91 grams per cubic centimeter (g cc−1) was cut into 1.5 × 1.5 × 0.5 cm3 pieces. One side of each PP sample was polished to achieve uniform roughness using silicon carbide sandpaper with a grain size of 1,500. The samples were then washed in an ultrasonic bath for 20 min. To remove the residual liquid, the samples were placed in an oven at 30 °C for 30 min.
2.3. X Ray analysis
The XRD patterns of PP samples were recorded by a Rigaku D MAX-2000 diffractometer using Cu Kα (λ = 0.154 nm) radiation with 2θ in the range 10°–20° using a step size of 0.06° and step time of 10 s. The diffraction patterns of untreated and treated PP samples consisted of well-defined peaks. The high-intensity peaks were chosen to estimate the crystalline size and lattice strain using Scherrer’s formula and Williamson–Hall (W–H) model [15, 16].
2.4. Raman analysis
Raman spectra were obtained using a SENTERRA II spectrometer (Bruker). The characteristic peaks of the crystalline and amorphous phases in the spectra of treated and untreated PP samples were then evaluated. The Raman spectrometer was equipped with a 785-nm laser and was operated at a power of 100 mW. The integration time was 1,000 ms.
2.5. DSC and TGA
DSC and TGA were performed to analyze the thermal properties of the samples, which were placed in aluminum specimen holders. To correct for their thermal histories, the treated PP samples were heated from 10 °C to 250 °C at a rate of 10 °C/min in a nitrogen atmosphere.
2.6. ATR FTIR analysis
The chemical compositions of the PP surfaces were analyzed before and after plasma treatment using a Spectrum 400 ATR-FTIR spectrometer (PerkinElmer). The vibrational modes appearing in the ATR-FTIR spectra were consistent with those reported in the literature [17-20].
2.7. Roughness
A NX10 atomic force microscope (Park) was used to quantitatively analyze the surface roughness of the PP samples due to plasma treatment [21-23].
2.8. Microhardness
A micro-durometer (Matsuzawa) was used to measure PP microhardness under a 300 g load. The penetration time was set to 20 s, and five indentations were made on each PP surface to obtain an average value [12, 24].
3. Results and analysis
3.1. Plasma characterization
The efficiency of plasma treatment depends on the surface type and treatment conditions. Therefore, the plasma discharge was produced by applying a voltage (V) of 10 kV, and the electrodes were separated by a distance (d) of 2 cm. The resulting electric field strength (E) was equal to V/d. E was calculated to be 5.0 × 10³ V cm−1, and E/P was equal to 6.58 V cm−1 torr−1.
v d = μ E {\displaystyle \,v_{d}=\mu E}The electron drift velocity (vd) and E/N, where N is the number density, were obtained from the literature [25], considering the experimental conditions used. We obtained a vd of 3.2 × 106 cm s−1 and E/N of 0.19 Td (1 Td = 10−17V cm2). Thus, N is 2.63 × 1019 cm−3.
The electron density (ne) was estimated from the measured current density (J) [26]:
![]()
The electron density was found to be (1.95 ± 0.24) × 1012 cm−3, and the order of magnitude was consistent with reported values [27, 28]. The electron density, ne, was assumed to be equal to the ion density ni in the plasma bulk [29].
3.2. Optical emission spectroscopy (OES)
OES was performed to characterize the plasma discharge. The OES spectrum obtained from the discharge is shown in Figure 2. It is well known that atomic and molecular transitions emit photons with specific wavelengths and energies that correspond to the difference between the upper and lower energy levels involved in the transitions. The OH(A2Σ+ – X2Πi) molecular emission near 309 nm indicated that the plasma was not in equilibrium because of strong transitions and trace amounts of water vapor in the air. It is often difficult to prevent water from affecting the plasma. The peak at 337 nm was due to a C3Πu → B3Πg transition in N2 and was the most intense peak in the region of 330–530 nm. Moreover, the first negative system, N2+ (B2Σu+ → X2Σg+) generating a 0–0 band between 388.5 and 391.5 nm was observed together with two low-intensity peaks at 777.19 and 844.71 nm, which were attributed to O (5S0 − 5P) and O (3S0 − 3P) transitions, respectively.
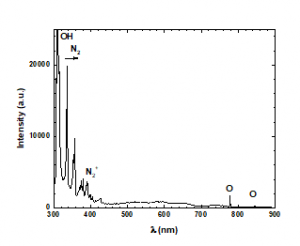
Figure 2: Optical emission spectroscopy (OES) spectrum.
OES is often used to determine the energy of electrons in the gas phase [30-33]. Thus, it can be applied to plasmas that are not in equilibrium at atmospheric pressure, which is often the case during the analysis of complex mixtures. The optical characterization of the discharge was based on the ratios of the O atomic line intensities in the emission spectrum. The electron energy was found to be (0.36 ± 0.04) eV, which was consistent with the results of previous atmospheric plasma studies [34-36]. The electron temperature (Te) can be several orders of magnitude higher than the temperature of the ions (Ti) or the neutral gas (Tg). Therefore, the heavy particles stay close to ambient temperature (270C) [29, 37, 38].
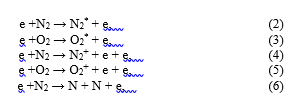
The species observed by (OES) in the plasma are formed due to electrons are accelerated by the electric field and can induce electron impact excitation, ionization and dissociation of the primary gas phase (humid-air containing 79% N2/20% O2/ 1%) reactions, these are:
The formation in OH• radicals and H species during the plasma treatment may be attributed to the fragmentation/decomposition of H2O molecules:
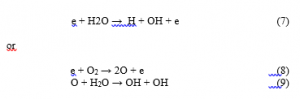
whereas the formation of atomic oxygen may be due to the dissociation of oxygen molecules by reaction (8).
3.3. X-Ray Diffraction analysis
The XRD patterns of the treated and untreated PP samples are shown in Figure 3. The peak characteristics of the α phase were observed at (2θ) 14.02° (110), 16.8° (040), and 18.44° (130), and between 20.800 and 22.400 for (111), (131), and (041). The same peaks appeared in the patterns of the treated PP samples, indicating that the plasma had no effect on the crystalline structure of PP. However, the peak intensity of the untreated sample at 16.8° differs from those of the treated samples.
The XRD patterns were used to calculate the crystallite size and orientation of planes in each sample.
The size of crystallites (D) in each PP sample based on the (110) and (040) planes was calculated using the Scherrer equation [16]:
![]()
where λ is the wavelength, β is the full width at half maximum (FWHM), and θ is the maximum angle of dispersion.
The crystallite size (D) was compared with the values obtained from the Williamson-Hall (W–H) model, where the total peak broadening is represented by the sum of the contributions from crystallite size (D) and strain (ε) in the material. Assuming that the strain present in the material is uniform and considering the isotropic nature of the crystal, the W–H equation [15, 16] is given by
![]()
The estimated values of the strain and crystallite size are given in Table 1.
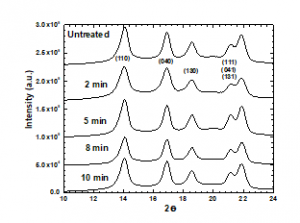
Figure 3: XRD patterns of PP samples subjected to plasma treatment for various periods.
Table 1: Geometric parameters for PP as a function of treatment duration.
| Treatment duration | Scherrer´method | Willianson-Hall method | |
| min | D (nm) | D (nm) | |
| 0 | 11.7 | 10.7 | 4.4 |
| 2 | 10.5 | 8.0 | 9.9 |
| 5 | 12.4 | 10.5 | 5.6 |
| 8 | 12.9 | 11.9 | 3.4 |
| 10 | 12.5 | 11.8 | 2.8 |
We observed that increasing the treatment duration increases the crystal size, except for 2 min of treatment, which may be due to the rearrangement of the orientation parameters of the crystal planes due to the introduction of polar groups on the PP surface by the plasma treatment. In addition, the strain at 2 min of plasma treatment increases almost 100% and then decreases as the treatment duration increases. That behavior may be attributed to dislocations that increase the volume of grain boundaries (increase in the crystal size) due to the plasma treatment and incorporation of the polar groups on the surface of PP.
To evaluate the orientation parameters of the (040) crystal plane, A110 (040), and (110) crystal plane, C040 (110), we used Zipper’s equation, which takes into account the intensities of the peaks observed [39-41]:
![]()
![]()
where I110, I111, I104, I040, I130, and I131+041 correspond to the peak intensity of the respective crystal plane.
Figure 4a shows the orientation indices of A110 (040) and C040 (110) crystal planes as a function of treatment duration. The orientation indices appear to increase as the duration of plasma treatment increases due to the surface functionalization by the plasma treatment. Changes in crystallite sizes in the (110) and (040) planes during plasma treatment are illustrated in Figure 4b. Crystallites of the samples became smaller during the first 2 min of treatment. The crystallite size increased as the duration of plasma treatment increased. It can be explained because the plasma treatment acts as a nucleating agent on the PP surface, which promotes the formation of perfect crystals [12, 39-41].
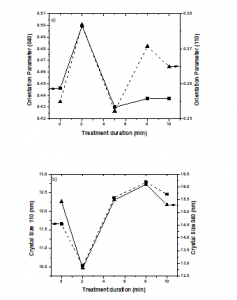
Figure 4: Crystallographic parameters of the treated PP samples. 4.a) Orientation indices of the crystal planes and 4.b) crystallite size.
3.4. Raman analysis
Raman spectra from 809 to 841 cm−1 are shown in Figure 5. The peak attributable to the crystalline phases in the PP samples was observed near 809 cm−1, and the peak near 841 cm−1 was ascribed to the phases that contained helical chains with isomeric defects [17, 25, 42, 43].
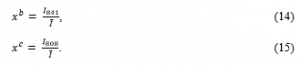
The intensities of the observed peaks (I809 and I841) were used to evaluate dispersion changes that were not related to crystallinity. The sum of the intensities (I̅ = I809 + I841) was independent of crystallinity within the range of measurement. The crystallinity of the treated PP samples was estimated using equations 14 and 15. The proportions of phases with defects and crystalline are denoted by xb and xc, respectively [40, 41]:
Variations in the proportions of phases with defects (xb) and crystalline phases (xc) in the samples are shown in Figure 6. Plasma treatment for 10 min increased the crystallinity of the PP samples, although the xc values of samples treated for 2, 5, or 8 min slightly decreased. Variations in the proportions of phases with defects indicated that phase defects were associated with crystallinity. Regular chains in the samples subjected to plasma treatment for the greatest amounts of time reorganized to generate helices and local order. The amorphous phases contained irregular atactic chains that could not be reorganized into helices because of the random orientations of their side groups. Those changes are correlated with the increase in crystallite size and orientation parameters due to the plasma treatment and the functionalization of the PP surface [12, 21, 22, 25, 39-43].
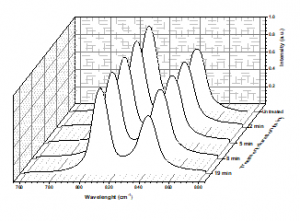
Figure 5: Raman spectra as a function of treatment duration.
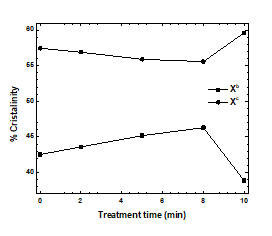
Figure 6: % crystallinity as a function of treated time.
3.5. DSC and TGA analysis
Changes in the thermal properties of the treated PP samples were Changes in the thermal properties of the treated PP samples were analyzed via DSC and TGA. Degradation is shown as a function of temperature in Figure 7. Plasma treatment did not affect mass loss under a nitrogen atmosphere because the percentages of mass lost by the untreated and treated samples did not differ. The first derivative of each mass loss curve indicated the largest change in mass. The highest rates of change in the weight loss curves of PP samples treated for 2 or 5 min occurred at 404 °C. In the weight loss curves of the untreated samples and samples treated for 8 or 10 min, the highest rates of change were observed at 416 °C (Figure 8).
Structural and compositional transformations in a polymer due to plasma treatment can be analyzed by evaluating the changes in its properties at different temperatures [39]. The DSC thermograms of the treated and untreated samples are shown in Figure 9. The untreated sample and samples treated for 8 or 10 min melted at 165 °C, whereas the samples treated for 2 or 5 min melted at 167 °C. Therefore, the melting points of the treated and untreated samples did not differ significantly [24].
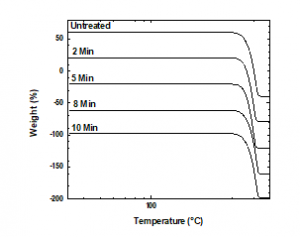
Figure 7: TGA thermograms of the treated and untreated PP samples, the curves have been shifted vertically for better comparison.
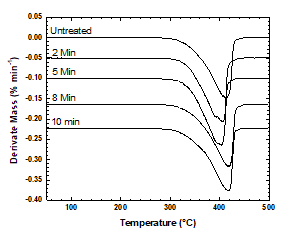
Figure 8: Weight loss curves of the treated and untreated PP samples, the curves have been shifted vertically for better comparison.
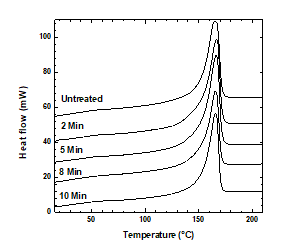
Figure 9: DSC thermograms of the treated and untreated PP samples, the curves have been shifted vertically for better comparison.
3.6. ATR-FTIR analysis
The FTIR spectra of the untreated and treated PP samples are shown in Figure 10. Chemical differences in the surface properties of the plasma-treated PP samples can be observed in Figure 10, indicating changes in their surface chemical compositions. The spectra confirmed the introduction of polar groups into all treated samples. Vibrational bands attributed to carbonyl (C=O) groups appeared from 1,500 to 1,700 cm−1 [18-21]. Moreover, the carbonyl (C=O) band was observed at 1,720 cm−1 in the spectra of the samples treated for 5 and 10 min but did not appear in the spectra of samples treated for 2 or 8 min. It means that the C content decreases, and the O content increases on the surface because of the plasma treatment. Additionally, the peak around 3400 cm−1 corresponding to the hydroxyl (–OH) group was produced by the plasma treatment. The relative intensities of all absorption peaks observed by FTIR were enhanced, indicating the increases in the carbonyl and hydroxyl groups on the surface [44]. In the present treatment, large amounts of O and OH polar groups were appended to the surface of PP because of the plasma treatment, improving the crystallinity and microhardness of PP.
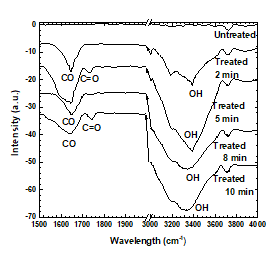
Figure 10: ATR-FTIR spectra as a function of treatment duration.
3.7. Roughness
The AFM images of the untreated and treated samples at 5 min are shown in Figures 11 and 12, respectively. The morphologies of the samples treated by plasmas were smoother than those of the untreated sample. Those figures were used to study the changes in the morphology of the PP samples, and the RMS roughness found for the untreated sample was 0.554 ± 0.064 pm, whereas for the samples treated at 2, 5, 8, and 10 min, the surface roughness values were 0.153 ± 0.031, 0.136 ± 0.013, 0.111 ± 0.024, and 0.090 ± 0.008 pm, respectively. The sample treated at 8 min shows the lowest value of RMS roughness. Those morphological variations may be due to the removal of the top few monolayers of the PP samples produced by the bombardment of plasma particles on the PP surface [13, 18], reducing the surface roughness and improving the microhardness of PP. Although their surfaces were smoothed, the ATR-FTIR spectra of the treated samples indicated that the introduction of polar groups was possible [13, 18-20, 22]
3.8. Microhardness
The microhardness values of the treated and untreated PP samples are plotted in Figure 13. The hardness values of the treated samples were higher than those of the untreated sample, and the hardness of the sample treated for 10 min increased by nearly 56%. An increase in hardness is attributed to annealing effects and chemical etching produced by the plasma treatment [45]. Also, the hardness increase may be related to either the hardening of interlamellar regions due to the polar group penetration or the hardening of the crystals themselves caused by the surface attachment of polar groups, as observed by Raman and ATR-FTIR. Plausible changes on the PP surface caused by the plasma treatment include cross-linking and oxidation. Cross-linking is due to the formation of tertiary carbon radicals. Tertiary hydrogen abstraction generates carbon radicals, which react with radicals in the nearest molecular chain. Oxidation primarily affects secondary carbon atoms. The introduction of oxygen-bearing groups, including –C–OH, –CO–OH, and –C=O moieties, occurs when the bonds between hydrogen and secondary carbon atoms on the PP surface are broken during the plasma treatment [13, 22-23].
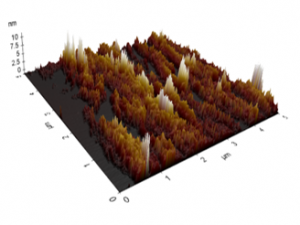
Figure 11 Roughness profiles of the untreated PP sample.
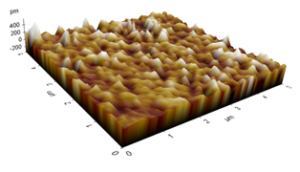
Figure 12: Roughness profiles of PP treated for 5 min.
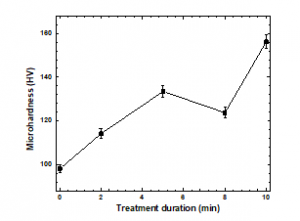
Figure 13: Microhardness values of the samples before and after plasma treatment
4. Conclusions
A commercial plasma device was used for the surface modification of PP. Using OES, we determined the chemical species formed in the plasma. High concentrations of OH and O radicals were observed in the plasma, and they led to the formation of functional polar groups, C–O, C=O, and C–O–OH bonds, on the PP surface. The plasma treatment increased the crystallinity size and microhardness. This enhanced effect is attributed to the formation of polar groups produced by the air plasma due to the oxygen radicals in the air plasma hitting the PP surface. The formation of polar groups in the PP surface was corroborated by Raman and ATR-FTIR spectroscopies. DSC and TGA indicated that plasma treatment had no effect on the thermal properties of PP. AFM analysis showed that plasma treatment for extended periods reduced the surface roughness of PP. Finally, the increase in PP hardness is attributed to the introduction of carbonyl and hydroxyl groups by the plasma treatment, cross-linking, annealing effects, and chemical etching produced by the plasma treatment.
Acknowledgment
The authors thank E. Vazquez, H. H. Hinojosa, F. Castillo, and O. Flores for their technical assistance. This work was partially supported by DGAPA project IN-105519 and CONACyT projects 225991 and 268644.
- E.E. Kunhardt, “Generation of large-volume, atmospheric-pressure, nonequilibrium plasmas”, IEEE Trans. Plasma Sci. 28, 189-200 (2000), https://doi.org/10.1109/27.842901
- P.J. Bruggeman, F. Iza and R. Brandenburg, “Foundations of atmospheric pressure nonequilibrium plasmas”, Plasma Sources Sci. Technol. 26, 123002, 2017, https://doi.org/10.1088/1361-6595/aa97af.
- A. Fridman, A. Chirokov and A. Gutsol, “Non-thermal atmospheric pressure Discharges”, J. Phys. D: Appl. Phys. 38, R1–R24, 2005, doi:10.1088/0022-3727/38/2/R01
- A. Schutze, J. Y. Jeong, S. E. Babayan, J. Park, G. S. Selwyn and R. F. Hicks, “The atmospheric-pressure plasma jet: a review and comparison to other plasma sources”, IEEE Transactions on Plasma Science, 26(6), 1685-1694, 1998, doi: 10.1109/27.747887.
- S.K. Nemani, R. K. Annavarapu, B. Mohammadian, A. Raiyan, J. Heil, Md. A. Haque, A. Abdelaal, and H. Sojoudi, “Surface Modification of Polymers: Methods and Applications”, Adv. Mater. Interfaces 5, 1801247, 2018, doi:10.1002/admi.201801247
- V. Palma, M. Cortese, S. Renda, C. Ruocco, M. Martino and E. Meloni, “A Review about the Recent Advances in Selected NonThermal Plasma Assisted Solid–Gas Phase Chemical Processes”, Nanomaterials 10, 1596, 2020, doi:10.3390/nano10081596
- M. Kehrera, A. Rottensteiner, W. Hartl, J. Duchoslav, S. Thomas, D. Stifter, “Cold atmospheric pressure plasma treatment for adhesion improvement on polypropylene surfaces”, Surface & Coatings Technology in press (2020), https://doi.org/10.1016/j.surfcoat.2020.126389
- H.B. Baniya, R. P. Guragain, B. Baniya, and D. P. Subedi, “Cold Atmospheric Pressure Plasma Jet for the Improvement of Wettability of Polypropylene”, International Journal of Polymer Science, 2020, 3860259, 2020, https://doi.org/10.1155/2020/3860259;
- R. Janík, M. Kohutiar, M. Pajtášová, A. Dubec, J. Pagáčová and J. Šulcová, “The impact of DCSBD plasma discharge on polypropylene”, IOP Conf. Series: Materials Science and Engineering 776, 012090, 2020, 10.1088/175799X/776/1/012090
- F. Darvish, N. M. Sarkari, M. Khani, E. Eslami, B. Shokri, M. Mohseni, M. Ebrahimi, M. Alizadeh, C. Fu Dee, “Direct plasma treatment approach based on non-thermal gliding arc for surface modification of biaxially-oriented polypropylene with post-exposure hydrophilicity improvement and minus aging effects”, Applied Surface Science 509, 144815, 2020, https://doi.org/10.1016/j.apsusc.2019.144815
- Y. Akishev, G. Aponin, A. Petryakov and N. Trushkin, “On the composition of reactive species in air plasma jets and their influence on the adhesion of polyurethane foam to low-pressure polyethylene”, J. Phys. D: Appl. Phys. 51 274006, 2018, https://doi.org/10.1088/1361-6463/aac5fd
- D. Manas, M. Hribova, M. Manas, M. Ovsik, M. Stanek, D. Samek, “The effect of beta irradiation on morphology and micro hardness of polypropylene thin layers”, Thin Solid Films 530, 49–52, 2013, http://dx.doi.org/10.1016/j.tsf.2012.09.051
- A. Oravcova, I. Hudec, “The Influence of Atmospheric Pressure Plasma Treatment on Surface Properties of Polypropylene Films”, Acta Chimica Slovaca, 3(2), 57 – 62, 2010, http://www.acs.chtf.stuba.sk/?id=7&paper=68
- http://plasma.de/en/plasmasystems/plasma-apc500.html, accessed on 28.9.2015
- W. Burton, O. Kenneth, R. Thomas, I.Y. Chan, “On the estimation of average crystallite size of zeolites from the Scherrer equation: A critical evaluation of its application to zeolites with one-dimensional pore systems”, Microporous Mesoporous Mater. 117, 75-90, 2009, doi:10.1016/j.micromeso.2008.06.010
- G.K. Williamson and W. H. Hall, “X-Ray line broadening from filed aluminium and wolfram”, Acta Metallurgica 1, 22-31, 1953, https://doi.org/10.1016/0001-6160(53)90006-6
- E. Andreassen and J. Karger-Kocsis, “Infrared and Raman spectroscopy of polypropylene”, in: Karger-Kocsis J. (Eds.), Polypropylene. Polymer Science and Technology Series, 2, 320-328, 1999, https://doi.org/10.1007/978-94-011-4421-6_46
- M.R. Monzó Pérez. “Investigación de la influencia del tipo de gas utilizado en el plasma atmosférico, en la modificación superficial del polipropileno” (tesis de doctorado). Universidad Politécnica de Valencia. Valencia, España, 2015.
- M.J. Shenton and G. C. Stevens. “Surface modification of polymer surfaces: atmospheric plasma versus vacuum plasma treatments”. Journal of Physics D: Applied Physics, 34, 2761-2768, 2001, doi:10.1088/0022-3727/34/18/308
- N.V. Bhat and D. J. Upadhyay, “Plasma-Induced Surface Modification and Adhesion Enhancement of Polypropylene Surface”, Journal of Applied Polymer Science, 86, 925-936, 2002. https://doi.org/10.1002/app.11024
- H.H. Šourková, G. Primc, and P. Špatenka, “Surface Functionalization of Polyethylene Granules by Treatment with Low-Pressure Air Plasma”, Journal Materials, 11, 885, 2018. 10.3390/ma11060885
- S. D. Lee, M. Sarmadi, F. Denes, and J. L. Shohet, “Surface Modification of Polypropylene Under Argon and Oxygen-RF-Plasma Conditions”, Plasmas and Polymers, 2, 177-198, 1997. https://link.springer.com/article/10.1007/BF0276613
- M. Kehrer, J. Duchoslav, A. Hinterreiter, A. Mehic, T. Stehrer, D. Stifter, “Surface functionalization of polypropylene using a cold atmospheric pressure plasma jet with gas water mixtures”, Surface and Coatings Technology, 384, 125170, 2020, https://doi.org/10.1016/j.surfcoat.2019.125170.
- A. García, M. Domínguez-Díaz, R. Paniagua, J. A. Hernández-Péreza, H. Martínez. “Microhardness modification of ultrahigh-molecular-weight polyethylene by oxygen plasma: Effect of the polymer crosslinking”. Nuclear Inst. and Methods in Physics Research B, 445, 8-12, 2019, https://doi.org/10.1016/j.nimb.2019.02.020
- Y. Hiejima, K. Takeda, and K-h Nitta, “Investigation of the Molecular Mechanisms of Melting and Crystallization of Isotactic Polypropylene by in Situ Raman Spectroscopy”, Macromolecules, 50, 5867-5876, 2017, https://doi.org/10.1021/acs.macromol.7b00229.
- J. Dutton, “A survey of electron swarm data”, Journal of Physical and Chemical Reference Data 4, 577, 1975, https://doi.org/10.1063/1.555525
- K.K. Trusov, “Dynamics of multichannel and quasi-homogeneous sliding discharge formation in rare gases”, Journal of Physics D: Applied Physics, 40(3), 786–794, 2007, doi:10.1088/0022-3727/40/3/015
- A. Yu Nikiforov, Ch Leys, M. A. Gonzalez and J. L. Walsh, “Electron density measurement in atmospheric pressure plasma jet: Stark broadening of hydrogenated and non-hydrogenated lines”, Plasma Sources Sci. Technol, 24(3), 034001, 2015, https://doi.org/10.1088/0963-0252/24/3/034001
- K. Yoshida, K. Nitta, H. Ohmi, K. Yasutake, and H. Kakiuchi, “Plasma parameters in very high frequency helium and argon plasmas at atmospheric pressure”, J. Appl. Phys. 128, 133303, 2020, https://doi.org/10.1063/5.0010195
- C. Laux, T. Spence, C. Kruger and R. Zare, “Optical diagnostics of atmospheric pressure air plasmas”, Plasma Sources Sci. Technol, 12, 125–138, 2003, https://iopscience.iop.org/article/10.1088/0963-0252/12/2/301
- S. Moon and W. Choe, “A comparative study of rotational temperatures using diatomic OH, O2 and N2+ molecular spectra emitted from atmospheric plasmas”, Spectrochim. Acta B, 58, 249–257, 2003, https://doi.org/10.1016/S0584-8547(02)00259-8
- S. Astashkevich, M. Kaning, E. Kaning, N. Kokina, B. Lavrov, A. Ohl and J. Ropcke, “Radiative characteristics of 3p Σ, Π; 3d Π−, Δ states of H2 and determination of gas temperature of low pressure hydrogen containing plasmas”, J. Quant. Spectrosc. Radiat. Transfer 56, 725–751, 1996, https://doi.org/10.1016/S0022-4073(96)00103-3
- P.J. Bruggeman, N. Sadeghi, D. C. Schram and V. Linss, “Gas temperature determination from rotational lines in non-equilibrium plasmas: a review”, Plasma Sources Science and Technology, 23(2), 023001, 2014, https://doi.org/10.1088/0963-0252/23/2/023001
- P.J. Bruggeman, F. Iza and R. Brandenburg, “Foundations of atmospheric pressure non-equlibrium plasmas, Plasma Sources Sci. Technol. 26(12), 123002, 2017, https://doi-org.biblioteca.ibt.unam.mx:8080/10.1088/1361-6595/aa97af
- H. B. Baniya, R. Shrestha, R. P. Guragain, M. B. Kshetri, B. P. Pandey, and D. P. Subedi, ” Cold Atmospheric Pressure Plasma Jet for the Improvement of Wettability of Polypropylene”, International Journal of Polymer Science, 2020, 3860259, 2020, https://doi.org/10.1155/2020/3860259
- A. Czernichowski, H. Nassar H, A. Ranaivosoloarimanana A.A. Fridman, M. Simeek, K. Musiol, E. Pawelec and L. Dittrichova, “Spectral and Electrical Diagnostics of Gliding Arc” Acta Phys. Pol. A89, 595, 1996, doi:10.12693/APhysPolA.89.595
- K. Ollegott, P. Wirth, C. Oberste-Beulmann, P. Awakowicz, and M. Muhler, “Fundamental Properties and Applications of Dielectric Barrier Discharges in Plasma-Catalytic Processes at Atmospheric Pressure”, Chem. Ing. Tech, 92(10), 1542–155, 20208, doi:10.1002/cite.202000075;
- M. Keidar, A. Shashurin, O. Volotskova, M.A. Stepp, P. Srinivasan, A. Sandler, and B. Trink, “Cold atmospheric plasma in cancer therapy”, Physics of Plasmas 20, 057101, 2013, https://doi.org/10.1063/1.4801516;
- S.H. Jafari, A. Kalati-vahid, H. A. Khonakdar, A. Asadinezhad, U. Wagenknecht, D. Jehnichen. “Crystallization and melting behavior of nanoclay-containing polypropylene/poly (trimethylene terephthalate) blends”, Express Polymer Letters, 6(2), 148–158, 2012, 10.3144/expresspolymlett.2012.16
- M.R. Abadchi, A. Jalali-Arani, “Crystallization and melting behavior of polypropylene(PP) in (vulcanized nanoscale polybutadiene rubberpowder/PP) polymer-nanocomposites”, Thermochimica Acta, 617, 120-128, 2015, https://doi.org/10.1016/j.tca.2015.08.027
- M.M. Favaro, M. C. Branciforti, R. E. S. Bretas, “A X-ray Study of β-Phase and Molecular Orientation in Nucleated and Non-Nucleated Injection Molded Polypropylene Resins”, Materials Research, 12(4), 455-464, 2009, https://doi.org/10.1590/S1516-14392009000400014
- A.S. Mielsen, D. N.Batchelder and R. Pyrz, “Estimation of crystallinity os isotactic polypropylene using Raman spectroscopy”, Polymer 43(9), 2671-2676, 2002, https://doi.org/10.1016/S0032-3861(02)00053-8
- T. Kida, Y. Hiejima, K.-H. Nitta, “Molecular orientation behavior of isotactic polypropylene under uniaxial stretching by rheo-Raman spectroscopy”, eXPRESS Polymer Letters, 10(8), 701–709, 2016, 10.3144/expresspolymlett.2016.63
- N. L. Singh, A. Qureshi, N. Shah et al., “Surface modification of polyethylene terephthalate by plasma treatment,” Radiation Measurements, vol. 40(2-6), 746–749, 2005, https://doi.org/10.1016/j.radmeas.2005.01.014
- F.J. Baltá Calleja, Microhardness relating to crystalline polymers. In: Kaush H.H., Zachman H.G. (Eds), “Characterization of Polymers” in the Solid State I: Part A: NMR and Other Spectroscopic Methods Part B: Mechanical Methods. Advances in Polymer Science, 66, 117-148, 1985, https://doi.org/10.1007/3-540-13779-3_19