A prediction of Cutting Force, System Vibration, and Productivity in Five-Axis Milling Process of the Spiral Bevel Gear
 , Nguyen Van Que, Do Duc Trung, Pham Thi Thieu Thoa
Adv. Sci. Technol. Eng. Syst. J. 5(6), 1394–1401 (2020);
 DOI: 10.25046/aj0506168
In this study, Taguchi method and ANOVA that are applied to determine the influence of several input parametrs on cutting force amplitude (F), vibration acceleration amplitude (a), and machining productivity (P) in the five-axis finish milling process of the spiral bevel gear. Taguchi orthogonal L27 array is used to design the experimental matrix with 27 experiments. During finish milling process of the spiral bevel gear (X40 steel) with a ball-end mill cutter (HSLB-2030), the parameter that has most influence on F was spindle speed (37.51 %). The parameter that has the second influence degree on F was feed rate (22.97 %). The parameter that has the third influence degree on F was maximum scallop height (16.45 %). Toolpath strategy has negligible influence on F (less than 1 %). Feed rate was the most influence factor on a (22.48 %). The parameter that has the second influence degree on a was the maximum scallop height (21.73 %). The parameter that has the third influence degree on a was the toolpath strategy (3.65 %). Spindle speed has negligible influence on a (less than 1 %). The parameter that has the most influence on the P was the maximum scallop height (54.90 %). The parameter that has the second influence degree on P was the feed rate (18.92 %). The spindle speed and toolpath strategy have negligible influence on P (less than 1 %). Quadratic regression that is determined as the most suitable regression of F, a, and P in the finish milling process of the spiral bevel gear with the determination coefficients (R2) 86.72 % for cutting force amplitude, 93.46 % for vibration acceleration amplitude, and 99.85 % for machining productivity.
1. Introduction
In machining processes, milling processes are ones of the most common machining methods. Especial, the application of CNC technology with high precision and high machinability, milling processes have been used popularly to machine the surfaces with high precision and high productivity. Therefore, more and more studies on the application of milling method have been performed. These studies were performed to improve the quality of machining quality, reduce cutting heat, reduce cutting forces, reduce vibrations, increasing the material removal rate, etc. in milling processes. In application of machines such as for thermal power generation system, marine propulsion elements, mines and quarries, wind’s kinetic energy system, automation, etc. the spiral bevel gears are the most important components of power transmission system [1, 2]
In the manufacturing of spiral bevel gears, many different methods were applied to cut the gear teeth of spiral bevel gears. In which, most of the machining of spiral bevel gears were conducted by the specialized machines. Some of machining systems for manufacturing of the spiral bevel gears consist of the Klingelnberg’s Palliod system [3], Klingelnberg’s and Oerlikon’s Cyclo Palliod systems [4], and the Gleason’s gearing [5] Several studies were conducted to machining the spiral bevel gears using five-axis CNC milling machines [6-8]
In machining processes, cutting forces, vibrations, material removal rate (MRR) are the most important factors. Cutting forces, vibrations, and MRR influence on the machining quality and machining productivity. So, many studies were performed to predict the cutting forces, vibrations, and MRR, and to determine the influence of cutting parameters on the cutting forces, vibrations, MRR. In milling processes, cutting forces can be modeled by theoretical method for ball end mill [9] or flat-end mill [10] and by experimental method [11] The vibrations also can be modeled by theoretical methods [12, 13] and experimental method [14] Normally, the MRR is calculated based on the relationship of cutting parameters such as cutting time, feed rate, cutting velocity, etc.
In the manufacturing of spiral bevel gears using five-axis milling processes, many research directions were performed to improve the quality and productivity of machining processes. Using universal multitasking machines or five-axis milling centers, a large sized spiral bevel gears were manufacture. The different machining strategies, toolpath patterns, and parameters were conducted for both roughing and finishing operations. The machining time, tool wear, and gear surface were analyzed to determine which are the best strategies and parameters for large modulus gear manufacturing on universal machines. Cutting forces, vibrations, and MRR have not been mentioned in this study [6].
A unity transformation model (UTM) was proposed to machine the spiral bevel gears and hypoid gears. This model can be applied in machining process of Gleason spiral bevel gears and hypoid gears, including generation machining and formation machining for wheel or pinion on a universal five-axis machining center. However, this study only focused on the generation of NC program. So, the machining quality and machining productivity have not been mentioned [15].
By combined with the general five-axis NC machine tool, the general expressions of trajectory for five-axis NC machining for the circle bevel gears were proposed. The results of cutter positions and states were verified by 3D modeling. And then, the final tool trajectory was applied in experimental processes. In the milling process of this kind of gear, the cutting forces, vibrations, and MRR have also not been mentioned in this study [16] Besides, several studies were performed using four or five-axis CNC machines to analysis, plan, and manufacture the bevel gears to reduce the cost and time and to improvement of the machining quality in machining processes [15-17].
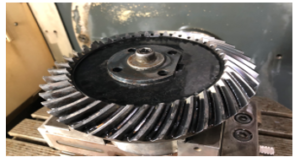
Figure 1: Spiral bevel gear before using in experimental
2. Material and Experimental Method
2.1. Material
In this study, 40X steel was used to perform the experiment. The equivalent signs of this steel are described in Table 1 according several standard. The chemical compositions of 40X steel are listed in Table 2. The properties of the 40X were the listed in Table 3. The geometry of workpiece (a gear was rough machined) is described in Figure 1.
40Х steel is a structural alloy steel intended for use in heavy-duty components. Products made from this steel conform to DSTU 7806 and GOST 4543 standards. 40X structural alloy steel is used in heavy-duty components (shafts, axles, gear shafts, plungers, bars, crank and cam shafts, rings, spindles, drift pins, battens, cogs, bolts, half-shafts, bushings, screws etc.). 40X chromic steel is also used in forged, cold- and hot-stamped components, and the steel product is used in pipe, tank and other production.
Table 1: Equivalent symbol of 40X steel of according several Standard
| 1 | US | 5135, 5140, 5140H, 5140RH, G51350, G51400, H51350, H51400 |
| 2 | Japan | SCr435, SCr435H, SCr440, SCr440H |
| 3 | EU | 37Cr4, 37Cr4KD, 41Cr4, 41Cr4KD, 41CrS4 |
| 4 | China | 35Cr, 38CrA, 40Cr, 40CrA, 40CrH, 45Cr, 45CrH, ML38CrA, ML40Cr |
| 5 | Sweden | 2245 |
| 6 | Poland | 38HA, 40H |
| 7 | Romania | 40Cr10, 40Cr10q |
| 8 | Czech Republic | 14140 |
| 9 | Australia | 5132H, 5140 |
| 10 | South Korea | SCr435, SCr435H, SCr440, SCr440H |
Table 2: Chemical composition of 40X steel
| Element | С | Si | Mn | NI | Cr | Cu | P | S | Fe |
| % | 0.36-0.44 | 0.17-0.37 | 0.5-0.8 | ≤0.3 | 0.8-1.1 | ≤0.3 | ≤0.035 | ≤0.035 | Balance |
Table 3: Properties of 40X steel
| Youngs module (GPa) | Density
(kg/m3) |
Yield stress
(GPa) |
Brinell hardness
(MPa) |
| 214 | 7820 | 78.5 | 179 |
| Specific heat capacity 50/100°C (J/kg°K) | Average CTE 20-300°C (µm/m°K) | Thermal conductivity Ambient temperature (W/m°K) | Electrical resistivity Ambient temperature (µΩm) |
| 466 | 11.9 | 46 | 0.210 – 0.285 |
2.2. Experimental Machine, Tool, and Measurement systems
A five-axis vertical machining center (DMU 50 – 5 Axis Milling) was used to perform the experiments as shown in Figure 1. A ball-end mill cutter (HSLB-2030) was used to finish milling the Spiral Bevel Gear with number of flutes of 2, helix angle of 300, rake angle of 50, and the diameter of 6 mm. In this study, the cutting forces were measured using a cutting force measurement system including a dynamometer (Kistler type 9139AA: force ranges: (-3 KN÷3 KN), a data processing box, and a PC with DynoWare software. Vibration measurement system including the acceleration sensor (type 4525-B-001), the data processing box, and the PLUSE software was used to measure the system vibration acceleration. The detail of measurement system was illustrated in Figure 2. The machining time of each gear teeth was determines based on the time machining from the control system of five-axis CNC machine. And then, the productivity was calculated by (1).

Figure 2: Experimental machine and measurement system
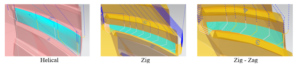
Figure 3: The toolpath strategy in five-axis milling process
![]()
where T is the finish machining time of one gear teeth.
2.3. Experimental design
In this research, four factors that were used as the input parameters were spindle speed, feed rate, tool path strategy, and maximum scallop height, and their levels were expressed in Table 4. The toolpath strategies in five-axis milling process were described in Figure 3, and the scallop height in five-axis milling process was calculated by (2), (3), and presented in Figure 4 [18] In the experimental layout plan, with four factors and three levels, the most suitable Taguchi orthogonal array (L27) was selected to design the experimental matrix as listed in Table 5.
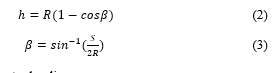
where R is the tool radius.
S is the step over (radial depth of cut).
Table 4: The factors and their levels
| Parameter | Unit | Coded sign | Levels | ||
| 1 | 2 | 3 | |||
| Spindle speed (S) | rpm | A | 5000 | 8000 | 11000 |
| Feed rate (F) | mm/min | B | 400 | 520 | 640 |
| Strategy | C | Helical | Zig | Zig – Zig | |
| Maximum Scallop Height (µm) | µm | D | 1 | 3 | 5 |
3. Experimental Results and Discussion
3.1. Evaluation of the Cutting Force
ANOVA for Cutting Force Amplitude
The experimental results were listed in Table 5. The measured results of cutting force were listed in column 10 of this Table. Analysis results of variance of cutting force were listed in Table 6 and the main effect of cutting parameters, toolpath strategy, and the maximum scallop height on F was described in Figure 5. The ANOVA results that were used to evaluate the effect of input parameters on the output parameters with 95% confidence level and 5% significance level. The analysis results in Table 6 and Fig 3 showed that: During five-axis finish milling process of the spiral bevel gear, the parameter that has most influence on F was the spindle speed (37.51 %). The parameter that has the second influence degree on F was the feed rate (22.97 %). The parameter that has the third influence degree on F was the maximum scallop height (16.45 %). The toolpath strategy has negligible influence on the F (less than 1 %).
In addition, the influence of each input parameter on F was shown in Figure 5, the results from this figure showed that the spindle speed, feed rate, and maximum scallop height were the parameters that have significant effect on F And the influence degree of toolpath strategy on the F was quite small.
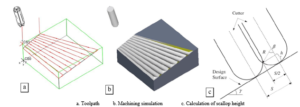
Figure 4: The calculation of scallop height in five-axis milling process
Table 5: Taguchi L27 experimental matrix and results
|
Table 6: ANOVA results for cutting force
| Source | DF | Seq SS | Contribution | Adj SS | Adj MS | F-Value | P-Value |
| Model | 13 | 105562 | 86.72% | 105562 | 8120.2 | 6.53 | 0.001 |
| Linear | 4 | 94142 | 77.34% | 80109 | 20027.2 | 16.10 | 0.000 |
| A | 1 | 45657 | 37.51% | 45657 | 45657.0 | 36.71 | 0.000 |
| B | 1 | 27956 | 22.97% | 27956 | 27955.9 | 22.48 | 0.000 |
| C | 1 | 510 | 0.42% | 138 | 137.9 | 0.11 | 0.744 |
| D | 1 | 20019 | 16.45% | 5516 | 5515.9 | 4.44 | 0.055 |
| Square | 4 | 7934 | 6.52% | 8405 | 2101.2 | 1.69 | 0.212 |
| A*A | 1 | 254 | 0.21% | 254 | 253.8 | 0.20 | 0.659 |
| B*B | 1 | 823 | 0.68% | 823 | 822.8 | 0.66 | 0.431 |
| C*C | 1 | 6422 | 5.28% | 5239 | 5239.5 | 4.21 | 0.061 |
| D*D | 1 | 435 | 0.36% | 1317 | 1317.5 | 1.06 | 0.322 |
| 2-Way Interaction | 5 | 3487 | 2.86% | 3487 | 697.4 | 0.56 | 0.728 |
| A*B | 1 | 838 | 0.69% | 838 | 837.8 | 0.67 | 0.427 |
| A*C | 1 | 98 | 0.08% | 98 | 97.9 | 0.08 | 0.783 |
| A*D | 1 | 442 | 0.36% | 442 | 441.5 | 0.36 | 0.561 |
| B*C | 1 | 2074 | 1.70% | 1329 | 1329.1 | 1.07 | 0.320 |
| B*D | 1 | 36 | 0.03% | 36 | 35.6 | 0.03 | 0.868 |
| Error | 13 | 16166 | 13.28% | 16166 | 1243.6 | ||
| Total | 26 | 121729 | 100.00% |
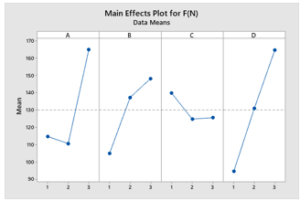
Figure 5: Main Effects Plot for Cutting Force
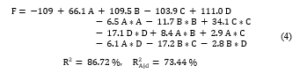
3.2. Regression of Cutting Force Amplitude Model
The measured data were used to model the cutting force amplitude. The regression model of cutting force amplitude is described by (4). The analysis results showed that the most suitable regression model for cutting force amplitude was a quadratic polynomial function of the spindle speed, feed rate, tool path strategy, and maximum scallop height. The regression model of cutting force amplitude was analyzed and built with high determination coefficients R2 (86.72 %).
Cutting Force Regression Equation in coded variables
3.3. Verification of Cutting Force Amplitude Model
The cutting force amplitude model was successfully verified by comparison of predicted and measured results of cutting force amplitude as described in Figure 6. The compared results from this figure showed that the predicted cutting force amplitude was quite close to the measured cutting force amplitude. It can be concluded that the quadratic regression model can be used to model the cutting force amplitude in in the finish milling process of the spiral bevel gear. The average difference between predicted and measured of cutting force amplitude is about 11.863 %.
3.4. Evaluation of the Vibration Acceleration
- ANOVA for Vibration Acceleration Amplitude
The measured results of cutting force were listed in column 11 of Table 5. Analysis results of variance of vibration acceleration were listed in Table 7 and the main effect of cutting parameters, toolpath strategy, and the maximum scallop height on the vibration acceleration was described in Figure 7. In five-axis finish milling process of the spiral bevel gear, the parameter that has most influence on the vibration acceleration was the feed rate (22.48 %). The parameter that has the second influence degree on the vibration acceleration was the maximum scallop height (21.73 %). The parameter that has the third influence degree on the vibration acceleration was the toolpath strategy (3.65 %). The spindle speed has negligible influence on the vibration acceleration (less than 1 %).
In addition, the influence of each input parameter on vibration acceleration was shown in Figure 7, the results from this figure showed that the feed rate and maximum scallop height were the parameters that have significant effect on the vibration acceleration. And the influences degree of spindle speed and toolpath strategy on the vibration acceleration were quite small.
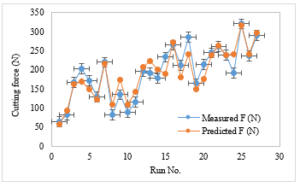
Figure 6: Comparison of predicted and measured cutting force
Table 7: ANOVA results for vibration acceleration
| Source | DF | Seq SS | Contribution | Adj SS | Adj MS | F-Value | P-Value |
| Model | 13 | 80.5415 | 93.46% | 80.5415 | 6.1955 | 14.29 | 0.000 |
| Linear | 4 | 41.4468 | 48.09% | 30.5043 | 7.6261 | 17.59 | 0.000 |
| A | 1 | 0.2023 | 0.23% | 0.2023 | 0.2023 | 0.47 | 0.507 |
| B | 1 | 19.3716 | 22.48% | 19.3716 | 19.3716 | 44.67 | 0.000 |
| C | 1 | 3.1463 | 3.65% | 2.0195 | 2.0195 | 4.66 | 0.050 |
| D | 1 | 18.7266 | 21.73% | 6.4265 | 6.4265 | 14.82 | 0.002 |
| Square | 4 | 36.0108 | 41.79% | 35.3239 | 8.8310 | 20.36 | 0.000 |
| A*A | 1 | 28.4142 | 32.97% | 28.4142 | 28.4142 | 65.52 | 0.000 |
| B*B | 1 | 0.0000 | 0.00% | 0.0000 | 0.0000 | 0.00 | 0.992 |
| C*C | 1 | 6.2205 | 7.22% | 4.1697 | 4.1697 | 9.62 | 0.008 |
| D*D | 1 | 1.3761 | 1.60% | 1.9240 | 1.9240 | 4.44 | 0.055 |
| 2-Way Interaction | 5 | 3.0839 | 3.58% | 3.0839 | 0.6168 | 1.42 | 0.280 |
| A*B | 1 | 1.1963 | 1.39% | 1.1963 | 1.1963 | 2.76 | 0.121 |
| A*C | 1 | 0.9248 | 1.07% | 0.9248 | 0.9248 | 2.13 | 0.168 |
| A*D | 1 | 0.3875 | 0.45% | 0.3875 | 0.3875 | 0.89 | 0.362 |
| B*C | 1 | 0.5197 | 0.60% | 0.5510 | 0.5510 | 1.27 | 0.280 |
| B*D | 1 | 0.0557 | 0.06% | 0.0557 | 0.0557 | 0.13 | 0.726 |
| Error | 13 | 5.6373 | 6.54% | 5.6373 | 0.4336 | ||
| Total | 26 | 86.1788 | 100.00% |
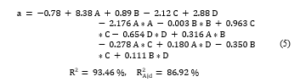
3.5. Regression of Vibration Acceleration Amplitude Model
The measured data of vibration acceleration were used to model the vibration acceleration amplitude. The regression model of vibration acceleration amplitude is described by (5). The analysis results showed that the most suitable regression model for vibration acceleration amplitude was also a quadratic polynomial function of the spindle speed, feed rate, tool path strategy, and maximum scallop height. The regression model of vibration acceleration amplitude was analyzed and built with high determination coefficients R2 (93.46 %).
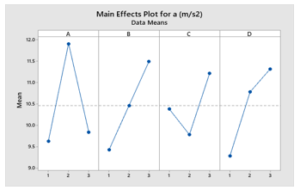
Figure 7: Main Effects Plot for vibration acceleration (a)
Vibration Acceleration Regression Equation in coded variables
3.6. Verification of Vibration Acceleration Amplitude Model
The vibration acceleration amplitude model was also successfully verified by comparison of predicted and measured results of vibration acceleration amplitude as described in Figure 8. The compared results from this figure showed that the predicted vibration acceleration amplitude was quite close to the that one of measured value. It can be also concluded that the quadratic regression model can be used to model the vibration acceleration amplitude in in the finish milling process of the spiral bevel gear. The average difference between predicted and measured of vibration acceleration amplitude is about 3.371 %.
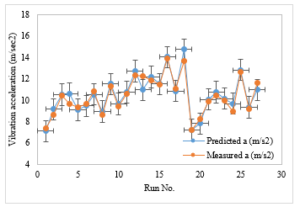
Figure 8: Comparison of predicted and measured vibration acceleration
3.7. Evaluation of the Machining Productivity
- ANOVA for Machining Productivity
The measured results of cutting force were listed in column 12 of Table 5. Analysis results of variance of machining productivity were listed in Table 8 and the main effect of cutting parameters, toolpath strategy, and the maximum scallop height on the machining productivity was described in Figure 9. In five-axis finish milling process of the spiral bevel gear, the parameter that has the most influence on the machining productivity was the maximum scallop height (54.90 %). The parameter that has the second influence degree on the machining productivity was the feed rate (18.92 %). The spindle speed and toolpath strategy have negligible influence on machining productivity (less than 1 %). The influence of each input parameter on the machining productivity was shown in Figure 9, the results from this figure showed that the feed rate and maximum scallop height were the parameters that have significant effect on the machining productivity. And the influence degree of spindle speed and toolpath strategy on the machining productivity were quite small.
Table 8: ANOVA results for productivity
| Source | DF | Seq SS | Contribution | Adj SS | Adj MS | F-Value | P-Value |
| Model | 13 | 0.895721 | 98.85% | 0.895721 | 0.068902 | 85.97 | 0.000 |
| Linear | 4 | 0.672323 | 74.20% | 0.483583 | 0.120896 | 150.84 | 0.000 |
| A | 1 | 0.000957 | 0.11% | 0.000957 | 0.000957 | 1.19 | 0.294 |
| B | 1 | 0.171417 | 18.92% | 0.171417 | 0.171417 | 213.88 | 0.000 |
| C | 1 | 0.002461 | 0.27% | 0.002616 | 0.002616 | 3.26 | 0.094 |
| D | 1 | 0.497488 | 54.90% | 0.275714 | 0.275714 | 344.01 | 0.000 |
| Square | 4 | 0.215948 | 23.83% | 0.163925 | 0.040981 | 51.13 | 0.000 |
| A*A | 1 | 0.000251 | 0.03% | 0.000251 | 0.000251 | 0.31 | 0.586 |
| B*B | 1 | 0.006666 | 0.74% | 0.006666 | 0.006666 | 8.32 | 0.013 |
| C*C | 1 | 0.182564 | 20.15% | 0.128643 | 0.128643 | 160.51 | 0.000 |
| D*D | 1 | 0.026468 | 2.92% | 0.014949 | 0.014949 | 18.65 | 0.001 |
| 2-Way Interaction | 5 | 0.007450 | 0.82% | 0.007450 | 0.001490 | 1.86 | 0.170 |
| A*B | 1 | 0.001143 | 0.13% | 0.001143 | 0.001143 | 1.43 | 0.254 |
| A*C | 1 | 0.001458 | 0.16% | 0.001458 | 0.001458 | 1.82 | 0.200 |
| A*D | 1 | 0.001182 | 0.13% | 0.001182 | 0.001182 | 1.47 | 0.246 |
| B*C | 1 | 0.003151 | 0.35% | 0.001388 | 0.001388 | 1.73 | 0.211 |
| B*D | 1 | 0.000516 | 0.06% | 0.000516 | 0.000516 | 0.64 | 0.437 |
| Error | 13 | 0.010419 | 1.15% | 0.010419 | 0.000801 | ||
| Total | 26 | 0.906140 | 100.00% |
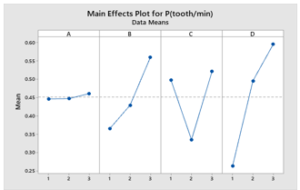
Figure 9: Main Effects Plot for productivity (P)
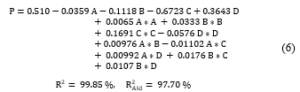
3.8. Regression of Machining Productivity Model
The measured data of machining productivity were used to model the machining productivity. The regression model of machining productivity is described by (6). The analysis results showed that the most suitable regression model for the machining productivity was also a quadratic polynomial function of the spindle speed, feed rate, tool path strategy, and maximum scallop height. The regression model of machining productivity was analyzed and built with very high determination coefficients R2 (99.85 %).
Productivity Regression Equation in coded variables
3.9. Verification of Machining Productivity Model
The machining productivity model was also successfully verified by comparison of predicted and measured results of machining productivity as described in Figure 10. The compared results from this figure showed that the predicted machining productivity was quite close to the that one of measured value. It can be also concluded that the quadratic regression model can be used to model the machining productivity in in the finish milling process of the spiral bevel gear. The average difference between predicted and measured of machining productivity is about 2.867 %.
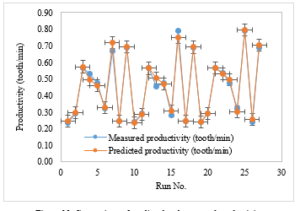
Figure 10: Comparison of predicted and measured productivity
4. Conclusion
In this study, the Taguchi method and ANOVA that were successfully applied to determine the influence of the spindle speed, feed rate, tool path strategy, and maximum scallop height on cutting forces, vibrations, productivity in the finish milling process of the spiral bevel gear. From the achieved results, the conclusions of this study were drawn as follows:
During the finish milling process of the spiral bevel gear with a ball-end mill cutter (HSLB-2030), the parameter that has most influence on the cutting force amplitude was the spindle speed (37.51 %). The parameter that has the second influence degree on the cutting force amplitude was the feed rate (22.97 %). The parameter that has the third influence degree on the cutting force was the maximum scallop height (16.45 %). The toolpath strategy has negligible influence on the cutting force (less than 1 %)
The feed rate was the most influence factor on the vibration acceleration (22.48 %). The parameter that has the second influence degree on the vibration acceleration was the maximum scallop height (21.73 %). The parameter that has the third influence degree on the vibration acceleration was the toolpath strategy (3.65 %). The spindle speed has negligible influence on the vibration acceleration (less than 1 %).
The parameter that has the most influence on the machining productivity was the maximum scallop height (54.90 %). The parameter that has the second influence degree on the machining productivity was the feed rate (18.92 %). The spindle speed and toolpath strategy have negligible influence on machining productivity (less than 1 %).
Quadratic regression that was determined as the most suitable regression of cutting force amplitude and vibration acceleration amplitude, and productivity in the finish milling process of the spiral bevel gear with the determination coefficients (R2) 86.72 % for cutting force amplitude, 93.46 % for vibration acceleration amplitude, and 99.85 % for machining productivity. These regression models were successfully verified by comparison of predicted and experimental results of cutting force amplitude and vibration acceleration amplitude, and productivity.
Taguchi method, ANOVA, and these regression models in this study can be applied to improve the quality of the machining process by reducing the cutting force components, vibration components, and improve the productivity of machining process. There are the research directions in the next issues of this study.
Conflict of Interest
The authors declare no conflict of interest.
Acknowledgment
The authors thank for the support of Hanoi University of Industry (HaUI) during the implementation of this study.
- G. Xu, D. Hua, W. Dai, and X. Zhang, “Design and performance analysis of a coal bed gas drainage machine based on incomplete non-circular gears,” Energies, 10(12), 1933, 2017, doi: https://doi.org/10.3390/en10121933.
- Z. Qin, Y. Luo, K. Li, H. Peng, “Optimal design of a novel hybrid Electric powertrain for tracked vehicles,” Energies, 10(12), 2141, 2017, doi:https://doi.org/10.3390/en10122141.
- H. J. Watson, Modern gear production, Elsevier, 2013.
- G. Lechner, Klingelnberg spiral bevel gears, W. Krumme Springer, Berlin, 1968.
- H. J. Stadtfeld, Gleason Bevel Gear Technology: The Science of Gear Engineering and Modern Manufacturing Methods for Angular Transmissions, Gleason Works, 2014.
- Á. Álvarez, A. Calleja, N. Ortega, L. N. De Lacalle, “Five-axis milling of large spiral bevel gears: toolpath definition, finishing, and shape errors,” Metals, 8(5), 353, 2018, doi:https://doi.org/10.3390/met8050353.
- T. Xiang , J. Yi, W. Li, “Five-Axis Numerical Control Machining of the Tooth Flank of a Logarithmic Spiral Bevel Gear Pinion,” Transactions of FAMENA, 42(1), 73-84, 2018, doi: https://doi.org/10.21278/TOF.42107.
- I. Tsiafis, P. Mamouri, S. Kompogiannis, “Design and manufacturing of spiral bevel gears using CNC milling machines,” InIOP Conference Series: Materials Science and Engineering, 393(1), 0120662018, 2018.
- Y. C. Kao, N. T. Nguyen, M. S. Chen, S. C. Huang, “A combination method of the theory and experiment in determination of cutting force coefficients in ball-end mill processes,” Journal of Computational Design and Engineering, 2(4), 233-47, 2015, doi:https://doi.org/10.1016/j.jcde.2015.06.005.
- Y. C. Kao, N. T. Nguyen, M. S. Chen, S. T. Su, “A prediction method of cutting force coefficients with helix angle of flat-end cutter and its application in a virtual three-axis milling simulation system,” The International Journal of Advanced Manufacturing Technology, 77(9-12), 1793-809, 2015, doi: https://doi.org/10.1007/s00170-014-6550-8.
- T. D. Hoang, N. T. Nguyen, D. Q. Tran, V. T. Nguyen, “Cutting Forces and Surface Roughness in Face-Milling of SKD61 Hard Steel,” Strojniski Vestnik/Journal of Mechanical Engineering, 65(6), 375-385, 2019, doi: https://doi.org/10.5545/sv-jme.2019.6057.
- N. T. Nguyen, Y. C. Kao, H. T. Dung, “A Prediction Method of Dynamic Cutting Forces and Machine-Tool Vibrations When Milling by Using Ball-End Mill Cutter,” In International Conference on Engineering Research and Applications, 47-54. Springer, Cham, 2019, doi:https://doi.org/10.1007/978-3-030-37497-6_5.
- K. Weinert, P. Kersting, T. Surmann, D. Biermann, “Modeling regenerative workpiece vibrations in five-axis milling,” Production Engineering, 2(3), 255, 2008, doi:https://doi.org/10.1007/s11740-008-0113-5.
- P. S. Sivasakthivel, V. Velmurugan, R. Sudhakaran, “Prediction of vibration amplitude from machining parameters by response surface methodology in end milling,” The International Journal of Advanced Manufacturing Technology, 53(5-8), 453-61, 2011, doi:https://doi.org/10.1007/s00170-010-2872-3.
- T. Wang, Y. Xing, L. Zhao, Q. Li, “NC machining of spiral bevel gear and hypoid gear based on unity transformation model,” Transactions of Tianjin University, 17(4), 264-9, 2011, doi:https://doi.org/10.1007/s12209-011-1641-1.
- B. Wang, M. Fan, X. Sun, J. Li, A. Xu, G. Li, J. Yang, “Cutter position calculation of machining equal base circle bevel gears with a pot-shaped milling cutter,” The International Journal of Advanced Manufacturing Technology, 87(9-12), 2625-37, 2016, doi:https://doi.org/10.1007/s00170-016-8657-6.
- J. Tang, X. Yang, “Research on manufacturing method of planing for spur face-gear with 4-axis CNC planer,” The International Journal of Advanced Manufacturing Technology, 82(5-8), 847-858, 2016, doi:https://doi.org/10.1007/s00170-015-7417-3.
- K. H, Product manufacturing and cost estimating using CAD/CAE: the computer-aided engineering design series, Academic Press, 2013.