Sentiment Analysis in English Texts

Adv. Sci. Technol. Eng. Syst. J. 5(6), 1683–1689 (2020);
 DOI: 10.25046/aj0506200
The growing popularity of social media sites has generated a massive amount of data that attracted researchers, decision-makers, and companies to investigate people’s opinions and thoughts in various fields. Sentiment analysis is considered an emerging topic recently. Decision-makers, companies, and service providers as well-considered sentiment analysis as a valuable tool for improvement. This research paper aims to obtain a dataset of tweets and apply different machine learning algorithms to analyze and classify texts. This research paper explored text classification accuracy while using different classifiers for classifying balanced and unbalanced datasets. It was found that the performance of different classifiers varied depending on the size of the dataset. The results also revealed that the Naive Byes and ID3 gave a better accuracy level than other classifiers, and the performance was better with the balanced datasets. The different classifiers (K-NN, Decision Tree, Random Forest, and Random Tree) gave a better performance with the unbalanced datasets.
1. Introduction
The recent widening expansion of social media has changed communication, sharing, and obtaining information [1–4]. In addition to this, many companies use social media to evaluate their business performance by analysing the conversations’ contents [5]. This includes collecting customers’ opinions about services, facilities, and products. Exploring this data plays a vital role in consumer retention by improving the quality of services [6,7]. Social media sites such as Instagram, Facebook, and Twitter offer valuable data that can be used by business owners not only to track and analyse customers’ opinions about their businesses but also that of their competitors [8–11]. Moreover, these valuable data attracted decision-makers who seek to improve the services provided [8,9,12].
In this research paper, several research papers that studied Twitter’s data classification and analysis for different purposes were surveyed to investigate the methodologies and approaches utilized for text classification. The authors of this research paper aim to obtain open-source datasets then conduct text classification experiments using machine learning approaches by applying different classification algorithms, i.e., classifiers. The authors utilized several classifiers to classify texts of two versions of datasets. The first version is unbalanced datasets, and the second is balanced datasets. The authors then compared the classification accuracy for each used classifier on classifying texts of both datasets.
2. Literature Review
As social media websites have attracted millions of users, these websites store a massive number of texts generated by users of these websites [13–20]. Researchers were interested in investigating these metadata for search purposes [16,17,21–24]. In this section, a number of research papers that explored the analysis and classification of Twitter metadata were surveyed to investigate different text classification approaches [25] and the text classification results.
Researchers of [26] investigated the user’s gender of Twitter. Authors noticed that many Twitter users use the URL section of the profile to point to their blogs, and the blogs provided valuable demographic information about the users. Using this method, the authors created a corpus of about 184000 Twitter users labeled with their gender. Then authors arranged the dataset for experiments as following: for each user; they specify four fields; the first field contains the text of the tweets and the remaining three fields from the user’s profile on Twitter, i.e., full name, screen name, and description. After that, the authors conducted the experiments and found that using all of the dataset fields while classifying Twitter user’s gender provides the best accuracy of 92%. Using tweets text only for classifying Twitter user’s gender provides an accuracy of 76%. In [27], the authors used Machine Learning approaches for Sentiment Analysis. Authors constructed a dataset consisting of more than 151000 Arabic tweets labeled as “75,774 positive tweets and 75,774 negative tweets”. Several Machine Learning Algorithms were applied, such as Naive Bayes (NB), AdaBoost, Support vector machine (SVM), ME, and Round Robin (RR). The authors found that RR provided the most accurate results on classifying texts, while AdaBoost classifier results were the least accurate results. A study by [28] interested as well in Sentiment Analysis of Arabic texts. The authors constructed the Arabic Sentiment Tweets Dataset ASTD, which consists of 84,000 Arabic tweets. The number of tweets remaining after annotation was around 10,000 tweets. The authors applied machine learning approaches using classifiers on the collected dataset. They reported the following: (1) The best classifier applied on the dataset is SVM, (2) Classifying a balanced set is challenging compared to the unbalanced set. The balanced set has fewer tweets than the unbalanced set, which may negatively affect the classification’s reliability. In [29], the author investigated the effects of applying preprocessing methods before the sentiment classification of the text. The authors used classifiers and five datasets to evaluate the preprocessing method’s effects on the classification. Experiments were conducted, and researchers reported the following findings: Removing URL has no much effect, Removing stop words have a slight effect, Removing Numbers have no effect, Expanding Acronym improved the classification performance, and the same preprocessing methods have the same effects on the classifier’s performance, NB and RF classifiers showed more sensitivity than LR and SVM classifiers. In conclusion, the classifier’s performance for sentiment analysis was improved after applying preprocessing methods. A study by [30] investigated Twitter geotagged data to construct a national database of people’s health behavior. The authors compared indicators generated by machine learning algorithms to indicators generated by a human. The authors collected around 80 million geotagged tweets. Then Spatial Join procedures were applied, and 99.8% of tweets were successfully linked. Then tweets were processed. After that, machine learning approaches were used and successfully applied in classifying tweets into happy and not happy with high accuracy. In [31] explored classifying sentiments in movie reviews. The authors constructed a dataset of 21,000 tweets of movie reviews. Dataset split into train set and test set. Preprocessing methods applied, then two classifiers, i.e., NB and SVM, were used to classify tweets text into positive or negative sentiment. The authors found that better accuracy achieved using SVM of 75% while NB has 65% accuracy. Researchers of [32] used Machine Learning methods and Semantic Analysis for analyzing tweet’s sentiments. Authors labeled tweets in a dataset that consists of 19340 sentences into positive or negative. They applied preprocessing methods after that features were extracted; authors applied Machine Learning approaches, i.e., Naïve Bayes, Maximum Entropy, and Support Vector Machine (SVM) classifiers after that Semantic Analysis were applied. The authors found that Naïve Bayes provided the best accuracy of 88.2, the next SVM of 85.5, and the last is Maximum entropy of 83.8. The authors reported as well that after applying Semantic Analysis, the accuracy increased to reach 89.9. In [33], the authors analyzed sentiments by utilizing games. Authors introduced TSentiment, which is a web-based game. TSentiment used for emotion identification in Italian tweets. TSentiment is an online game in which the users compete to classify tweets in the dataset consists of 59,446 tweets. Users first must evaluate the tweet’s polarity, i.e., positive, negative, and neutral, then users have to select the tweet’s sentiment from a pre-defined list of 9 sentiments in which 3 sentiments identified for the positive polarity, 3 sentiments identified for negative polarity. Neutral polarity is used for tweets that have no sentiment expressions. This approach for classifying tweets was effective.
A study by [34] examined the possibility of enhancing the accuracy of predictions of stock market indicators using Twitter data sentiment analysis. The authors used a lexicon-based approach to determine eight specific emotions in over 755 million tweets. The authors applied algorithms to predict DJIA and S&P500 indicators using Support Vectors Machine (SVM) and Neural Networks (NN). Using the SVM algorithm in DJIA indication, the best average precision rate of 64.10 percent was achieved. The authors indicated that the accuracy could be increased by increasing the straining period and by improving the algorithms for sentiment analysis. authors conclude that adding Twitter details does not improve accuracy significantly. In [35], the authors applied sentiment analysis on around 4,432 tweets to collect opinions on Oman tourism, they build a domain-specific ontology for Oman tourism using Concept Net. Researchers constructed a sentiment lexicon based on three existing lexicons, SentiStrength, SentWordNet, and Opinion lexicon. The authors randomly divide 80% of the data for the training set and 20% for testing. The researcher used two types of semantic sentiment, Contextual Semantic Sentiment Analysis, and Conceptual Semantic Sentiment Analysis. Authors applied Naïve Base supervised machine learning classifier and found that using conceptual semantic sentiment analysis expressively improves the sentiment analysis’s performance. A study by [36] used sentiment analysis and subjectivity analysis methods to analyze French tweets and predict the French CAC40 stock market. The author used a French dataset that consists of 1000 positive and negative book reviews. The author trained the neural network by using three input features on 3/4 of the data, and he tested on the remaining quarter. The achieved accuracy 80% and a mean absolute percentage error (MAPE) of 2.97%, which is less than the work reported by Johan Bollen. The author suggested adding more features as input to improve the performance. In [37], the authors examined the relationship between Twitter’s social emotion and the stock market. Researchers collected millions of tweets by Twitter API. Researchers retrieved the NASDAQ market closing price in the same period. The authors applied the correlation coefficient. Authors conclude that emotion-related terms have some degree of influence on the stock market overall trend, but it did not meet standards that can be used as a guide to stock-market prediction. While at the same time, there was a fairly close association between positive, negative, and angry mood-words. Particularly sad language tends to have a far greater influence on the stock market than other groups. In [38], the authors investigated telecommunications companies’ conversation on social media Twitter (‘indihome,’ in Indonesia ). The authors collected 10,839 raw data for segmentation. The authors collected data: over 5 periods of time in the same year. Authors found that most of the tweets (7,253) do not contain customers’ perception toward Indihome. Only 3,586 tweets are containing the perception of customers toward Indihome. Most of the data contained perception reveal that the customers have the negative perception (3,119) on Indihome and only 467 tweets contain positive perceptions; the biggest number of negative perceptions relate to the first product, the second relates to a process, third relate to people, and fourth relate to pricing. Researchers of [39] examined prevalence and geographic variations for opinion polarities about e-cigarettes on Twitter. Researchers collected data from Twitter by pre-defined seven keywords. They classified the tweets into four categories: Irrelevant to e-cigarettes, Commercial tweets, organic tweets with attitudes (supporting or against or neutral) the use of e-cigarettes, and the geographic locations information city and state. Researchers selected six socio-economic variables from Census data 2014 that are associated with smoking and health disparities. Researchers classified the tweets based on a combination of human judgment and machine-learning algorithms, and two coders classified a random sample of 2000 tweets into five categories. The researcher applied a multilabel Naïve Bayes classifier algorithm; the model achieved an accuracy of 93.6% on the training data. Then the researcher applied the machine learning algorithm to a full set of collected tweets and found the accuracy of the validation data was 83.4%. To evaluate the socio-economic impact related to public perception regarding e-cigarette use in the USA, researchers calculated the Pearson correlation between prevalence and percentage of opinion polarities and selected ACS variants for 50 states and the District of Columbia. In [40], the authors Investigated the link between any updates on certain brands and their reaction. Researchers gathered geographic locations based on the data to see consumer distribution. Researchers collected Twitter data by using the REST API. In total, 3,200, from ten different profiles, then used sentiment analysis to differentiate between clustered data expressed positively or negatively then resampled the result in an object model and cluster. For every answer, the researcher has been evaluated for the textual sentiment analysis from the object model. Researchers used AFINN based word list and Sentiments of Emojis to run comprehensive sentiment analysis; for the data that not existed in the word list, researcher added a separated layer to an analysis by using emoji analysis on top of sentiment analysis, and authors did not see any difference in the level of accuracy when applying this extra layer. The researcher found some Sentiment Analysis weaknesses related to the misuse of emoji, the use of abbreviated words or terms of slang, and the use of sarcasm. In [41], the authors proposed an application that can classify a Twitter content into spam or legitimate. Auhtors used an integrated approach, from URL analysis, Natural Language Processing, and Machine Learning techniques. Auhtors analyzed the URL that derived from the tweets, then convert URLs to their long-form, then compare URLs with Blacklisted URLs, then compare them with a set pre-defined expressions list as spam; the presence of any of these expressions can conclude that the URL is spam. After cleaning data, the stemmed keywords are compared with the per set of identified spam words and, if a pre-defined expressions list are found in the tweet, then the user is classified as spam. Six features were used for classification. The training set has 100 instances with six features and a label. The author used Naïve-Bayes algorithm. Authors manually examined 100 users and found (60 were legitimate and 40 were spam) then the sampled checked by the application and the result presented that 98 were classified correctly.
3. Proposed Approach
In this work, the authors implemented and evaluated different classifiers in classifying the sentiment of the tweets. It’s by utilizing RapidMiner software. Classifiers were applied on both balanced and unbalanced datasets. Classifiers used are Decision Tree, Naïve Bayes, Random Forest, K-NN, ID3, and Random Tree.
4. Experiment Setup
In this section, the dataset is described as well as the settings and evaluation techniques are used in the experiments have been discussed. The prediction for the tweet category is tested twice—the first time on an unbalanced data set and the second time on a balanced dataset as below.
- Experiments on the unbalanced dataset: Decision Tree, Naïve Bayes, Random Forest, K-NN, ID3, and Random Tree classifiers were applied on six unbalanced datasets.
- Experiments on the balanced dataset: In this experiment, the challenges related to unbalanced datasets were tackled by manual procedures to avoid biased predictions and misleading accuracy. The majority class in each dataset almost equalized with the minority classes, i.e., many positive, negative, and neutral, practically the same in the balanced dataset as represented in Table 3.
4.1. Dataset Description
We obtained a dataset from Kaggle, one of the largest online data science communities in this work. It consists of more than 14000 tweets, labeled either (positive, negative, or neutral). The dataset was also split into six datasets; each dataset includes tweets about one of six American airline companies (United, Delta, Southwest, Virgin America, US Airways, and American). Firstly, we summarized the details about the obtained datasets, as illustrated in Table 1 below.
Table 1: Summary of obtained Dataset
|
American Airline Companies
|
||||||
| Virgin America | United | Delta | Southwest | US Airways | American | |
| Number of Tweets | 504 | 3822 | 2222 | 2420 | 2913 | 2759 |
| Positive Tweets | 152 | 492 | 544 | 570 | 269 | 336 |
| Negative Tweets | 181 | 2633 | 955 | 1186 | 2263 | 1960 |
| Neutral Tweets | 171 | 697 | 723 | 664 | 381 | 463 |
4.2. Dataset Cleansing
In this section, the authors described the followed procedure in the dataset preparation. The authors utilized RapidMinor software for tweet classification. Authors followed the methods described below:
- Splitting the dataset into a training set and test set.
- Loading the dataset, i.e., excel file into RapidMinor software using Read Excel operator.
- Applying preprocessing by utilizing the below operators.
- Transform Cases operator to transform text to lowercase.
- Tokenize operator to split the text into a sequence of tokens.
- Filter Stop words operator to remove stop words such as: is, the, at, etc.
- Filter Tokens (by length) operator: to remove token based on the length, in this model, minimum characters are 3, and maximum characters are 20 any other tokens that don’t match the rule will be removed.
- Stem operator: to convert words into base form.
4.3. Dataset Training
Each of the datasets was divided into two-part. The first part contains 66% of the total number of tweets of the data set, and it is used to train the machine to classify the data under one attribute, which is used to classify the tweets to either (positive or Negative or Neutral). The remaining 34% of tweets were used to classify tweets’ attribute to (positive or Negative or Neutral), i.e., test set.
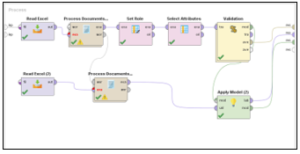
Figure 1: Summarization of the Process Model
4.4. Dataset Classifying
In this section, the authors described the steps in the tweet’s classification techniques.
- Set Role operator is used to allow the system to identify sentiment as the target variable,
- Select Attributes operator is used to removing any attribute which has any missing values.
- Then in the validation operator, the dataset is divided into two parts (training and test). We used Two-thirds of the dataset to train the dataset and the last one-third to evaluate the model.
- Different machine learning algorithms are used for training the dataset (Decision Tree, Naïve Bayes, Random Forest, K-NN, ID3, and Random Tree).
- For testing the model, the Performance operator utilized to measure the performance of the model.
5. Experiment Results and Discussion
This section presented the experiment results in terms of accuracy level of prediction for each classifier on both types of datasets (balanced, unbalanced) and a comparison between the two experiments.
5.1. Experiment results for an unbalanced dataset
Figure 2 and Table 2 present the accuracy results of the utilized classifiers on the datasets.
Table 2: Accuracy results on unbalanced dataset
| Accuracy | ||||||
| Virgin America | United | Delta | Southwest | US Airways | American | |
| Dataset | 504 | 3822 | 2222 | 2420 | 2913 | 2759 |
| Training set | 333 | 2523 | 1467 | 1597 | 1923 | 1821 |
| Test set | 171 | 1299 | 755 | 823 | 990 | 938 |
| Decision Tree | 31.86% | 72.03% | 42.08% | 50.46% | 82.72% | 68.98% |
| Naïve Bayes | 32.74% | 72.38% | 42.28% | 51.01% | 82.72% | 72.21% |
| Random Forest | 31.86% | 72.03% | 42.08% | 50.46% | 82.72% | 68.98% |
| K-NN | 39.82% | 11.66% | 35.27% | 50.46% | 82.72% | 69.43% |
| ID3 | 32.74% | 72.38% | 42.28% | 51.01% | 82.72% | 72.21% |
| Random Tree | 31.86% | 72.03% | 42.08% | 50.46% | 82.72% | 68.98% |
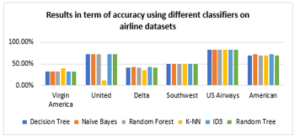
Figure 2: Accuracy results on unbalanced airline datasets using different classifiers
In some datasets, the classifier’s accuracy results were very high, while it was low in others. All classifier’s performance on the US airways dataset and United dataset provided the best accuracy due to the dataset’s size, which was the largest. Naïve Bayes classifier, Decision Tree, and ID3 were mostly better than other classifiers and were given almost the same accuracy level. The classifiers with Virgin America dataset reported the lowest accuracy level due to the dataset’s size, which is very small.
5.2. Experiment results for a balanced dataset
Decision Tree, Naïve Bayes, Random Forest, K-NN, ID3, and Random Tree classifiers were applied on the five obtained balanced datasets. (United, Delta, Southwest, and US Airways). The dataset for each was divided into two parts. The first part contains 66% of the total number of tweets of the data set, and it is used to train the machine to classify the data under one attribute, which is used to classify the tweets as either positive, Negative, or Neutral. The remaining 34% of tweets were used to classify tweets’ attributes into (positive, Negative, or Neutral), i.e., test set.
Table 3: Number of tweets before and after balancing.
| Number of instances | Percentage | ||||
| Total tweets before balancing | Total tweets after balancing | Positive | Negative | Neutral | |
| United | 3822 | 8276 | 33% | 33% | 34% |
| Delta | 2222 | 2635 | 33% | 33% | 34% |
| Southwest | 2420 | 5518 | 33% | 33% | 33% |
| US Airways | 2913 | 6608 | 33% | 33% | 33% |
| American | 2759 | 5924 | 34% | 34% | 33% |
After applying different algorithms on the five balanced datasets, the performance, i.e., accuracy results, were reported in Table 4 and Figure 3 below:
Table 4: Accuracy results on the balanced dataset
| Accuracy | ||||||
| Virgin America | United | Delta | Southwest | US Airways | American | |
| Dataset | 8276 | 2635 | 5518 | 6608 | 5924 | 8276 |
| Training set | 5464 | 1743 | 3642 | 4363 | 3911 | 5464 |
| Test set | 2812 | 892 | 1876 | 2245 | 2013 | 2812 |
| Decision Tree | 35.06% | 34.63% | 34.35% | 35.06% | 33.98% | 35.06% |
| Naïve Bayes | 97.65% | 36.99% | 65.48% | 97.65% | 61.20% | 97.65% |
| Random Forest | 35.06% | 34.63% | 34.35% | 35.06% | 33.98% | 35.06% |
| K-NN | 38.79% | 32.77% | 35.32% | 38.79% | 39.47% | 38.79% |
| ID3 | 97.65% | 36.99% | 65.48% | 97.65% | 61.20% | 97.65% |
| Random Tree | 35.06% | 34.63% | 34.35% | 35.06% | 33.98% | 35.06% |
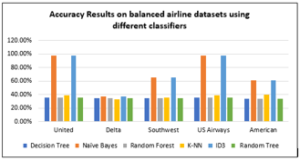
Figure 3: Accuracy results on balanced airline datasets using different classifiers
5.3. Comparison between two experiments results for each classifier
While comparing results between the performance of the classifiers on balanced and unbalanced datasets, it was found the following as seen in Figure 4 below:
5.3.1. Naive Byes and ID3
Gave the best accuracy than other classifiers in the two experiments. The accuracy level with the balanced datasets higher than unbalanced ones. In the unbalanced datasets, the maximum accuracy for both classifiers was 82.7%. In the balanced dataset, the accuracy reached 97.6%; these results confirm that these two classifiers are the best compared to the other selected classifiers in the two experiments:
5.3.2. K-NN and Decision Tree
Show better performance with the unbalanced datasets, and the difference is so apparent. The maximum accuracy with the balanced datasets is 39.4%, while it reached 82.7 % with the unbalanced datasets.
5.3.3. Random forest and Random Tree
It shows better performance with the unbalanced datasets, and the difference is so apparent. The maximum accuracy with the balanced datasets around 35%, while it reached 82.7% with the unbalanced datasets.
In conclusion, Naive Bayes and ID3 gave a better accuracy level than other classifiers, and the performance was better with the balanced datasets. The different classifiers (K-NN, Decision Tree, Random Forest, and Random Tree) gave a better understanding of the unbalanced datasets.
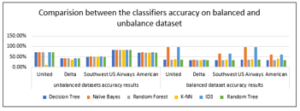
Figure 4: Accuracy results of classifiers on balanced and unbalanced datasets
6. Conclusions
Social media websites are gaining very big popularity among people of different ages. Platforms such as Twitter, Facebook, Instagram, and Snapchat allowed people to express their ideas, opinions, comments, and thoughts. Therefore, a huge amount of data is generated daily, and the written text is one of the most common forms of the generated data. Business owners, decision-makers, and researchers are increasingly attracted by the valuable and massive amounts of data generated and stored on social media websites. Sentiment Analysis is a Natural Language Processing field that increasingly attracted researchers, government authorities, business owners, services providers, and companies to improve products, services, and research. In this research paper, the authors aimed to survey sentiment analysis approaches. Therefore, 16 research papers that studied Twitter’s text classification and analysis were surveyed. The authors also aimed to evaluate different machine learning algorithms used to classify sentiment to either positive or negative, or neutral. This experiment aims to compare the efficiency and performance of different classifiers that have been used in the sixteen papers that are surveyed. These classifiers are (Decision Tree, Naïve Bayes, Random Forest, K-NN, ID3, and Random Tree). Besides, the authors investigated the balanced dataset factor by applying the same classifiers twice on the dataset, one on the unbalanced and the other, after balancing the dataset. The targeted dataset included six datasets about six American airline companies (United, Delta, Southwest, Virgin America, US Airways, and American); it consists of about 14000 tweets. The authors reported that the classifier’s accuracy results were very high in some datasets while low in others. The authors indicated that the dataset size was the reason for that. On the balanced dataset, the Naïve Bayes classifier, Decision Tree, and ID3 were mostly better than other classifiers and have given the almost same level of accuracy. The classifiers with Virgin America dataset reported the lowest level of accuracy due to its small size. On the unbalanced dataset, results show that the Naive Byes and ID3 gave a better level of accuracy than other classifiers when it’s applied on the balanced datasets. While (K-NN, Decision Tree, Random Forest, and Random Tree) gave a better understanding of the unbalanced datasets.
Conflict of Interest
The authors declare no conflict of interest
Acknowledgment
This is a part of project done in British University in Dubai.
- S.A. Salloum, C. Mhamdi, B. Al Kurdi, K. Shaalan, “Factors affecting the Adoption and Meaningful Use of Social Media: A Structural Equation Modeling Approach,” International Journal of Information Technology and Language Studies, 2(3), 2018.
- M. Alghizzawi, S.A. Salloum, M. Habes, “The role of social media in tourism marketing in Jordan,” International Journal of Information Technology and Language Studies, 2(3), 2018.
- S.A. Salloum, W. Maqableh, C. Mhamdi, B. Al Kurdi, K. Shaalan, “Studying the Social Media Adoption by university students in the United Arab Emirates,” International Journal of Information Technology and Language Studies, 2(3), 2018.
- S.A. Salloum, M. Al-Emran, S. Abdallah, K. Shaalan, Analyzing the arab gulf newspapers using text mining techniques, 2018, doi:10.1007/978-3-319-64861-3_37.
- F.A. Almazrouei, M. Alshurideh, B. Al Kurdi, S.A. Salloum, Social Media Impact on Business: A Systematic Review, 2021, doi:10.1007/978-3-030-58669-0_62.
- Alshurideh et al., “Understanding the Quality Determinants that Influence the Intention to Use the Mobile Learning Platforms: A Practical Study,” International Journal of Interactive Mobile Technologies (IJIM), 13(11), 157–183, 2019.
- S.A. Salloum, K. Shaalan, Adoption of E-Book for University Students, 2019, doi:10.1007/978-3-319-99010-1_44.
- S.A. Salloum, M. Alshurideh, A. Elnagar, K. Shaalan, “Mining in Educational Data: Review and Future Directions,” in Joint European-US Workshop on Applications of Invariance in Computer Vision, Springer: 92–102, 2020.
- S.A. Salloum, M. Alshurideh, A. Elnagar, K. Shaalan, “Machine Learning and Deep Learning Techniques for Cybersecurity: A Review,” in Joint European-US Workshop on Applications of Invariance in Computer Vision, Springer: 50–57, 2020.
- S.A. Salloum, R. Khan, K. Shaalan, “A Survey of Semantic Analysis Approaches,” in Joint European-US Workshop on Applications of Invariance in Computer Vision, Springer: 61–70, 2020.
- K.M. Alomari, A.Q. AlHamad, S. Salloum, “Prediction of the Digital Game Rating Systems based on the ESRB.”
- S.A. Salloum, A.Q. AlHamad, M. Al-Emran, K. Shaalan, A survey of Arabic text mining, Springer, Cham: 417–431, 2018, doi:10.1007/978-3-319-67056-0_20.
- C. Mhamdi, M. Al-Emran, S.A. Salloum, Text mining and analytics: A case study from news channels posts on Facebook, 2018, doi:10.1007/978-3-319-67056-0_19.
- A.S. Alnaser, M. Habes, M. Alghizzawi, S. Ali, “The Relation among Marketing ads, via Digital Media and mitigate (COVID-19) pandemic in Jordan The Relationship between Social Media and Academic Performance: Facebook Perspective View project Healthcare challenges during COVID-19 pandemic View project,” Dspace.Urbe.University, (July), 2020.
- M. Alshurideh, B. Al Kurdi, S. Salloum, “Examining the Main Mobile Learning System Drivers’ Effects: A Mix Empirical Examination of Both the Expectation-Confirmation Model (ECM) and the Technology Acceptance Model (TAM),” in International Conference on Advanced Intelligent Systems and Informatics, Springer: 406–417, 2019.
- M. Alghizzawi, M. Habes, S.A. Salloum, M.A. Ghani, C. Mhamdi, K. Shaalan, “The effect of social media usage on students’e-learning acceptance in higher education: A case study from the United Arab Emirates,” International Journal of Information Technology and Language Studies, 3(3), 2019.
- M. Habes, S.A. Salloum, M. Alghizzawi, C. Mhamdi, “The Relation Between Social Media and Students’ Academic Performance in Jordan: YouTube Perspective,” in International Conference on Advanced Intelligent Systems and Informatics, Springer: 382–392, 2019.
- M. Habes, S.A. Salloum, M. Alghizzawi, M.S. Alshibly, “The role of modern media technology in improving collaborative learning of students in Jordanian universities,” International Journal of Information Technology and Language Studies, 2(3), 2018.
- B.A. Kurdi, M. Alshurideh, S.A. Salloum, Z.M. Obeidat, R.M. Al-dweeri, “An empirical investigation into examination of factors influencing university students’ behavior towards elearning acceptance using SEM approach,” International Journal of Interactive Mobile Technologies, 14(2), 2020, doi:10.3991/ijim.v14i02.11115.
- S.A. Salloum, M. Al-Emran, M. Habes, M. Alghizzawi, M.A. Ghani, K. Shaalan, “Understanding the Impact of Social Media Practices on E-Learning Systems Acceptance,” in International Conference on Advanced Intelligent Systems and Informatics, Springer: 360–369, 2019.
- M. Alghizzawi, M.A. Ghani, A.P.M. Som, M.F. Ahmad, A. Amin, N.A. Bakar, S.A. Salloum, M. Habes, “The Impact of Smartphone Adoption on Marketing Therapeutic Tourist Sites in Jordan,” International Journal of Engineering & Technology, 7(4.34), 91–96, 2018.
- S.F.S. Alhashmi, S.A. Salloum, S. Abdallah, “Critical Success Factors for Implementing Artificial Intelligence (AI) Projects in Dubai Government United Arab Emirates (UAE) Health Sector: Applying the Extended Technology Acceptance Model (TAM),” in International Conference on Advanced Intelligent Systems and Informatics, Springer: 393–405, 2019.
- M. Alghizzawi, M. Habes, S.A. Salloum, The Relationship Between Digital Media and Marketing Medical Tourism Destinations in Jordan: Facebook Perspective, 2020, doi:10.1007/978-3-030-31129-2_40.
- R.S. Al-Maroof, S.A. Salloum, A.Q.M. AlHamadand, K. Shaalan, A Unified Model for the Use and Acceptance of Stickers in Social Media Messaging, 2020, doi:10.1007/978-3-030-31129-2_34.
- K.S.A. Wahdan, S. Hantoobi, S.A. Salloum, K. Shaalan, “A systematic review of text classification research based ondeep learning models in Arabic language,” Int. J. Electr. Comput. Eng, 10(6), 6629–6643, 2020.
- J.D. Burger, J. Henderson, G. Kim, G. Zarrella, “Discriminating gender on Twitter,” in Proceedings of the 2011 Conference on Empirical Methods in Natural Language Processing, 1301–1309, 2011.
- D. Gamal, M. Alfonse, E.-S.M. El-Horbaty, A.-B.M. Salem, “Twitter Benchmark Dataset for Arabic Sentiment Analysis,” International Journal of Modern Education and Computer Science, 11(1), 33, 2019.
- M. Nabil, M. Aly, A. Atiya, “Astd: Arabic sentiment tweets dataset,” in Proceedings of the 2015 conference on empirical methods in natural language processing, 2515–2519, 2015.
- Z.J. and G. Xiaolini, “Comparison Research on Text Pre-processing Methods on Twitter Sentiment Analysis,” Digital Object Identifier, 2017, doi:10.1109/ACCESS. 2017. 2672677.
- Q.C. Nguyen, D. Li, H.-W. Meng, S. Kath, E. Nsoesie, F. Li, M. Wen, “Building a national neighborhood dataset from geotagged Twitter data for indicators of happiness, diet, and physical activity,” JMIR Public Health and Surveillance, 2(2), e158, 2016.
- A. Amolik, N. Jivane, M. Bhandari, M. Venkatesan, “Twitter sentiment analysis of movie reviews using machine learning techniques,” International Journal of Engineering and Technology, 7(6), 1–7, 2016.
- G. Gautam, D. Yadav, “Sentiment analysis of twitter data using machine learning approaches and semantic analysis,” in 2014 Seventh International Conference on Contemporary Computing (IC3), IEEE: 437–442, 2014.
- M. Furini, M. Montangero, “TSentiment: On gamifying Twitter sentiment analysis,” in 2016 IEEE Symposium on Computers and Communication (ISCC), IEEE: 91–96, 2016.
- A. Porshnev, I. Redkin, A. Shevchenko, “Machine learning in prediction of stock market indicators based on historical data and data from Twitter sentiment analysis .,” 2013 IEEE 13th International Conference on Data Mining Workshops, 440–444, 2013, doi:10.1109/ICDMW.2013.111.
- V. Ramanathan, “Twitter Text Mining for Sentiment Analysis on People ’ s Feedback about Oman Tourism,” 2019 4th MEC International Conference on Big Data and Smart City (ICBDSC), 1–5, 2019.
- V. Martin, “Predicting the french stock market using social media analysis,” Proceedings – 8th International Workshop on Semantic and Social Media Adaptation and Personalization, SMAP 2013, 3–7, 2013, doi:10.1109/SMAP.2013.22.
- Q. Li, B. Zhou, Q. Liu, “Can twitter posts predict stock behavior?: A study of stock market with twitter social emotion,” Proceedings of 2016 IEEE International Conference on Cloud Computing and Big Data Analysis, ICCCBDA 2016, 359–364, 2016, doi:10.1109/ICCCBDA.2016.7529584.
- Indrawati, A. Alamsyah, “Social network data analytics for market segmentation in Indonesian telecommunications industry,” 2017 5th International Conference on Information and Communication Technology, ICoIC7 2017, 0(c), 2017, doi:10.1109/ICoICT.2017.8074677.
- H. Dai, J. Hao, “Mining social media data for opinion polarities about electronic cigarettes,” Tobacco Control, 26(2), 175–180, 2017, doi:10.1136/tobaccocontrol-2015-052818.
- A. Husnain, S.M.U. Din, G. Hussain, Y. Ghayor, “Estimating market trends by clustering social media reviews,” Proceedings – 2017 13th International Conference on Emerging Technologies, ICET2017, 2018-Janua, 1–6, 2018, doi:10.1109/ICET.2017.8281716.
- K. Kandasamy, P. Koroth, “An integrated approach to spam classification on Twitter using URL analysis, natural language processing and machine learning techniques,” 2014 IEEE Students’ Conference on Electrical, Electronics and Computer Science, SCEECS 2014, 1–5, 2014, doi:10.1109/SCEECS.2014.6804508.