Development of Electric Power Availability Recorder for Accurate Energy Billing of Unmetered Facilities
 , Godwin Ogechi Unachukwu 1, 2, Emenike Chinedozi Ejiogu 2, 4
Adv. Sci. Technol. Eng. Syst. J. 6(3), 7–14 (2021);
 DOI: 10.25046/aj060302
The design, fabrication and testing of a power availability recorder (PAR) to track the duration of electricity supply in facilities is presented. The design was executed with C-Language encoded in a microcontroller which served as the central processing unit of the device. Proteus software was, subsequently, used to simulate the real-life practicability of the device before the prototype was constructed. This device is designed to record power availability in seconds which can be converted to hours while energy consumption is recorded in kWh. Thereafter, the device was functionally tested and installed in a customers’ premises for a period of three (3) months. Energy Consumed was plotted against Availability using GraphPad Prism Software and it could be seen that Availability and Energy Consumption are directly proportional to each other. This forms a sound basis for discrediting the outrageous bills issued by the utility companies for months when there were few hours or no power availability. It follows therefore that if installed in unmetered households, this device could go a long way in curbing the excesses and checking the inefficiency of the utility companies in terms of unjustifiable estimated bills issued to their customers.
1. Introduction
Energy remains the major driving force for industrial, social and economic development of any country. It is also a key consideration in the sustainable management of the environment [1, 2]. Electricity is one of the cleanest and most versatile forms of energy, with high utilization efficiencies. Most energy resources are usually converted to electricity as their terminal useful energy form [3]. Consequently, electricity has become the energy form with the greatest utility in household, industrial and commercial activities in both developed and developing countries [3]. Nigeria, which is a lower middle-income country with a per capita income of $2790/yr and a poverty rate of 53%, ranks among the 10 largest oil exporting countries in the world [4]. Yet, according to the International Energy Agency, the annual per capita electricity consumption was only 140 kWh/cap/yr in 2015, when the population was 181 million [5]. This may be compared to 12,000 kW/cap/yr for the USA, a high-income country with a population of approximately 321 million [6]. The low value for Nigeria portrays a low level of development of her electricity supply subsector. Nigeria’s population is projected to rise to 266 million by 2030 [7]. Thus, substantial improvements in power generation and supply are very critical if the country is to adequately meet her future electricity needs. A growth rate of 567 GWh/yr in total generation was projected in [8], while [9] suggest that in the near future, a generating capacity of 85 TWh should be installed to meet the expected demand. This situation has led to a renewed call for diversification of energy sources with emphasis on renewables to serve the needs of off-grid rural communities [10-12].
To achieve the electricity supply objective, the country commenced a restructuring of the Electricity Supply Industry, ESI, from a government monopoly to a competitive private sector driven industry in 2001 [13, 14]. Even after successful completion of this restructuring, the ESI still manifests low power availability where access exists, frequent blackouts, estimated billing of millions of unmetered customers, difficulty in balancing supply and demand, and lack of disaggregated consumption data by economic sector, geopolitical division, facilities and homes [15]. For progress to the next and fully competitive stage, full and reliable metering of the electricity being traded among operators and between operators and consumers, among other improvements, is essential. As of 2017 only 45.3% of electricity customers on the grid were metered [16] and about 50% of the meters were either faulty or obsolete [17]. This means that a large percentage of customers, especially in the rural areas, were and still are subjected to estimated billing [18]. A supposed balance between total generation and metered sales is then arbitrarily shared among unmetered customers. The practice is thus open to abuse by the supply companies and promotes inefficient use of power by the consumers. According to [15], a large number of Nigerian electricity customers were willing to adopt the pre-paid metering, PPM, system principally due to frustration with the unjust billing by the supply companies. In contrast, in countries which have full metering and 24-hour power supply, availability is not an issue, bills accurately reflect consumption and customers are happy to pay for electricity consumed [19]. Authentic and balanced billing reduces rancor and disputes between suppliers and customers, supports business growth and economic progress and positively influences facility management and efficient use of energy. Countries with similar problems to Nigeria’s cannot enjoy these benefits. Until the country attains full metering of its customers, estimated billing of customers will be inevitable. A more equitable method must be found for making these estimates and as will be shown in this work, one such method uses the power availability value. This makes the Power Availability Recorder, PAR, a useful device in end consumer electricity trading. Other approaches have been proposed for determining estimated monthly consumption and bill. One of such is the use of the Artificial Neural Network model as was applied to residential customers by [20]. An optimized web-based billing meter, using C# programming language with MySQL for backend data base was presented by [21]. The meter measures and transmits consumed units of a customer at the end of a month, through a dedicated network.
As noted in [22], facilities resource metering is very vital for robust building energy management. Constant monitoring of an installation gives facility and property managers the information they need to improve usage and behaviour, lower electricity consumption, reduce capital expenditure and cut energy costs [23]. In countries where 24-hour/day power supply is not assured, especially if further complicated by limited metering coverage, energy management analysis of the type envisage above will need data on the power availability profiles in the regions or facilities of interest, in addition to data on energy consumption and power demand. A means of accounting for the periods of power outage needs to be incorporated into the power metering and accounting system. This calls for a device, or timer, that records electricity availability to a building or facility [22]. Several studies have been conducted on electricity consumption all over the world [24-25] but in Nigeria, it is observed that electricity consumption is strongly dependent on power availability.
In this study, a Power Availability Recorder (PAR) was developed, functionally tested and installed in four selected customers’ premises. Power availability data was taken from the device at 6am and at 6pm daily for a period of three (3) months. This further proved the device to be durable.
2. Formulation of the PAR
Codes in C-Language were written into the microcontroller of the device which serves as the central processing unit of the device. After that, Proteus software was used to simulate the real-life workability of the device. This was followed by fabrication the prototype and testing [26].
2.1. Design Considerations
The design method follows a top-down design and a bottom-up implementation approach. The design is based on a pic microcontroller and integrated circuit (IC) with other peripherals. A firm was developed in embedded C language to run in the microcontroller and coordinate and execute some task. The device is sub divided into the following integral modules: The timing module, Power sensing module, Data logging module, Display module, Power supply module.
- The Timing Module
The system incorporates a precision timer for taking record of time of power availability in seconds. In this design, a 16-bit built-in timer in the microcontroller was used. The timing is formatted as follows: DD: HH: MM: SS (Days: Hours: Minutes: Seconds).
- Power Sensing Module
This part of the circuit senses when power is available and sends a signal to the microcontroller to start timing. The circuit include a voltage buffer to eliminate loading effect from the DC source and a Zener regulator to ensure a constant voltage level.
- Data Logging Module
This module computes the duration for which power was available in real time and saves it in memory. The status of the power source is checked every seconds. Here, an LC256 EEPROM (Electrically Erasable Programmable Read Only Memory) chip is used. This EEPROM can hold up to 256kb of data which is just enough for this research.
- Display Module
This is the interface through which the user can interact with the device. The display module and the input buttons (delete and reset buttons) make up the user interface. Here we use a 16X2 alphanumeric LCD (Liquid Crystal Display) module. The duration of power availability is displayed on the LCD module. The user can read recorded data from the display screen or delete data in memory or reset device through this interface.
- Power Supply module
The device is designed to be powered from 220/240 AC mains when it is available and will be powered by a 9V battery when the ac mains is not available. The power supply circuit transforms the 220/240 AC source voltage to a clean regulated 5V DC. This is the required voltage for powering the various discrete components in the circuit.
The power supply circuit is design to supply up to 1A, hence the max dc power supplied to the device is:
![]() From the design parameters in this device, the output maximum power recorded in the device was calculated as:
From the design parameters in this device, the output maximum power recorded in the device was calculated as:
If this device operated for certain period of time (t), the total energy used can be calculate as:
![]() An off the shelve 7805 linear regulator IC was used to provide a constant DC supply. The power supply also includes an auxiliary source (battery) for powering up the device and reading out logged data and performing other user operations when mains power is unavailable. The power supply is designed to smartly switch to battery mode whenever mains power is off. The block diagram of the power supply circuit is shown in the Figure 1.
An off the shelve 7805 linear regulator IC was used to provide a constant DC supply. The power supply also includes an auxiliary source (battery) for powering up the device and reading out logged data and performing other user operations when mains power is unavailable. The power supply is designed to smartly switch to battery mode whenever mains power is off. The block diagram of the power supply circuit is shown in the Figure 1.
2.2. The System Block Diagram
The block diagram of the device indicating the interconnection of the various components is shown in Figure 2.
2.3. The device firmware
The device firmware was developed in embedded C-language and compiled to a Hex file with the CCS PICC compiler. The program algorithm is illustrated in the flowchart of Figure 3.
3. Simulation Studies
Proteus ISIS CAD software was used to simulate the circuit and perform virtual testing. The simulation shows proof of concept. The power sensor circuit is to output a logic ‘1’ when power is available and a logic ‘0’ when power is unavailable. The CPU reset and memory clear/timer reset circuits will also output either a logic ‘1’ or ‘0’ as the case may be when clicked.
Consequently, we modeled the power sensor circuit, CPU reset circuit and memory clear/timer reset circuit with a PROTEUS momentary logic state source. The momentary logic state source is a component in PROTEUS, it can be configured to output a logic ‘1’ or ‘0’ when clicked. In the simulation, the color red represents logic ‘1’ while blue represents logic ‘0’.
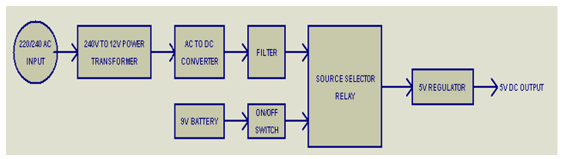 Figure 1: Power Supply Block Diagram
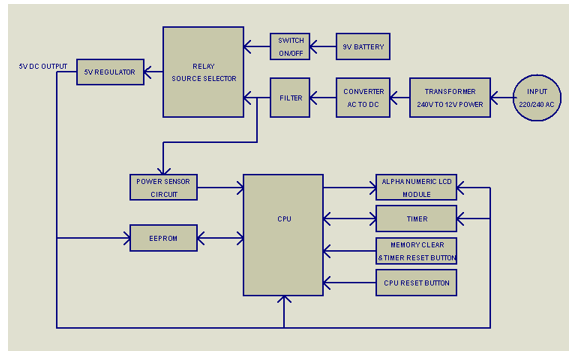 Figure 2: Device block diagram
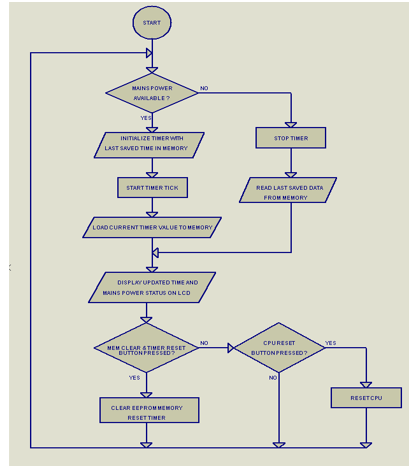 Figure 3: The Embedded Firmware Flow Diagram
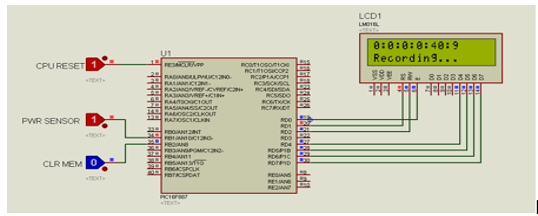 Figure 4: Power Duration Logging Simulation
3.1. Simulation of Power Duration Logging
Figure 4 is the simulation of the device logging the power duration. The power sensor in this case is red, which implies that power is available and the device is logging. The time duration is display on the alphanumeric LCD as shown in Figure 4. The CPU reset pin is active low which implies that a logic ‘0’ signal is required to activate the CPU reset operation. Therefore, the pin is normally set to logic ‘1’.
3.2. Simulation of “No power” Condition
Use SI (MKS) as primary units. (SI units are encouraged.) English units may be used as secondary units (in parentheses). An exception would be the use of English units as identifiers in trade, such as
3.3. Simulation of Memory Clear and Timer Reset Operation
In figure 6, the CLR MEM (memory clear and timer reset) circuit is red (logic ‘1’) indicating CLR MEM signal has been sent to the CPU. The CPU then activates the function which deletes all logged data in the memory and resets the timer to zero.
3.4. Power Supply Circuit Simulation
This shows the sinusoidal nature of the current and voltage display of the device during operation.
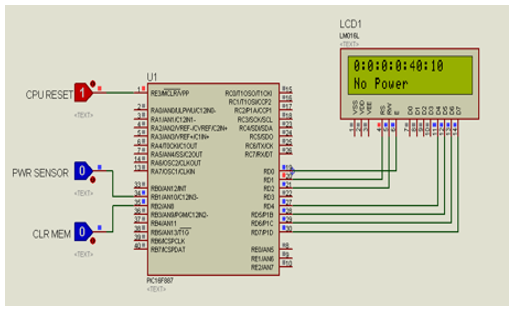 Figure 5: “No Power” Condition Simulation
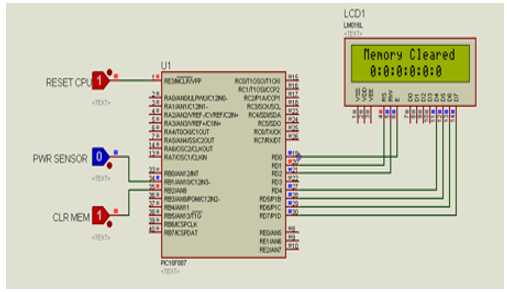 Figure 6: Memory Clear and Timer Reset Simulation
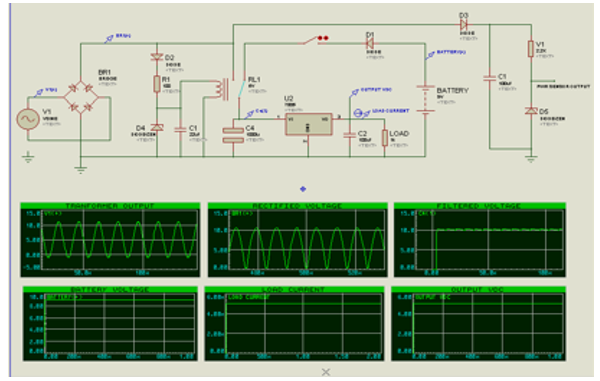 Figure 7: Power Supply Circuit Simulation
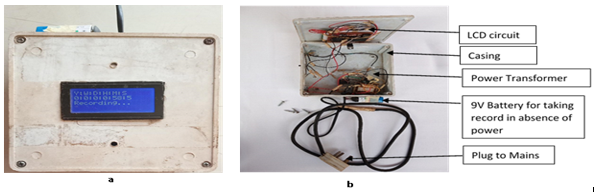 Figure 8: The Prototype Power Availability Recorder (a) PAR in Recording Mode (b) PAR Internal Circuitry
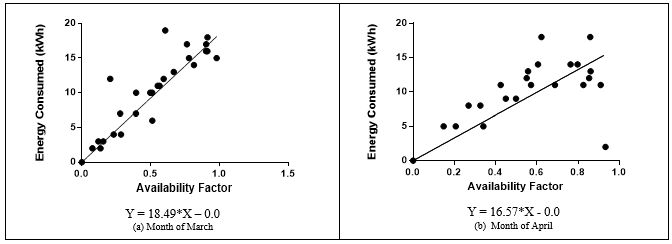
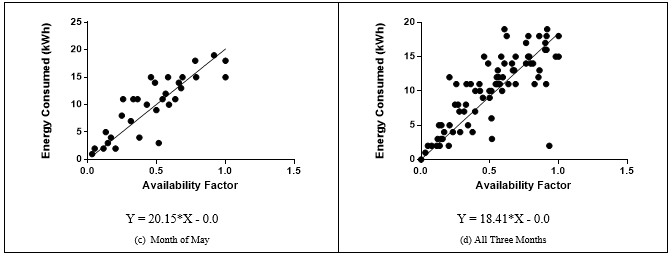 Figure 9: Daily energy consumed versus daily availability factor for March – May 2020 for No. 3 Zik’s Drive, University of Nigeria, Nsukka
4. Operational Testing of the Power Availability Recorder
After the design and construction of the PAR, it was tested to ascertain its functionality and operability. The device was seen to be very efficient in recording power availability over a period of Three (3) months and also shows to be highly durable since no fault was recorded throughout the period in which it was under use. Figure 8 shows the prototype of the PAR after it was fabricated. The device worked as intended. It was installed and used to collect power availability data for a length of three (3) months in a residential building inside University of Nigeria, Nsukka without encountering any hitch. The power availability data obtained from the device was used to plot Energy consumption against Availability Factor using GraphPad Prism Software for each month and then for the three (3) months combined together as shown in figure 9.
Figure 9 shows the variation of Energy consumed in a facility with Power Availability. It is evident that increase in availability yields corresponding increase in Energy consumed. The graphs show that this is true for the three months when availability was recorded in a residential building inside the University Community used as test a case for this research work. The slope of the relationship shows that there exists a strong positive relationship between the two. This is an experimental evidence that availability currently controls consumption and in fact limits it, given the very low power availability in the country at this time. The daily availability factor is calculated using equation 3 where Total Hours is taken to be 24 hours of the day.
 5. Discussions
From the graphs in Figure 9 it is evident that electrical energy consumed in a facility or building changes with Availability. It is evident from this figure that increase in availability yields corresponding increase in Energy consumed in a building. All the graphs show that this is true for a household inside the University of Nigeria, Nsukka used as a test case for this research work for at least a period of three months. The slope of the relationship shows that there exist a strong positive relationship between the two. This is an experimental evidence that availability currently controls consumption and in fact limits it, given the very low power availability in the country at this time.
6. Conclusion
Improvement of the existing electrical energy measurement devices had been done in terms of accurate stable power measurements. The instrument for the measurement of power availability in facilities, PAR has been successfully designed, constructed and tested. This newly developed device is able to record and store the amount of energy supply and used within the time of the power availability. During the recording period, the PAR shuts down by itself when the supplied power is below a certain regulated value which is not able to power devices in the customers` residence. The PAR works as was conceived before embarking on the project and hence can be produced massively if adequately funded by relevant agencies. It is therefore recommended that the utilities install the availability recorder in each phase of a transformer feeding a community so as to keep track of the actual figure of availability in a community and to obtain the community’s availability factor. Energy meters should be installed in a statistically significant number of households in the community which can work together with the availability data in obtaining the load use factor for the rural communities. An extensive project should be undertaken to determine the availability factors and load use factors for communities, zones or regions of a particular country. These may be used for improved determination of the actual bills for unmetered customers and in any regional or national energy modeling and planning activities. Some other researches and inclusions are in progress to see how an energy meter can be designed and incorporated into the device.
Conflict of Interest
The authors declare no conflict of interest.
Acknowledgment
The authors acknowledge the support received from the Africa Centre of Excellence for Sustainable Power and Energy Development (ACE-SPED), University of Nigeria, Nsukka that enabled the timely completion of this research.
- F. I. Abam, B. N. Nwankwojike, “Energy resource structure and on-going sustainable development policy in Nigeria: a review,” International Journal of Energy and Environmental Engineering, 5(102), 1–16, 2014.doi: 10.1007/s40095-014-0102-8.
- P. Bajpai, V. Dash, “Hybrid renewable energy systems for power generation in stand-alone applications: A review,” Renewable and Sustainable Energy Reviews, 16(5),2926–2939, 2012, DOI: 10.1016/j.rser.2012.02.009.
- Y. Liu, Y.Gao, Y. Hao, H. Liao, “The Relationship between residential electricity consumption and income: a piecewise linear model. Energies”, 9, 1–11, 2016, doi.org/10.3390/en9100831.
- S. O. Oyedepo, O. P. Babalola, S. C. Nwanya, O. Kilanko, A. O. Abidakun, O. L. Agberegha, “Towards a sustainable electricity supply in Nigeria: the role of decentralized renewable energy system,’’ European Journal of Sustainable Development Research, 2(4), 2018, DOI: 10.20897/ejosdr/3908
- J. E. Payne, “A survey of the electricity consumption-growth literature,” Applied Energy, 87(3), 723–731, 2010, DOI: 10.1016/j.apenergy.2009.06.034
- C. W. Factbook, “Energy consumption per capital and population of countries,”https://photius.com/rankings/2015/energy/electricity_consumption_per_capita_2015_1.html (accessed on 02 07 2020)
- F. I. Kazeem, “On mathematical projection of Nigeria population using numerical techniques,” FULafia Journal of Science & Technology, 5(2),176–182, 2019.
- O. Y. Usman, F. Polytechnic, K. Abdullah, U. Tun, H. Onn, “Modeling and forecast of residential electricity consumption in Nigeria advanced research in energy and engineering modeling and forecast of residential electricity consumption in Nigeria,” Advanced Research in Energy and Engineering, 1(2), 1–7, 2020.
- O. Bode, M. Kipngetich, A. Fisayo, T. Amara, O. Idowu, T. Senjyu, “Challenges and prospects of Nigeria’s sustainable energy transition with lessons from other countries’ experiences,” Energy Reports, 6, 993–1009, 2020, 10.1016/j.egyr.2020.04.022
- I.M. Chinaeke-Ogbuka, C. U. Ogbuka, C.A. Nwosu, T.C. Madueme “A renewed call for renewable energy exploitation for sustainable national development” The Fourth Electrical Engineering National Conference, Energy Sources for Power Generation (ES4PG), University of Nigeria, Nsukka 21st-23rd July, 2013, 162-168, 2013.
- C.A. Nwosu, G.C. Asomba, C.U. Ogbuka, “Community-based independent power plant: a case for renewable energy resources”. Pacific Journal of Science and Technology. 9(2), 452-460, 2008.
- D.D. Agwu, I.M. Chinaeke-Ogbuka, C.U. Ogbuka, “Toward effective harnessing of wind energy for power generation in nigeria” The Fourth Electrical Engineering National Conference, Energy Sources for Power Generation (ES4PG) UNN, Nsukka 21st-23rd July, 2013, 97-102, 2013
- Federal Government of Nigeria and A. Ministry of Power, Electric Power Sector Reform Act (EPSRA) 2005. 2005.
- Federal government of Nigeria, “National Electric Power Policy, 2001″ Ministry of Power, Abuja,” 2001.
- M. O. Oseni, “Assessing the consumers’ willingness to adopt a prepayment metering system in Nigeria,” Energy Policy, 86, 154–165, 2015,DOI: 10.1016/j.enpol.2015.06.038
- National electricity regulatory commission, “Bridging the Metering Gap as reported in www.pwc.com/ng,” 2017.
- Bridging the Metering Gap: Strategies for Success (Part 1)”, Pricewaterhouse Coopers Ltd, Advisory Outlook, www.pwc.com/ng. 2018.
- A. A. E. Audu, S. O. Paul, “Privatization of power sector and poverty of power supply in Nigeria: A policy analysis,” International Journal of Development and Sustainability, 6(10) 1218–1231, 2017.
- N. Kambule, K. Yessoufou, N. Nwulu, C. Mbohwa, “Exploring the driving factors of prepaid electricity meter rejection in the largest township of South Africa,” Energy Policy, 124(9), 199–205, 2019, DOI: 10.1016/j.enpol.2018.09.041
- A. M. Orimogunje, “Development of an ANN-based Estimated Electricity Billing System,” 2018 IEEE PES/IAS PowerAfrica, 96–101, 2018. DOI: 10.1109/PowerAfrica.2018.8521004
- D. E. Ebem, U. Arinze, “An optimized web-based energy billing system for electricity consumers in Nigeria,” Advances in Multidisciplinary and Scientific Research, 4(3), 53–64, 2018.DOI: 10.22624/AIMS/V4N3P7
- Metering installation requirements. https://www.bia.gov/sites/bia.gov/files/assets/public/pdf/idc037760.pdf (accessed on 14 05 2020)
- J. Genet and C. Schubert, “Designing a metering system for small and medium-sized buildings,” in Schneider Electirc, 2–14, 2018.
- A. Oyetunji, E. Odugboye, T. A. Arimoro, “Analysis of electricity billing system in corporate buildings in Lagos, Nigeria.,” J. Manag. Econ. Stud., 1(6), 1–22, 2019, DOI: 10.26677/TR1010.2019.150
- M. Zaman, F. Shaheen, A. Haider, S. Qamar, “Examining relationship between electricity consumption and its major determinants in Pakistan,”International Journal of Energy Economics and Policy, 5(4), 998–1009, 2015.
- C. V. Ikwuagwu, “Development and testing of a power availability recorder for buildings and facilities”, M.Eng thesis, Mechanical Engineering, University of Nigeria, Nsukka, 2017.