Electroencephalogram Based Medical Biometrics using Machine Learning: Assessment of Different Color Stimuli
 , Nafiul Hasan 2, Dil Afroz 3, Ferdaus Anam Jibon 4, Md. Arman Hossen 2, Md. Shahrier Parvage 2, Jakaria Sulaiman Aongkon 5
Adv. Sci. Technol. Eng. Syst. J. 6(3), 27–34 (2021);
 DOI: 10.25046/aj060304
A methodology of medical signal-based biometrics has been proposed in this paper for implementing a human identification system controlled by electroencephalogram in respect of different color stimuli. The advantage of biosignal based biometrics is that they provide more efficient operation in simple experimental condition to ensure accurate identification. Red, Green, Blue (primary colors) and Yellow (secondary color) were chosen as the color stimuli for making more comfortable EEG regenerating environment. Four supervised classification models, namely, Logistic Regression (LR), K- Nearest Neighbor (KNN), Support Vector Machine (SVM) and Random Forest Classifier (RFC) were trained and tested for assessing the performance of the EEG based biometric identification, with five-fold cross-validation. Four different measures (sensitivity, specificity, accuracy and area under the receiver operating characteristic curve) were used to evaluate the overall performance. The results suggested that Blue color stimuli perform the best among all the color stimulus with an accuracy ranging from (77.2-88.9%). The classifiers identify each of the subjects with any color having an accuracy ranged from (70.9-88.9%), and the RFC shows the best accuracy which is 88.9% in the case of blue color stimuli.
1. Introduction
This paper is an extension of work originally presented in 1st International Conference on Advances in Science, Engineering and Robotics Technology 2019 [1]. The presented paper utilized electroencephalogram (EEG) for medical biometrics using color stimuli using only one classifier (artificial neural networks) where the current article is expanded further to validate the EEG based biometrics using multiple machine learning models. Also, this paper examines the utility of the different color stimulus on the EEG based human identification system.
Biometrics refers to the process of identifying and authenticating a person based on a unique identifier. By utilizing a person’s unique feature, the human identification system is built for different security applications. Existing biometric systems use knowledge or possession-based features like passcode, PIN, fingerprint, voice which are extensively being used for device security and other security purposes [2]. There are some limitations in the existing authentication technologies, for example, the fingerprints can be replicated, and facial detection can be fooled [3]. The Boston Marathon bombing incident has shown the failure of the so-called advanced facial identification system [3]. Furthermore, with the development in hacking techniques such as replication of fingerprints has resulted in reduced reliability of the conventional biometric identification systems [3, 4].
In the given circumstances, unique electroencephalogram remains the only choice due to its non-biasing nature [3-6]. For this reason, physiological signal based biometrics such as EEG uses neurons activity is becoming research of interest due to its person to person variability characteristics [7]. To utilize the medical signals for biometric identification, a study was performed [3], where the authors have tried to develop an EEG-based approach in order to make an efficient human identification. In [3], the authors found the beta band as the most influential rhythm of EEG for human identification.
However, generating similar EEG signal frequently is tough and can’t be declared as a standard method. The main issue with the EEG is that it is variable and needs a specific environment to reproduce the similar patterned brainwave [3, 4]. To simplify this experimental condition, the use of color stimuli is the right choice. Every color has a unique effect on the brainwaves, which was observed by statistical analysis of the signal as per the previous studies [8]. In [4], the authors explained that frequency domain shows better performance than time domain, and the value of power spectrum density varies a lot among individuals while varies a little within an individual. It is also observed that the use of both time and frequency domain feature comes out with the best performance for human identification system [4]. A study developed an EEG based architecture for identifying the individuals based on the brainwaves using color stimulus based experiment, which was performed on three participants in a laboratory-based work [9]. The authors used three fundamental colors (Red, Green and Blue) [10] and one secondary color Yellow color stimulus for human identification purpose. The results suggested that the blue color is the most sensitive to the human identification, whereas the secondary color Yellow gave the worst performance in identification. The study showed promising results but utilized only one classifier (ANN) for the classification approach and only one performance measure (mean square error) for the assessment of the system [1]. However, considering the sensitivity and specificity metrics are most important for an EEG based detection system. As higher sensitivity with lower specificity leads to the higher false alarm, and the opposite trend causes the missing of a lot of positive states, a compromise between the two metrics is crucial. Though there are very limited works on the field of biometric identification using brainwaves, these systems are worth for the IoT devices and cyber security with the application of AI.
In this study, the data was recorded using the BIOPAC® data acquisition unit, the pre-processing and feature extraction was done using the Acqknowledge 4.1® software [11]. Most importantly, four supervised classification models, namely, Logistic Regression, K- Nearest Neighbor (KNN), Support Vector Machine (SVM) and Random Forest Classifier (RFC) were trained and tested for evaluating the performance of each of the EEG rhythm, with five-fold cross-validation. Moreover, four different performance measures (sensitivity, specificity, accuracy and area under the receiver operating characteristic curve-AUROC) were utilized to examine the performance of the human identification system.
The following part of this paper is organized as follows- a brief methodology, including experimental design and tools, then the result section with the findings. Last, the paper was concluded with as short summary, followed by a discussion on the outcomes, research implications and future works.
2. Methodology
2.1 Experimental Design
The experiment was conducted in the laboratory-based environment. The different steps for developing the electroencephalogram based human identification system by color stimuli is shown in Figure 1. With the given experimental conditions, EEG were obtained by the BIOPAC® system from the selected participants. The next step is removing the noise and artifact due to eye blinking and body movement. Then FIR band pass filter was utilized to separate bands in Acqknowledge 4.1 software. Afterwards, eight features were extracted for each band, and the selected features were supplied towards the machine learning tools. Four different supervised learning techniques, namely K-nearest neighbors (KNN), support vector machines (SVM), logistic regression (LR) and random forest classifier (RFC) were developed in python 3.6.9 platform, and models were applied for human identification. The best classifier was evaluated by comparing their performance metrics.
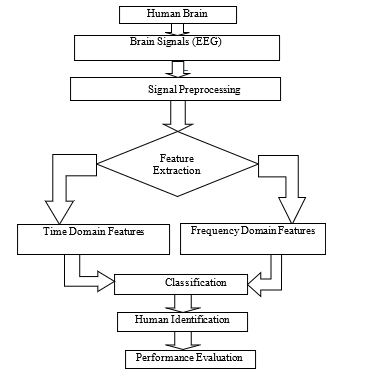 Figure 1: Block diagram of the proposed EEG based human identification system
2.2. Experimental Equipment
2.2.1. Hardware tool
For the signal acquisition, a BIOPAC® MP 36 system [11] was used at the Biomedical Engineering Lab, Khulna University of Engineering and Technology (KUET), Bangladesh. This is a wired data acquisition system which has a signal acquisition and a processing unit to interface with the computer.
2.2.2. Pre-processing software tool
As a software tool, BIOPAC student Lab Pro® was used to record the physiological signals. Acqknowledge 4.1® software was used for the feature extraction purpose [11,12]. Machine learning based classification models were developed and applied in the python 3.6.9 version in Google Colab platform, which is research based online environment affiliated by Google .
2.3. Participants
For participation in this experiment, recruitment was done with online advertisement on Facebook, Twitter and LinkedIn. In total, three subjects participated in the experiment who were male, healthy and not suffering from any color blindness or psychological illness. The color blindness was tested using the Ishihara 38 Plates CVD Test [13] upfront after they arrive in the laboratory to check their vision and to ensure they are not suffering from difficulties in choosing colors, especially the deuteranopic vision (red-green color blindness). Then, color stimulus were shown in a computer monitor (21.5″ with a 1920 ×1080 resolution) while they were instructed to focus on indefinite color for 15 minutes long, with their normal blinking. In total, twenty trials were taken for each color (red, green, blue and yellow). The electrodes were placed on the right central (C4), and the right occipital (O2) position.
 Figure 2: Experimental environment in BME, KUET
2.4. Experimental Procedure
2.4.1. Signal Preprocessing
The recorded signal contains artefacts due to muscle movement, eye blinking, hand movement and the background effect behind the color stimulus, the primarily obtained EEG signals could have contained noise. Additionally, the line frequency was 50 Hz, which also adds noise to the data. To pre-process raw EEG was gone through band-pass finite impulse response (FIR) filter with a range of 0.5 to 44 Hz, as it removes the non-linear trends of the signals. Later, the signals was further smoothed, taking a moving average over a short period of the signal. The pre-processing makes the signal viable for extracting different time and frequency domain features.
2.4.2. Feature Extraction
Feature extraction is one of the major steps of biosignal processing and analysis, which contains valuable information from the time-series signal. Several features were extracted in time and frequency domain, including maximum value (Emax), standard deviation (STDDEV), skew (sk), kurtosis (k), power spectrum density (PSD) mean, PSD max, Fast Fourier Transform (FFT) mean, FFT max (total eight feature) were extracted for different subjects using the Acknowledge 4.1® software. The feature were tabulated in the excel sheet for the future stages.
2.4.3. Feature Scaling
Machine learning models work on different strategies, and thus the range of the feature values is an essential factor. The features extracted from time and frequency domains have a different range in their magnitude. Since different machine learning models works with different features putting them in a same matrix, it is necessary to put all the features in a same range, which is referred to as feature scaling. Two common types of feature scaling is done in preliminary data: standardization and normalization [14]. As a part of the normalization process, MinMaxScaling was performed in this study in python platform. Using the MinMaxscaler() function from sklearn library. Here the data is shrunk within a range between [-1,1].
![]() If is symbolized as the the normalized value of a feature point x, within a range and , then the normalization formula can be given by the equation (1) [14].
If is symbolized as the the normalized value of a feature point x, within a range and , then the normalization formula can be given by the equation (1) [14].
2.5. Classification
The ultimate goal of the study is to identify the individual by means of the EEG features, applying the machine learning techniques. Machine learning is a hot topic nowadays, which is referred to as the application of artificial intelligence, which provides a system capable of learning nature of a given dataset. Basically, there are three categories of Machine Learning models and application, supervised learning, unsupervised learning and reinforcement learning. Supervised learning is extensively used for the classification and regression problem [15]. Previous studies worked with EEG have used supervised learnings, especially KNN [16], SVM [17], RFC [18] and LR [19]. Based on the previous studies, these four classifiers were chosen for the data classification in this research. Moreover, these models works on different algorithms of learning from the given data points, which might be worthful to see which one perform the best for the human identification purpose.
2.5.1. Logistic Regression
The simplest way to classify data points was linear regression, and the disadvantages of the linear regression models were overcome by the logistic regression models. Logistic regression is a supervised learning model, which works based on the linear method, and the predictions are made using a logistic or sigmoid function σ(t). The sigmoid function is an ‘S’ patterned curve that takes a real number and maps within a range between 0 and 1, which is given by equation (2).
![]() Contemplating the two types of variables, dependent and independent, Logistic regression predict dependant variable basing on the independent variable. The ‘C parameter was tuned here in the Logistic Regression model to lessen the overfitting problem, which could produce over-optimistic results [20].
Contemplating the two types of variables, dependent and independent, Logistic regression predict dependant variable basing on the independent variable. The ‘C parameter was tuned here in the Logistic Regression model to lessen the overfitting problem, which could produce over-optimistic results [20].
2.5.2. K-nearest neighbours (KNN)
One of the simplest supervised learning models is KNN, which is a non-parametric method where k nearest training examples in the feature space is taken as input and neighbours vote do the classification generally used for classification and regression. At the very starting point, KNN read the value of K, type of distance D and test data; then it finds the K nearest neighbours D to the test data and thus sets the maximum label class of K to test data. The same processes are gone through an iterative process named looping. In details, its algorithm initializes the value of K from 1 (setting as initial iteration value). After loading data, iteration from initial K =1 (generally) to the total number of training data point. Then, distances specifically Euclidean distance between test data and each row of training data is measured and sorted in ascending order to get topmost K rows from the sorted array and the most frequent class is returned as the predicted class [21]. The value of K was tuned, and the K for best efficiency was chosen in the classifier model in this research to reduce overfitting. With the chosen ‘K’ value the model was further developed, trained and tested with the given data.
2.5.3. Support Vector Machines (SVM)
One of the most popular supervised learning approaches, SVM aims to obtain a hyperplane which classifies the data point (data points can be at any side of hyperplane) in feature dimensional space while depending on both linear and non-linear regression. Data points distance across to hyperplane are called support vector whose detection can exchange hyper plane’s location [21]. The model used a Gaussian kernel for SVM classifier in this research due to the non-linear trend of the dataset. Two parameters- ‘C’ and ‘gamma’ was adjusted within a set of values using the grid search algorithm to reduce the overfitting problem, which could cause a non-generalized model.
2.5.4. Random Forest Classifier (RFC)
In addition to the binary logic or decision tree-based classifiers, ensemble-based models are now getting popularity due to their robustness. Random forests are made of individual decision trees with a logic of group of weak learners to finally make a strong learner while the decision trees operate as divided or conquer. A class is predicted from every decision tree and a final class is predicted by model depending on their vote [21]. Two parameters were tuned in the RFC models, namely, ‘n_estimate’, which implies the number of trees in the forest and ‘max-depth’ which signifies the depth of each tree. With the tuned parameters, the model was further developed, trained and tested to find out the performance measures.
2.6. Performance Measures
2.6.1. Sensitivity or True Positive Rate (TPR)
True positive rate or Sensitivity is the proportion of the true positives (desired factor), which is correctly identified from the given test set [22]. The definition of sensitivity can be provided by equation (3), where, TP = True Positive and FN = False Negative. In this study, sensitivity is the measure of the proportion of successfully identifying a specific person.
 2.6.2. Specificity or True Negative Rate (TNR)
True negative rate or Specificity is the proportion of true negative (undesired factor) in which was correctly excluded from the given test sets [22]. The definition of specificity can be provided by equation (4), where, TN = True Negative and FP = False Positive. In the case of this study, specificity is the measure of not correctly identifying a specific person.
 2.6.3. Accuracy
The accuracy is the proportion of true results, in an experiment, being either true positive or true negative [22]. The definition of accuracy can be provided by equation (5), given that TP = True positive, TN= True Negative, FP= False Positive and FN = False Negative. In this study, accuracy is the proportion of the successful identification, either a specific person or not being that person.
 2.6.4. Area under the receiver operating characteristic (ROC) curve (AUC)
A system having a higher discrepancy between sensitivity can cause false alarm or missing positive states (in this case, identification of a specific individual). Therefore, it is essential to find out the best compromise between them. As a part of this step, ROC is performed, which is a plot of the sensitivity (true positive rate) against the (1- specificity) or false positive rate. Here all the possible combination of TPR and FPR are plotted, showing the trade-off between them [23].
Validation of the performance of the models is an important step towards evaluation of a model. Five-fold cross-validation was done in this study while evaluating the performance measures. The mean value and the standard deviation (SD) were noted, considering the five experimental validations. As the classification is a four-class problem, one vs. all method was used in all the classification approach, splitting the four-class problem in binary class. Thus, the mean sensitivity, specificity and AUC was calculated from the obtained confusion matrix, which was used for further analysis.
3. Results
3.1. Data visualization
Visualizing the data is one of the main steps to understand the data points, and thus it helps to take the further decisions in the machine learning approach. The data points found from the selected features were plotted in box and violin plots to observe the range of each of the features. The following Figure 3 shows that the time and frequency domain features are having a versatile variation in the range. Range of the difference features varies among themselves either in the time domain or in the frequency domain. Thus, feature scaling was done on the given dataset, and the scale features were supplied to the learning models.
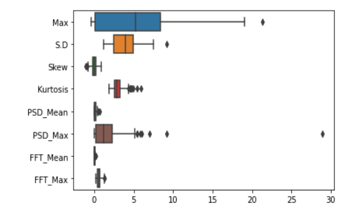 Figure 3: Boxplot of part of the EEG data showing the varying magnitude of different features
3.2. Classification Performance
Finalizing the feature scaling, the scaled features were supplied towards the machine learning models after necessary parameter tuning. Four different performance measures were evaluated, namely, sensitivity or true positive rate (TPR), specificity or True negative rate (TNR), accuracy and area under the receiver operating characteristic (ROC) curve (AUC). The obtained results are listed below in Table 1, which visualizes the performance metrics with respect to the classification models.
Table 1: Performance measures (mean value) for EEG biometrics using four different classifiers, using a five-fold cross-validation
| LR | KNN | SVM | RFC | ||
| Red Stimuli | Sensitivity | 75.4 | 70.6 | 77.1 | 74.8 |
| Specificity | 72.5 | 70.7 | 76.6 | 81 | |
| Accuracy | 79.1 | 74.1 | 78.3 | 79.8 | |
| AUC | 74.1 | 80.3 | 69 | 83.7 | |
| Blue Stimuli | Sensitivity | 89.8 | 90.9 | 84.1 | 93.3 |
| Specificity | 89.8 | 80.8 | 81.9 | 90.6 | |
| Accuracy | 82.8 | 81.7 | 77.2 | 88.9 | |
| AUC | 75.6 | 84.1 | 77.3 | 90 | |
| Green Stimuli | Sensitivity | 76.6 | 72.9 | 68.6 | 83.3 |
| Specificity | 75.8 | 77.4 | 71.8 | 76.3 | |
| Accuracy | 75 | 70.9 | 81 | 83.6 | |
| AUC | 78.6 | 80.6 | 70.4 | 83.8 | |
| Yellow Stimuli | Sensitivity | 76.4 | 76.11 | 73.3 | 84.1 |
| Specificity | 81.6 | 75.63 | 73.5 | 84.4 | |
| Accuracy | 75.5 | 74.69 | 76.5 | 86 | |
| AUC | 76.9 | 72.83 | 79.5 | 84 |
3.2.1. Scenario-1: HID using Red Color stimuli
While using the red color stimuli for human identification, the performance measures (mean ± SD) obtained from the human identification from four different classifiers, namely logistic regression (LR), K-nearest Neighbours (KNN), Support Vector Machine (SVM) and Random Forest Classifier (RFC) are shown in the Figure 4. The plots show that the gap between sensitivity and specificity is highest in RFC (6.1%) and lowest in the case of KNN (0.1%). RFC shows the highest gap between sensitivity and specificity (6.1%). Overall, considering the accuracy and ROC, RFC gives the best performance with an accuracy of 79.8%.
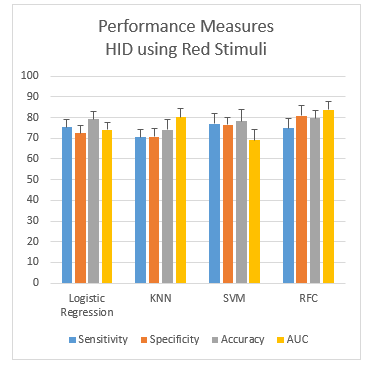 Figure 4: Performance measurement of red stimuli
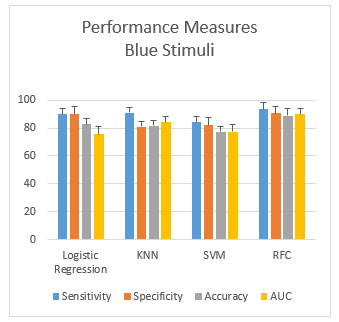 Figure 5: Performance measurement of blue stimuli
3.2.2. Scenario-2: HID using Blue Color stimuli
While using the blue color stimuli for human identification, the performance measures (mean ± SD) obtained from the human identification from four different classifiers are shown in the Figure 5. Here, KNN shows the highest gap (10.1%) between sensitivity and specificity, and LR shows a zero gap between the two metrics. Overall, RFC gives an accuracy of 88.9%, which performs the best.
3.2.3. Scenario-3: HID using Green Color stimuli
While using the green color stimuli for human identification, the performance measures (mean ± SD) obtained from the human identification from four different classifiers are shown in the Figure 6. The plots show that the gap between sensitivity and specificity is highest in RFC (7.03%) and lowest in the case of LR (0.85%). Overall, RFC gives an accuracy of 83.6%, which performs the best.
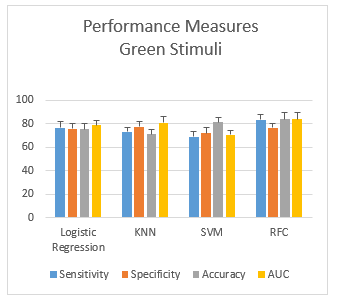 Figure 6: Performance measurement of green stimuli
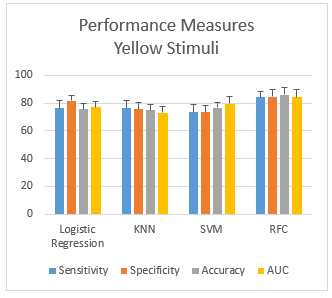 Figure 7: Performance measurement of yellow stimuli
3.2.4. Scenario-4: HID using Yellow Color stimuli
While using the yellow color stimuli for human identification, the performance measures (mean ± SD) obtained from the human identification from four different classifiers are shown in the Figure 7. The plots show that the gap between sensitivity and specificity is highest in LR (5.2%) and lowest in the case of SVM (0.2%). LR shows the highest gap between sensitivity and specificity. Overall, RFC gives an accuracy of 86%, which performs the best.
3.3. Choosing the best scenario/best performance in subject identification
In order to find out the best color stimuli for human identification, the accuracy and AUC measures was selected as two reference metrics as it is difficult to compare different classifiers using several factors. The plots of the accuracy for four different classifiers corresponding to the four color are shown in Figure 8 below. From the figure, it is evident that the accuracy for blue stimuli is better than any other colors for all the four classifiers. Overall, it is evident that all the classifiers identify subjects by using blue color more accurately. So, in the rest of the papers, the performance for the blue color will be considered.
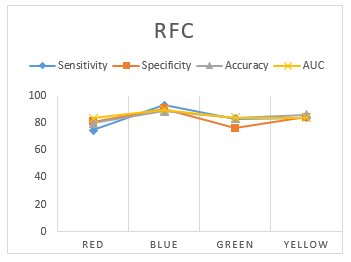 Figure 8: performance measurement of RFC
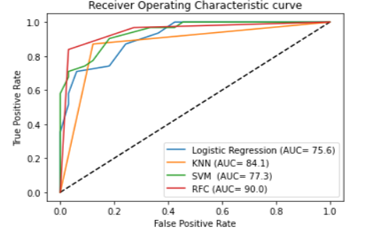 Figure 9: Comparison of AUC for four different classifiers for blue color based HID
3.4. Choosing the best Classifier
Considering the blue color for human identification, the plots for the area under the ROC curve for the classifiers are shown in the Figure 9. The figure illustrates that the RFC classifier show the best compromise between sensitivity and specificity, with covering the highest area under the ROC curve (AUC= 0.90%). Thus, the next part the paper will compare the performance of the color stmuli considering RFC. Overall, all the plots show that RFC performs the best on EEG based human identification for blue color stimuli.
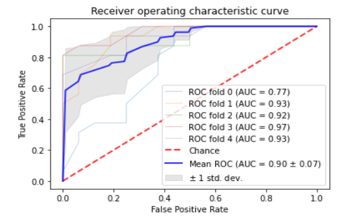 Figure 10: ROC Plots for Blue Stimuli based RFC model with 5 fold CV
As the RFC performs the best, the Area under the AUC curve plots for this model with blue color stimuli in 5 different experiments is given in Figure 10 for five-fold cross-validation. The AUC for the blue color stimuli ranged from (0.77-0.93), with a mean of 0.90 and 0.07 standard deviation. This signifies that, the blue color shows an excellent performance than the other colors while using RFC classifier in order to make EEG based medical biometric system.
4. Discussion
Four different color stimulus were used in this study for assessing the performance of the EEG rhythms for medical biometrics. The results revealed that Blue stimuli perform the best among the other colors. It also revealed that the maximum performance was obtained using the RFC Classifier, with a sensitivity, specificity and accuracy of 93.3%, 90.6% and 88.9%. Moreover, RFC based model with blue stimuli based dataset shows promising AUC (0.90), which is a good compromise between sensitivity and specificity. The finding of this study is consistent with the previous study [1], where the authors found the Blue stimuli as the best performing rhythm, though they have used only one classifier (ANN) and one performance metrics (mean square error). The possible reason behind the best performance of ANN in that study could be the backpropagatipon algorithm, which is strong enough to learn the inherent features and complex structure of the data. Nonetheless, the random forest algorithm works on the majority voting of the multiple decision trees, thus it provides very precise performance, and it is less prone to overfitting. Thus, achieving the similar outcome validates the use of the blue color stimuli for medical biometrics. On the other hand, while using the random forest classifier, the red stimuli perform the worst (RFC accuracy= 79.8%).
However, the scope of the paper is not out of limitations. The background effect is one of the main challenges while using the color stimulus. Inter-individual difference among participants is another factor, which is needed to be considered. As the paper represented a novel methodology of EEG based medical biometrics system using four different colours in a laboratory-based condition, more research is required to find out the feasibility in real-world condition as well.
5. Conclusion
In order to develop an EEG based medical biometrics system using this proposed model, an analysis was done in this study to find out the feasibility of the time and frequency domain EEG features, with respect to different color stimuli. Here efficiency is obtained after applying several steps- feature scaling, tuning of classifiers and finally with five-fold cross-validation of the developed models. The analysis of the results show that the blue color based biometrics system shows the best accuracy than the other color stimuli and the accuracy profiles are promising, i.e. LR (82.8.3%), KNN (81.7%), SVM (77.2%), RFC (88.9%). The further research investigation found that the blue color stimuli with RFC classifier showed the best accuracy while the red color stimuli showed the most insufficient accuracy. However, the experiment could be done on more number of participants to validate the model based on leave one participant out approach. Also, efficiency will increase with the addition of more EEG channels which can be considered for future work. Using a deep-learning framework would be more appropriate, which will reduce the time for handcrafted feature extraction.
Conflict of Interest
The authors declare no conflict of interest.
Acknowledgment
The authors want to acknowledge the signal recording facilities provided from the Biomedical Engineering Laboratory, KUET.
- M.M. Hasan, N. Hasan, M.M. Islam, M. Suhi, “Human identification based on color stimuli,” in 2019 1st International Conference on Advances in Science, Engineering and Robotics Technology (ICASERT), IEEE: 1–4, 2019.
- F.F.I.E. Council, “Authentication in an internet banking environment,” FFIEC Gencies (August 2001 Guidance), 2005.
- M.M. Hasan, M.H.A. Sohag, M.E. Ali, M. Ahmad, “Estimation of the most effective rhythm for human identification using EEG signal,” in 2016 9th International Conference on Electrical and Computer Engineering (ICECE), IEEE: 90–93, 2016, doi:10.1109/ICECE.2016.7853863.
- M.M. Hasan, M.H.A. Sohag, M. Ahmad, “EEG biometrics based on small intra-individual and large inter-individual difference of extracted features,” in 2016 2nd International Conference on Electrical, Computer & Telecommunication Engineering (ICECTE), IEEE: 1–4, 2016.
- A. Riera, A. Soria-Frisch, M. Caparrini, C. Grau, G. Ruffini, “Unobtrusive biometric system based on electroencephalogram analysis,” EURASIP Journal on Advances in Signal Processing, 2008(1), 143728, 2007.
- C.R. Hema, M.P. Paulraj, H. Kaur, “Brain signatures: A modality for biometric authentication,” in 2008 International Conference on Electronic Design, IEEE: 1–4, 2008.
- Q. Gui, Z. Jin, W. Xu, “Exploring EEG-based biometrics for user identification and authentication,” in 2014 IEEE Signal Processing in Medicine and Biology Symposium (SPMB), IEEE: 1–6, 2014.
- D. Zakzewski, I. Jouny, Y.C. Yu, “Statistical features of EEG responses to color stimuli,” in 2014 40th Annual Northeast Bioengineering Conference (NEBEC), IEEE: 1–2, 2014.
- M.M. Hasan, N. Hasan, A. Rahman, M.M. Rahman, “Effect of Smoking in EEG Pattern and Time-Frequency Domain Analysis for Smoker and Non-Smoker,” in 2019 International Conference on Computer, Communication, Chemical, Materials and Electronic Engineering (IC4ME2), IEEE: 1–4, 2019.
- D.Q. Utama, T.L.R. Mengko, R. Mengko, M.N. Aulia, “Color blind test quantification using RGB primary color cluster,” in 2016 International Conference on Information Technology Systems and Innovation (ICITSI), IEEE: 1–4, 2016.
- D. Acquisition, Analysis with BIOPAC MP Systems, AcqKnowledge 4 Software Guide. pdf, Biopac Systems, Inc. ISO 9001: 2008.
- M.M. Hasan, M. AshfaqulIslam, S.A. Imtiyaz, M. MahbubHasan, “Presumption method for detecting and analyzing human mental behavior by employing EEG signal,” in 2018 4th International Conference on Electrical Engineering and Information & Communication Technology (iCEEiCT), IEEE: 519–523, 2018.
- D. Flück, “Ishihara 38 Plates CVD Test| Colblindor,” Colblindor. WordPress. Nd Web, 7–11, 2016.
- C. Colantuoni, G. Henry, S. Zeger, J. Pevsner, “SNOMAD (Standardization and NOrmalization of MicroArray Data): web-accessible gene expression data analysis,” Bioinformatics, 18(11), 1540–1541, 2002, doi:https://doi.org/10.1093/bioinformatics/18.11.1540.
- F. Pedregosa, G. Varoquaux, A. Gramfort, V. Michel, B. Thirion, O. Grisel, M. Blondel, P. Prettenhofer, R. Weiss, V. Dubourg, “Scikit-learn: Machine learning in Python,” The Journal of Machine Learning Research, 12, 2825–2830, 2011.
- S. Bhattacharyya, A. Khasnobish, S. Chatterjee, A. Konar, D.N. Tibarewala, “Performance analysis of LDA, QDA and KNN algorithms in left-right limb movement classification from EEG data,” in 2010 International conference on systems in medicine and biology, IEEE: 126–131, 2010.
- H. Lee, S. Choi, “Pca+ hmm+ svm for eeg pattern classification,” in Seventh International Symposium on Signal Processing and Its Applications, 2003. Proceedings., IEEE: 541–544, 2003.
- L. Fraiwan, K. Lweesy, N. Khasawneh, H. Wenz, H. Dickhaus, “Automated sleep stage identification system based on time–frequency analysis of a single EEG channel and random forest classifier,” Computer Methods and Programs in Biomedicine, 108(1), 10–19, 2012, doi:https://doi.org/10.1016/j.cmpb.2011.11.005.
- J. Kim, J. Lee, C. Lee, E. Park, J. Kim, H. Kim, J. Lee, H. Jeong, “Optimal feature selection for pedestrian detection based on logistic regression analysis,” in 2013 IEEE International Conference on Systems, Man, and Cybernetics, IEEE: 239–242, 2013.
- H. Rajaguru, S.K. Prabhakar, “Non linear ICA and logistic regression for classification of epilepsy from EEG signals,” in 2017 international conference of electronics, communication and aerospace technology (ICECA), IEEE: 577–580, 2017.
- K. AlSharabi, S. Ibrahim, R. Djemal, A. Alsuwailem, “A DWT-entropy-ANN based architecture for epilepsy diagnosis using EEG signals,” in 2016 2nd International Conference on Advanced Technologies for Signal and Image Processing (ATSIP), IEEE: 288–291, 2016, doi:10.1109/ATSIP.2016.7523093.
- W. Zhu, N. Zeng, N. Wang, “Sensitivity, specificity, accuracy, associated confidence interval and ROC analysis with practical SAS implementations,” NESUG Proceedings: Health Care and Life Sciences, Baltimore, Maryland, 19, 67, 2010.
- D. Justin, R.S. Concepcion, A.A. Bandala, E.P. Dadios, “Performance Comparison of Classification Algorithms for Diagnosing Chronic Kidney Disease,” in 2019 IEEE 11th International Conference on Humanoid, Nanotechnology, Information Technology, Communication and Control, Environment, and Management (HNICEM), IEEE: 1–7, doi:10.1109/HNICEM48295.2019.9073568.