A Survey of Big Data Techniques for Extracting Information from Social Media Data

Adv. Sci. Technol. Eng. Syst. J. 6(3), 189–204 (2021);
 DOI: 10.25046/aj060322
Data mined from social media can be used in a variety of methods. The goal of this paper is to explore some of the various methods of mining data from social media and the different areas of its applications. From the analysis of other studies, it was clear that methods such as text analysis, classification, clustering, mapping, testing/validity methods, regression, and research methods were the overarching themes of the previously done research. Pros, cons, and possible extensions were examined for the current research evaluated in the social media data mining area. At the conclusion of this survey, our research team found that text analysis, sentiment analysis, and support vector machine classifiers were among the most common themes of the research methods in this field. In most cases, multiple methods were attempted for each topic to be able to cross compare results.
1. Introduction
In this study, we examined the various techniques that have been used in data mining for social media data. With many social media platforms used by millions, such as Facebook, Twitter, Instagram, etc., all posts by users are collected and comprise the “big data” of social media. Social media data can be used in a variety of ways from predicting buying habits of users to generating information about emergency events.
The idea of using social media to make predictions about individuals is more relevant than ever. Across all types of individuals, social media usage has shown to be on the rise. For example, Figure 1a-c shows the social media growth over three variables (age, race and income). In all cases, more social media use is being experienced allowing us to collect data on a wide range of individuals for a variety of applications. Similarly, Figure 2 shows the frequency that these applications are being used. As seen, for the majority of the individuals, daily data is being obtained which can help better explain the behaviors showcased by people [1].
Selecting efficient methods in the task of social media data mining is a critical consideration for researchers because the methods used need to be executed efficiently when there is a large amount of data. Researchers must also consider the various types of data that are present when analyzing social media data.
A previous survey of data mining techniques in social media analyzed 66 reports on data mining in social media [2]. The authors of this paper mention the important fact that establishing successful data mining techniques in social media is difficult because of the amount of data and the velocity of that data; all social media data is collected in real time so there is constantly more data being added to the repositories where this data is stored. In this study, the authors identified 19 different data mining techniques that were used by researchers to analyze social media data and compared the effectiveness of these techniques. The authors noted that many of the researchers did not back up their methods with statistical significance testing, which presents an issue with the reliability of the methods used.
For the purpose of this research, we analyzed 12 previous studies that have been conducted on data mining social media data. While conducting this research, the following research questions were kept in mind to guide the focus of our analysis: what topics (or areas of interest) have been explored in regards to social media data mining, what methods have been used for data mining in social media data in these areas, are certain data mining methods applied to specific areas/topics, how do each of these data mining methods perform and can we make suggestions on how to approve future analysis projects on social media data mining.
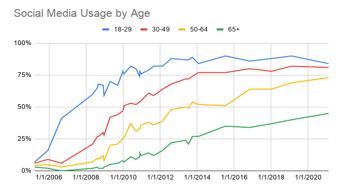 Figure 1a: Social Media Use by Age
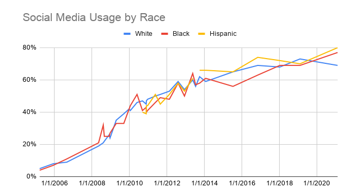 Figure 1b: Social Media Use by Race
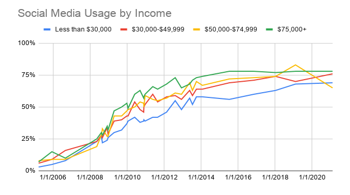 Figure 1c: Social Media Use by Income
The remainder of this paper will be structured as follows: we will first discuss the various methods that have been used in data mining social media data, we will then provide summaries on the 12 papers selected for this research followed by an overview of the findings from each paper, and finally we will provide a conclusion on the research that has been conducted for this paper.
2. Methods
There are many machine learning methods used in analyzing big data. The methods discussed below are used in the studies observed in this research paper.
2.1. Text Analysis
Text analysis is used to gather important information from unstructured text. Patterns of specific text can be collected, or common words and phrases can be determined using text analysis. Many text analysis methods use natural language processing (NLP). Text analysis is frequently used in social media studies as users can post about anything they chose. Valuable insights can be derived from these data, such as companies collecting feedback about their brand or a specific product.
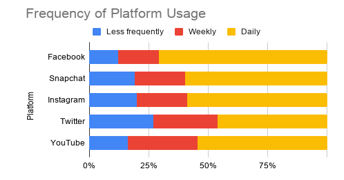 Figure 2: Frequency of platform usage
1) Latent Dirichlet Allocation (LDA): Latent Dirichlet Allocation (LDA) is a topic model in natural language processing. LDA allows sets of observations to be explained by unobserved groups that explain the similarity in some parts of the data. In LDA, both word distribution for each topic and topic proportion for each document are modeled using Dirichlet distributions [3]. Common topics and words within the text data can be ranked by their resulting probabilities to determine which occur most frequently.
2) Normalized Discounted Cumulative Gain: Normalized Discounted Cumulative Gain (NDCG) is a method for measuring the quality of a set of search results. The result of NDCG is a scaled ranking system which tells the user which results are relevant using a numbered ranking system. For example, a score of 0 meaning least relevant and a score of 2 meaning most relevant. In NDCG, very relevant results are more important than partly relevant or irrelevant results, which is called cumulative gain. Discounting is when relevant results are more important when they appear earlier in the search results. The ranking of the result should not depend on the query performed; this is normalization [4]. In discounted cumulative gain, results that appear lower are discounted, i.e., they are not as valuable as results that appear higher in the search results. Normalization scales the results to the best result seen.
3) Sentiment Analysis: Sentiment analysis is the classification of textual data to uncover classifications of emotions that can be seen in the text. The method is either rule based, governed by manually determined rules (like looking for specific words or phrases), automatic, governed by machine learning techniques, or a combination of the two. Naïve Bayes, Linear Regression, Support Vector Machines, and Deep Learning are commonly used classification algorithms to perform sentiment analysis [5]. Given the variety of machine learning techniques that can be used to perform sentiment analysis, the user is able to select which technique best suits their needs based on the type of data being used and the desired format of the result.
4) Text Analysis/Classification: Text analysis and classification have a primary goal of taking something which may be unstructured and trying to impose a structure on it. From a classification standpoint, this involves taking an unsorted list of items and attempting to assign them to appropriate groups. Text analysis, similarly, takes text and makes it understandable and easier to manage. This can be helpful while analyzing masses of text data such as social media, comments, and surveys [6]. Like sentiment analysis, the user has options to choose from when deciding how to perform text classification. Users can use a rule-based system, which classifies text into certain groups based on a set of linguistic rules that are pre-determined by the user. This method requires more work from the user to determine the rules to apply when classifying. Machine learning-based systems, such as Naive Bayes and Support Vector Machines, may also be used in text classification. It is up to the user to decide which method will perform best based on the size of their dataset and the result they wish to achieve.
5) TF-IDF: Term frequency – inverse document frequency (TF-IDF) serves as a statistical measure which determines the relevancy of a specific word in a defined collection of documents. TF-IDF is a widely accepted statistic because it not only accounts for how often a word appears, but also how many documents they appear in. Therefore, words such as “and” are not deemed inaccurately as relevant. This method is used for text vectorization (turning text into numbers) to further be processed by machine learning algorithms for various applications [7].
6) Twitter API Search: Twitter standard search API returns a set of tweets considered relevant by whatever the specified query was [8]. This method is used to gather results that can later be used in text analysis and sentiment analysis. An API search allows for “tweets” to be pulled from as early as 2006. This serves as helpful data when needing to examine text from a specific period of time (or comparison of times) for the analysis.
7) Active semi-supervised Clustering based Two-stage text classification (ACTC): ACTC is a method that turns text classification into a supervised problem [9]. This algorithm is done in two stages. The first stage is a clustering stage in which the data is clustered using a method called SemiCCAc; this algorithm was created to address that cluster-bias problem that often exists when clustering text data. The second step is a classification method using discriminative classifiers. In the first part of the algorithm, the unlabeled text data is clustered to create tentative labels for the clustered data. In the second part, the discriminative classifier is used to assign the final labels to each group of the text data. The resulting output after the classification stage is complete may require additional processing using supervised learning techniques. The idea behind the method of combining clustering with classification is to attempt to minimize the amount of text data that would be mis-labeled by using either clustering or classification alone; this combination should result in a reduction of the further processing of the output that would be needed when compared to only using one of the methods alone.
8) Example Adaption for Text categorization (EAT): Traditional text categorization algorithms work by categorizing text data based on negative and positive labels [10]. For example, if we have defined a category to gather all text related to plants and we wish to analyze a new set of text data to determine if this data is related to this category, the new data set may not be easily identified as either positive or negative because there are a variety of terms that may be used to identify text related to the plant category. The EAT algorithm works by teaching the classifier given the new dataset that is to be used. The authors who proposed this method gave the example of categorizing text data about an election. In analyzing a new text dataset, we also want to look out for terms such as “voters” to be associated with the election dataset. This new method works by identifying new terms that should be considered by the classifier in order to assign the text data a positive or negative label.
9) General Architecture for Text Engineering (GATE): GATE is a set of tools written in Java which can be used for analysis projects involving things like text mining and information extraction [11]. There are various tools that make up the GATE system, such as ANNIE, which is used for information extraction given a text dataset as input. Users of GATE can perform a wide variety of analytical tasks on text data, and there are various software that offer user-friendly versions of the system in a GUI environment. The GATE system accepts text datasets in various formats, such as txt, html, pdf, etc. The various inputs that are allowed in this system make it an ideal system in a field such as social media data mining because the text data associated with these tasks can often come in various formats. Because the user has the option of a GUI environment, results may be interpreted in a simpler manner as opposed to requiring additional processing.
2.2. Classification
Classification can be either supervised or unsupervised machine learning models, although they are commonly supervised learning. For unsupervised learning, the software determines the characteristics of the data to define classes. For supervised learning, a user can select the classes or use training sets with classes defined in order to train the software. These are used to predict the class of new data points.
1) Discriminant Analysis: Linear Discriminant Analysis (LDA) is both a classifier and a dimensionality reduction technique. LDA is the preferred method of analysis when there are more than two classes [12]. LDA is commonly used in the pre-processing step of machine learning and pattern classification projects. LDA uses Bayes’ Theorem to estimate the probability that a new set of input values belongs to every class. The output class is the class with the highest probability. LDA assumes that the data are normally distributed and also assumes a common covariance matrix. Quadratic Discriminant Analysis (QDA) is a variant of LDA that allows for non-linear separation of data. There is not an assumption that the covariance of each of the classes is identical in QDA as with LDA [12].
2) Naïve Bayes: Naïve Bayes is a probabilistic classification method based on Bayes’ theorem. It makes decisions using the Maximum A Posteriori decision rule in a Bayesian setting [2]. The goal is to determine the probability of the features occurring in each class and to return to the most likely class. The only thing that must be done before prediction is finding the parameters for the features’ individual probability distributions. A naïve Bayes classifier assumes that the presence or absence of a particular feature of a class is unrelated to the presence or absence of other features. Naïve Bayes classifiers are popular for text classification. A classic use of naïve Bayes classifiers is spam filtering.
3) Support Vector Machines: Support Vector Machines are extremely popular supervised learning models. This method of classification creates a decision boundary which is designed by training points to then classify new data points based on which side of the boundary they fall on. Support vector machines offer a large advantage because they can create nonlinear boundaries easier than some other methods. This is done using a kernel trick which replaces its predictors with a kernel function [13].
4) Decision Trees: Decision trees are a way of performing classification on datasets [14]. Decision trees are popular in machine learning because they are easy to understand. The idea behind decision trees is that similar data points are grouped together in leaf nodes based on decisions that are made. These decisions are represented by the branches of the tree. Each lead node represents a label for a class. Data points are assigned to these classes by following the structure of the tree and going through the tests represented by each branch. Data points are assigned to a leaf node based on the result of the test at each branch that it goes through. So, for unlabeled text data, which is often what data sets consist of in social media data mining, the text data would go through the various tests along the tree structure in order to be assigned a class label.
5) K-Nearest Neighbor (KNN): KNN is a classification algorithm used in machine learning [15]. This algorithm works by analyzing the raw data points specifically by what other data points in the dataset are close to each other. A value K is selected by the researcher; this determines the number of “neighbors” each data point should have. The distance between a raw data point and it’s neighbors is pre-determined by the researcher, meaning for a data point to be a neighbor it must be within a certain distance. Class labels are formed by the groups that are formed between each raw data point and its neighbors. This algorithm can be trained on a training dataset and tested on a test dataset in order to select the optimum distance and optimum value of K.
6) Logistic Regression: Logistic regression is a powerful classification algorithm; however, it is limited to two classes or binary classification problems [2]. While it can be extended for additional classes, it is rarely used this way. Logistic regression can be used to predict the likelihood of an outcome based on the input variables.
2.3. Clustering
Clustering is an unsupervised machine learning technique in which data are grouped together in order to make assumptions about the data. The data in each group, or cluster, are most similar to the other data in the same group as opposed to the other groups. It is useful in determining characteristics of data, such as clustering customer orders to determine which types of customers purchase certain products. Outliers are also more evident when using clustering. There are many types of clustering algorithms. Some of the more commonly used algorithms are K-means clustering, DBSCAN clustering, Affinity Propagation clustering, BIRCH clustering, and Mean-Shift clustering. The clustering methods discussed below are the methods used in the studies reviewed in this paper.
1) Positive examples and Negative examples Labeling Heuristics (PNLH): the purpose of Positive examples and Negative examples Labeling Heuristics (PNLH) is to extract reliable positive and negative examples [16]. Reliable negatives are extracted using features that occur more frequently in positive data. Then the sets of positives and negatives are enlarged by clustering the reliable negatives. If an example is close to a positive but not close to a negative example, it is added to the reliable positives. If an example is close to a negative example but not close to a positive example, it is added to the reliable negatives.
2) Similarity Matrix: a similarity matrix is a method of expressing the closeness of relationship between two data points. There are various methods of calculating a similarity score. A similarity matrix has many applications in clustering. Additionally, methods exist based on the similarity matrix such as the clustering-based similarity partitioning algorithm. This matrix provides a convenient way to showcase how points are related and showcase the clustering rationale [17].
3) Parallel Density-based Spatial Clustering with Noise (PDBSCAN): DBSCAN is a clustering method that utilizes a density method to cluster data points, it is highly used in the machine learning field [18]. For each data point within a cluster, there needs to be a minimum number of other data points within a predetermined radius of that data point. So, data points are grouped based on two predetermined parameters. The first parameter is “eps” which indicates how close the data points are to be to each other to be considered as being in the same cluster. The second is “minPoints” which tells the algorithm how many points must be within the radius of each data point. This traditional model of DBSCAN can be computationally expensive with large datasets, thus an updated version of this method called PDBSCAN has been proposed for big data mining, such as social media data mining [19]. This parallel version of this algorithm works by first creating local clusters within different pieces of the data. This is done in parallel, so the data is divided into sections and these local clusters are formed at the same time. Then, these local clusters for each section are combined to form the final clusters. Researchers have found that the parallel adjustment to the DBSCAN algorithm has greatly improved its performance with large datasets.
4) K-means Clustering: K-means clustering is an unsupervised learning algorithm that is used to cluster similar data points together [20]. The raw dataset is analyzed so that centroids are formed based on a given number K, K being the number of clusters that are to be formed from the data. Data points are assigned to clusters based on their similarity to the cluster’s centroid. This algorithm will typically involve a lot of testing to determine the optimal value of the parameter K. K-means clustering is often performed by building the model on a subset of the raw data, called a training dataset, and then testing the algorithm on the remaining data, called the test dataset. Using this methodology of testing and training the algorithm allows researchers to more accurately cluster their data using the optimal value of K.
2.4. Mapping
Mapping is a machine learning technique in which input data is mapped to a category or class. It is a type of Artificial Neural Network (ANN) and can be either supervised or unsupervised.
1) Self Organizing Maps: Self organizing maps, while coming with a set of challenges, offer the great advantage of not needing humans to help them learn. This method is based on unsupervised learning and is a cooperative learning network. Self-organizing maps take high dimensional data and make it low dimensional. The map units are typically thought of as points on a two-dimensional lattice. Neighborhoods are created by identifying sets of points which can be classified into the same class, based on traits and attributes deemed best by the unsupervised learning technique [21].
2) Supervised Mapping: Supervised learning techniques require the use of training data as examples of input – output pairs. These examples allow the method to learn and appropriately classify new inputted data to the appropriate category. Such a technique uses a learning algorithm such as support vector machines, linear or logistic regression, naïve bayes, or linear discriminant analysis to name a few. The performance of the supervised learning technique can be very dependent on which algorithm is chosen to do the classification task [22].
2.5. Statistical Test/Model Validity Methods
Statistical tests use mathematics to determine the relationship between random and nonrandom variables. The random variables do not have a statistical influence on the dataset. Model validation shows the accuracy of the model. There are many methods that can measure the accuracy of a model, such as k-fold cross validation, Wilcoxon signed-rank test, and train/test split. The tests and methods used below were used in the studies observed for this paper.
1) Goodness of Fit: Goodness of fit is a measure between the observed values and the expected values of a model [23]. Goodness of fit describes how well a statistical model fits the dataset presented. It tells how well the sample data represents data in the actual population.
2) Kernel Density Estimation (KDE): The Kernel Density Estimation is a mathematical process of finding an estimated probability density function of a random variable [24]. KDE attempts to make inferences of a population based on a representative data set. The technique creates a smooth curve given a set of data. The estimation can also be used to generate points that look like they were from a dataset, which can help power simulations [24]. The KDE is created by plotting the data and creating a curve of the distribution. The curve is calculated by weighing points at a specific location. When more points are grouped at a location, the estimation is higher because the probability of a point being at that location is higher. The kernel function is used to weigh the points.
3) Precision at Rank k: Precision at k is the proportion of recommended items in the top k-set that are relevant to the number of recommended items [25]. A downfall of precision at k is that it fails to take the position of the recommended items in the top k into consideration.
4) Analysis of Variance (ANOVA): ANOVA is a statistical method that is used to examine differences among variables across two or more categories [26]. In simple terms, ANOVA allows analysts to identify the differences among different groups of variables at the same time. This is a very important technique in the field of social media data mining because it allows researchers to identify the unique relationships that may exist between certain social media users, for example. Furthermore, it allows researchers to then perform further analysis to find the reasonings behind these differences. The result of an ANOVA test is the F-statistic, which allows researchers to analyze the variance that exists among the various groups of data. Using the F-statistic, researchers can see if there is a real variance among groups of data, if true variance does not exist then the F-ratio resulting from the ANOVA test should be close to 1.
2.6. Regression
Regression is a statistical technique used to describe relationships between dependent and independent variables. There are various types of regression, including linear regression, logistic regression and multiple regression. The techniques described below are those used in the studies discussed in this paper.
1) Multiple Regression: Multiple regression is designed to create regression models based on multiple independent variables and a single dependent variable [27]. The model that is created provides the impact that the independent variables have on the dependent variable. It is important to keep the number of variables low because the model becomes more complex as variables are added.
2) Time Series Analysis: Time series analysis consists of taking time series data and trying to find the underlying pattern in the data to extract meaningful statistics or characteristics that would be helpful in forecasting or predicting future values. Various prediction methods exist, and many depend on the acknowledgement of cyclical, periodic, and seasonal behavior that exists in the data [28].
2.7. Research Methods
The research methods discussed in this section are methods used for analysis for various research projects. These methods did not fit into the previous categories of methods defined. Only methods discussed in the observed studies are listed.
1) 5W Method (What, Where, When, Why, Who): The 5W method (What, Where, When, Why, Who) is a general model that can be used to approach a variety of analysis problems [29]. This method works by identifying the main themes related to the problem to be solved. In the field of data mining in social media, we can describe this model in general terms. The What aspect identifies what the problem is, what kind of data are we looking for? The Where aspect identifies where the data is located that we need for analysis. The When aspect identifies when the data of interest is to be collected. The Why aspect identifies why the event of interest occurred. The Who identifies who the social media data is being retrieved from (what users’ posts are we interested in).
2) Inductive Content Analysis: Inductive content analysis is a technique used by researchers when the data of interest is not numeric, such as text data often seen in social media data mining tasks [30]. Researchers use inductive content analysis to identify features and develop theories about their data of interest. The process is inductive in that researchers analyze their dataset to come up with themes and conclusions by repeatedly analyzing their data of interest through a series of repeated steps. A process of inductive content analysis typically begins with the researchers organizing their data through some method such as classification and identifying the unique groups that are formed. These processes are then repeated until the researchers have come up with theories associated with their data that can either be further tested or explained for the purpose of the analysis task at hand.
3) Speeded-Up Robust Features (SURF): SURF is an advanced feature descriptor used to represent photo content [31]. It is a fast and robust algorithm used for feature extraction, feature description and feature matching.
3. Study Summaries
3.1. Crowdsourcing based Timeline Description of Urban Emergency Events using Social Media
A previous study utilized the 5W model in order to crowdsource information on urban emergency events from social media posts [29]. The 5W model consists of describing the what, where, when, who, and why information about the event. This study uses posts from Weibo users to test the effectiveness of their model in providing information on urban emergency events. Weibo is a social media platform, similar to Twitter, which has approximately 500 million users in China. The components of the 5W method are described and generated as follows:
1) What: What is the event that occurred? Generated by analyzing keywords from Weibo user posts, the authors refer to these keywords as “concepts”. For example, if the event we are interested in is a fire, “fire” would be one of the concepts used to identify posts related to that event. Posts that contain these concepts are referred to as “positive samples”.
2) Where: Once the positive samples are identified from the “what” element, spatial information can be extracted from those posts. For example, a post like “I see a fire on Huaihai Road” indicates that there is a fire and where that fire is located. Geographic Information System (GIS) based information from check-in locations can also be utilized to determine the “where”. Two location-based service applications in China, Jiepang and Dianping, allow Weibo users to post their check-in location.
3) When: Determining when the event occurred can be done by determining the earliest time stamp for the posts in the positive sample and the latest time stamp. The first timestamp is referred to as the starting timestamp (ST) and the last timestamp is referred to as the ending timestamp (ET).
4) Who: Weibo posts can identify witnesses of the event and potentially the participator of the event. The witness would be the poster of the Weibo event, and the participator may be revealed from the witness’ post.
5) Why: Posts by Weibo users may reveal why the event occurred, this will often come from posts by news outlets or police departments.
The authors present two case studies, a fire and a hijack situation, to test how the 5W model can be used to gain information on urban emergency events by crowdsourcing social media posts. The authors demonstrated that this model was beneficial in retrieving the needed information concerning each event from Weibo posts. The authors were able to identify relevant posts for each situation, which they called positive samples. These posts were retrieved by searching Weibo posts in the locations of the two events on the days in which the events occurred. From these positive samples, the authors were able to identify what happened (the event of interest), where the event occurred (from location information attached to the posts), when the even occurred (by looking at time stamps related to the posts in the positive samples), who the event affected, and why the event occurred.
The authors conclude that the 5W model was successful in extracting information about the urban emergency events presented in the two case studies. Future applications of this model may involve comparing the effectiveness when applying it to Weibo posts and posts from a different social media platform, such as Twitter or Facebook.
3.2. Mining Social Media Data for Understanding Students’ Learning Experiences
In [32], the study conducted focused on analyzing Twitter posts from engineering students to understand the issues they face in regard to their educational experiences [32]. The model developed was then used to detect student issues in Twitter posts from students at Purdue university. The two main research goals of this study were to analyze social media data for educational purposes using various data mining techniques and qualitative analysis and to analyze Twitter posts from engineering students to understand the issues faced by these students in regard to their educational experience.
The authors began by collecting Twitter posts that used the hashtag “#engineeringProblems” over a time period of 14 months to create their first dataset. The second dataset was created by collecting all Twitter posts that are geo-tagged with the location of Purdue University through a search of the Twitter search API. The Tweets gathered by searching for the hashtag showed that the problems faced by engineering students fall into distinct categories. The authors used a Naïve Bayes classifier to classify the Tweets into their categories. This classifier was then used to classify the Tweets collected from Purdue University to arrange the engineering students’ Tweets into multiple categories based on the issues they were facing. The authors’ multi-label classification model allowed for one Tweet to fall into multiple categories. The researchers found that the main issues faced by engineering students were things like sleep deprivation and lack of study-life balance.
Because the Twitter posts obtained from the hashtag search did not contain pre-defined categories, the authors used inductive content analysis to identify categories within the dataset. The authors were interested in developing categories based on the major issues faced by engineering students. From this inductive content analysis, the authors developed six major classes: heavy study load, lack of social engagement, negative emotion, sleep problems, diversity issues, and others. The authors used multi-label classification so that one Twitter post could fall into more than one of these classes, with the exception of the others class. The Twitter posts were organized into these classes by two researchers, and F1 scores were generated based on how each researcher labeled each post in order to decide on the finalized class assignments. The authors found that the Naïve Bayes classifier was the most effective classification method for their datasets. This classification method was then used to classify the Twitter posts from the Purdue University dataset into the six classes. The authors believe that the methods they have presented here can be applied to other social media platforms, such as Facebook, to further analyze issues faced by students.
3.3. Investigating the impact of social media advertising features on customer purchase intention
Social media ads have become increasingly popular, with companies investing a large amount of money for them. The biggest rationale of choosing social media ads is the idea that they can be customized to the specific individual. For example, based on what users post about, like, and share, advertisers can predict the most relevant ads for the user to see that will result in a sale or a click.
The study lists out two primary questions,
1) What is a suitable conceptual model that could be adopted to provide a clear picture covering the main aspects related to social media advertising?
2) What are the main factors associated with social media advertising that could predict the customer’s purchase intention?
In order to figure out what data need mined, a variety of previous studies were analyzed looking at various factors such as attitude, irritation, informativeness, creativity, and privacy concerns were targeted using platforms such as Facebook, Twitter, and Myspace. Based on customer researchers, they found that there was a strong correlation between the performance expectancy of ads (how well they were geared to individuals) and people’s views on social media advertising [33].
Structural equation modeling was the technique used for analyzing a proposed model based on Cronbach’s alpha value. Some methods used in the analysis of the model was Goodness of Fit Index, the Adjusted Goodness of Fit Index, Normed-Fit Index, Comparative Fit Index, and Root Mean Square Error of Approximation.
A hypothesis test was run on each of the factors to see if they were significant in contributing to the prediction of proper advertisements leading to increased chance of a consumer purchasing using regression analysis. Multicollinearity tests ensured for the multiple regression that the variance inflation factors were not too high. Average variance extracted (AVE) and composite reliability (CR) were additionally tested to make sure they were in their recommended levels.
The research done in this study was able to confirm that being able to identify these characteristics can heavily improve the ability to target customers with appropriate ads. Hence, when mining social media posts in real time these factors are the important aspects to be able to filter out and utilize [33].
3.4. Corpus for Customer Purchase Behavior Prediction in Social Media
One application of making these models was done in a data mining study that analyzed how well iPhone sales could be predicted based on social media data. By analyzing tweet’s such as “I bought an iPhone” and “Checking out the new iPhone”, the corpus collected English tweets related to purchase behavior and then manually recorded if a user purchased a product [34]. After defining key phrases, extracting product details from eBay pages, and analyzing tweets. The proposed methodology by researchers in this type of situation would be to use machine learning to train a classifier on whether a phrasing results in a buy or not.
The corpus created for data mining tasks like this can be automated as much as possible. Examples of automated labeling tasks were provided such as finding the location of users, frequency, and past analysis of the same user. All of these items are believed to enhance a machine learning corpus to provide much more accurate and meaningful results [34].
3.5. Predicting Postpartum Changes in Emotion and Behavior via Social Media
As opposed to being able to help predict marketing and purchasing information, the researchers utilized user data from social media to predict the effect that giving birth would have on a mother. In order to accomplish this, tweets were analyzed for dimensions of social engagement, emotion, social network, and linguistic style [35].
In order to develop a predictive model and sort through the tweets, a two-stage approach was used to construct the sample of new mothers. Twitter being public presents a wide range of challenges because of the number of public posts and ones that may be irrelevant to the predictions being made. To condense the data set, the first strategy was to analyze tweets to find users that appeared to have a recent childbirth in their lives. These remaining individuals served as possible individuals for the sample.
The various factors of engagement, ego-network, emotion, and linguistic style were quantified so they could be rated based on the analysis of the tweets. Since Twitter maintains all of the Tweets from the user since the beginning of the account, the differences in these factors were able to be determined from before the child birth to after the child birth. With the calculations of these differences, groups were formed (extreme-changing mothers and standard-changing mothers) to use in supervised learning techniques.
To avoid overfitting the data, principal component analysis and randomized forest procedures were utilized. Methods such as linear, quadratic, discriminant classifiers, naïve Bayes, k-nearest neighbor, decision trees, and SVM with radial kernels were used in the classification process. Out of all of these, the SVM had the greatest accuracy with using a five-fold cross validation method. Using this methodology, there was a highest point of 80% accuracy on a testing data set of being able to classify new mothers who would experience postpartum depression after giving child birth [35].
3.6. Big data analytics for disaster response and recovery through sentiment T analysis
Big data from Twitter and other social media has been used for many applications, such as healthcare, multi-channel, finance, log analysis, traffic control, homeland security, telecommunications and retail marketing but is only in the early stages for disaster response and recovery [36]. Emergency help related requests during disaster situations rarely use social networks [36]. Because crisis situations are chaotic and disorganized, big data analysis of these data is a good fit for handling the environment. Typically, because of lack of information for the affected team, disaster management teams rely on incomplete or inaccurate information. Big data analytics can assist in getting the right information from large amounts of data, analyzing it and providing results to the disaster management or rescue teams to enable them to make the best course of action.
The authors of this study propose a method to identify a sentiment towards the philanthropic aids received by the people during and after a disaster [36]. While governments typically provide relief, the needs of people are not always met as the need is not always identified. This study uses tweets collected during three disasters to help build a model to meet the needs of those affected. First, the data are analyzed and categorized by the various needs of the people during and after the disaster. Second, various features, such as bag of words, parts of speech-based features, and various lexicon-based features are analyzed and the best performing algorithm in each category is identified [36]. Finally, a visualization method is proposed for the sentiment of the basic needs which would help the emergency responders. In order to provide help to emergency responders, a solution must be built that uses real-time data and analysis to determine the needs of the people during a disaster. The objective of this research is to build a conceptual model for disaster response and recovery by using the best features that classify the disaster data with highest accuracy [36].
The data obtained for this study were obtained for the following disasters: the India-Pakistan floods in September 2014, a seven cyclonic storm named HUDHUD in October 2014 and another seven cyclonic storms named Nilofar. These data were collected from Twitter and contained 70,817 tweets. Part of these tweets were collected from Streaming Twitter API. This API only allows users to collect the past seven days’ data. Since historical data cannot be obtained through this API, the rest of the data was collected using a third-party vendor ‘Followthehashtag’. Keywords used to collect data are as follows: HUDHUD, Vizag flood, Nilofar, Kashmir floods, India-Pakstan floods, Pakistan floods [36]. The data collected for each disaster was collected for a specific time frame: HUHUD and Nilofar were collected from September 5, 2014 to November 15, 2014; Kashmir floods were collected from September 1, 2014 to October 15, 2014.
The preprocessing step is completed so that the machine learning algorithm can interpret the data. Since Twitter data contains Uniform Resource Locators (URLs), numbers, abbreviations, etc., it is important to remove these before performing further steps. The disaster area tweets are categorized by keyword filtering technique, which is common in Twitter analytics. The keywords are selected by identifying words that are used more than five times and also relevant to the category. Two steps are used in the text classification stage, the subjective sentences segregation and feature vector generation. The subjective sentences provide the sentiment related information, while features convert the subjective sentences to feature vectors to be used in the machine learning algorithm [36]. Text is separated into subjective and objective sentences based on the usage of words. The sentiment of people is identified in the subjective sentences. Since separating subjective and objectives is a manual task, tools can be used to automate the process. Publicly available sentiment-based lexicons are used to categorize the subjective sentences. To categorize disaster data, three lexicons were considered for the model, one from Twitter domain (AFINN) and the other lexicons which contain slang words, misspelled words, and morphological variants [36]. The disaster data is filtered with the list of positive and negative words from the lexicons. Anything not classified as positive or negative is removed. Parts of speech (POS) tagging is carried out to filter the adjectives and adverbs from entire streams of tweets. Bag of words (BOW) feature is where the entire text is represented as a list of words. The occurrence of each word is used as a feature in training a classifier [36]. Another feature is combining words. The adjacent two words are the bigram feature; the adjacent three words are the trigram feature. This is extended up to n numbers, so n-gram features to train the classifier. As n increases, the accuracy decreases. While training, the input is limited to the unigram model. Next a machine learning algorithm, support vector machine (SVM) is applied, as previous studies show SVM is the best algorithm for text classification. During preprocessing, the text is converted into a vector which consists of a set of features that represents the corresponding disaster related data [36]. The SVM algorithm then calculates and plots a hyperplane through supervised learning that divides positive and negative texts. The linear kernel was found to provide the best results. The results are evaluated by calculating the precision, recall and F-measure which are the three main metrics for measuring the performance of a classification system [36]. Precision is the percentage of classified text that is relevant. Recall is the fraction of classified text that is retrieved. F-measure is the ratio of the combination of precision and recall [36]. After the data has been classified by the SVM algorithm, the positive and negative words are used to identify the opinion towards each category [36]. Sentiment strength is calculated from these results. In this study, the combination of the subjective phrase and machine learning algorithm with bigram feature presents the best classification accuracy of disaster related data [36].
This study used social media to determine the needs of the affected people and then using sentiment analysis determines if those needs are being met. Various visualizations were used in this paper, including box plots. The visualizations make it easier for emergency management personnel to understand the needs of those affected in order to provide the best assistance. The study also helps connect people who are willing to help with information regarding how they can help. Many times, an unaffected person will offer help, such as clothing or food, but is unsure how to get these to the affected people. The proposed method helps to bring those people together.
3.7. World Cup 2014 in the Twitter World: A big data analysis of sentiments in U.S. sports fans’ tweets
It is indicated in recent social media research that sports fans use social media for a variety of reasons, including emotional response [37]. Present analysis uses big data analysis techniques to analyze sports fans’ emotions and behaviors. The authors propose to use social media responses to measure the emotions and responses to sporting events or television shows [37]. If the results prove to be true, this would indicate that text-analysis is valid based on specific criteria. The authors also examine whether the tweets change with response to the gameplay. This study focused on Twitter data with a location stamp from the United States, although the World Cup took place in Brazil. This ensured the tweets were from users who were not in attendance at the World Cup.
The affective disposition toward a team can range from intense liking to intense disliking [37]. Typically, when a team is doing well, their fans are more likely to show joy or positive emotions. When a team is doing poorly, their fans are more likely to show negative emotions. If a viewer is not a fan of either team, they are typically not emotionally invested in the team and do not show the same emotions as a fan. Research in social media for emotional reasons is limited. Part of the literature review for this study found a survey method that analyzed the why sports fans used social media during sports and found a significant but weak relationship with sports fans’ game enjoyment and their use of social media during mediated games [37]. Typically, emotion behaviors in data are coded by humans. Since social media data is so large, it would be impossible to analyze tweets manually for the number of fans watching a sporting event.
Sentiment analysis has increased over the last decade. Existing methods are based on linguistic resources or machine learning. The more common approach is to use linguistic resources, which uses lists of positive and negative words. This method counts the number of times a word appears which allows it to recognize words with positive polarity (favorable sentiment), negative polarity (unfavorable sentiment) or no polarity (neutral) [37].
This study used a natural experiment approach to monitor U.S. fans’ emotions and reactions during the games when the U.S. National Soccer team competed in the FIFA World Cup 2014. Sentiment analysis was used to examine the emotions manifested in the tweets [37]. Tweets were retrieved using Twitter’s Search API during the 2014 FIFA World Cup. A web crawler was designed to collect and parse English tweets in real time using the following predefined hashtags: #FIFA, #Football, #WorldCup, or #Soccer, ignoring letter case.
Two analysis methods were used for sentiment analysis. First, NRC Word-Emotion Association lexicon was used to measure specific emotions, such as fear, anger, joy, sadness, disgust, surprise, trust and anticipation [37]. The authors used the lexicon words’ frequency to measure the strength of the specific dimension [37]. An R application was used to extract the features from a tweet and create a score by counting the words that matched the eight categories or emotions listed above. Second, the tweets were then analyzed for emoticons expressing the mood with either a 🙁 meaning sadness or 🙂 meaning joy [37].
The findings of this study show that fanship of a team enhances one’s worries and involvement in the game but being a fan of a sport is mainly tied to enjoyment and emotional release (anticipation). The use of big data analysis of the sentiments was as expected and can be reasonably explained [37].
3.8. A context-aware personalized travel recommendation system based on geotagged social media data mining
A previous study focused on using social media data to build a travel recommendation system [38]. The goal of this study was to build a system to recommend travel points of interest in different locations based on data obtained from social media posts previously made by users during previous travels. The idea being that the system can recommend a point of interest to a user in a new travel city, based on the previous points of interest they have visited in other cities. The authors built a system with a variety of functions in order to accomplish their goal of building this travel recommendation system. Their method was tested on the public API of the social media platform Flickr to collect the metadata of 736,383 photos that were taken between January 2001 and July 2011 in six different cities within China.
Geotag information available on the photos allowed the authors to cluster photos together based on location using the P-DBSCAN clustering algorithm. This method worked by clustering photos by location based on a predetermined maximum radius. Once the clusters were created, the authors used term frequency-inverse document frequency to score the location tag of each photo. The higher the score indicates a tag for a more distinctive location. Based on these results, the authors used Google Places to find points of interest associated with each location. The authors then used the timestamps of users’ photos to determine the average time a visitor would spend at each point of interest. Matrices were built to examine the interests of users in each location. The Pearson correlation metric was then used to build a similarity matrix to find similarities among users’ traveling patterns. The authors conclude that the method they have proposed was successful in examining user preferences and correctly suggesting travel points of interest in new cities based on their previous posts and their similarities to other users.
3.9. A Big Analytics Method for Tourist Behaviour Analysis
Big data analysis is lacking in the social media field in relation to decision making, specifically in Tourist Destination (TD) Management. This study focuses on supporting strategic decision-making in this sector because big data analytics has not provided use cases for strategic decision support [31]. TDs are areas of interest within a locality that tourists may visit or participate in sightseeing. Tourists share data via multiple sites: Flickr for photo sharing, YouTube for video sharing, Twitter for immediate response sharing, and Facebook for photo and comment sharing and discussion. These data could provide important information to tourism authorities, although they rarely collect the data. This study uses publicly available geotagged photo data on the photo-sharing site, Flickr.
This study evaluates a method based on unstructured data with meaningful content that is tourist focused. The method used in this study combines text processing, geographical data clustering, visual content processing and time series modeling to address the DMOs decision support needs. The results may provide DMOs with information in forecasting future and seasonal demands of tourism development, management and planning [31].
Textual metadata often contains keywords. These data are usually unstructured, which requires some pre-processing. The authors employed a text processing tool, General Architecture for Text Engineering (GATE). The geographical data clustering step is the next step in the process. Here, the authors aim to identify popular locations for each of the identified tourist interests. A clustering technique, P-DBSCAN, is used to identify popular areas of interest. It includes both the number of tourists that visit the location and the number of photos. This ensures that the identified locations have many visitors.
For each location, tourism managers are interested in the most representative photos for each tourist interest [32]. Representative photos identification was completed in two steps: Visual Content Representation and Kernel Density Estimation. For the visual content representation step, the authors adopted Speeded-Up Robust Features (SURF). A popular approach to represent photo content using local region descriptors is to represent each image as a visual bag of words. The descriptors are first extracted for a large set of local regions extracted from a set of random photos. K-means clustering is then applied to create a visual word vocabulary. Visual words are defined as the center of clusters and the value of k determines the number of visual words available [31]. Kernel Density Estimation (KDA) is then applied. The probability density function is calculated for each photo. The photos with the highest probability density function are considered the representative photos. The theme for each photo collection can be identified by examining the small selection of representative photos.
In order to determine how frequently and how many tourists can be expected to visit in certain months, a time series model is created. Popular fitting functions include linear, exponential, and quadratic types [31]. The mean absolute error (MAE) is used to select the most appropriate model for trend estimation rather than predict the actual value of the time series. A seasonal component is removed from the time series. The trend was modeled using a quadratic function and the seasonal means are calculated by the average of seasonal components for each month.
Those four techniques are combined in the solution artefact to process and analyze different types of data (textual, geographic, photos and time) in order to offer insight into tourist behavior and perceptions. The authors propose using the time-series model to predict tourism demand. The DMO will have insight into tourist interests but also time series trends, including any seasonal trends, which will help with strategic planning and decision-making.
The authors chose to use a representative sample of tourists’ social media data for Melbourne, Australia. Geotagged data was extracted and processed using the techniques already described. These data were extracted from Flickr using its API using the coordinates of a bounding box around Melbourne, Australia (based on the longitude and latitude from Google maps).
Time series models were then built for forecasting future tourist demand in Melbourne. Seasonal mean models were created to determine seasonal patterns. These models help determine seasonal patterns of travel which can be used to determine tourist arrival. This will aid the tourism managers in strategic planning and decision making. These data showed no seasonal pattern for local Australian tourists. The pattern of tourists was different among the groups of data (Australia, Asia, Europe and North America), however was the same within the groups. For example, in North America, the high peak season was between January and March and in November; the low peak season was April through September.
This study automatically detects tourists interests in places and objects [31]. The authors were able to extract meaningful information from the geotagged photos, thus creating a solution that provides DMOs with information to make meaningful decisions based on key patterns and trends in tourist social media data. The full artefact in this study was presented to both academic and industry audiences, which helped improve the design [31]. The authors were also able to test the results of the artefact using not only the Melbourne data but data from other locations. Only data from Melbourne was presented in this study. If a sufficient number of photos are collected, this method proves to be effective for any city.
3.10. Network-Based Modeling and Intelligent Data Mining of Social Media for Improving Care
In [39], the study conducted aimed to analyze forum posts related to cancer treatment to identify positive and negative feedback to the treatments and side effects [39]. This study also aims to identify “influential users” within the forums of interest. Pharmaceutical companies have been tasking their IT departments with using social media data mining techniques to retrieve reviews from patients that have used their medication in order to easily retrieve feedback on their product. Social media data mining in reporting feedback of care can also be used by doctors and patients to improve care. Doctors may use such a system to recommend more effective treatment options and patients can use such a system to see previous feedback on treatment options that have been proposed by their doctors. This task is often completed using patient surveys; however, the authors indicate that social media data mining for this purpose allows for access to more readily available information.
The authors of this study were interested in user feedback of the drug Erlotinib, which is used in the treatment of lung cancer. The authors began this experiment by searching the web for popular cancer forums, specifically those with a significant amount of posts related to lung cancer, four online forums were identified in this step. Within these forums identified, the authors searched for posts specifically related to lung cancer medication and noted that Erlotinib was the most frequently discussed drug. The authors then searched all of the forum posts for common terms related to positive and negative feedback, this was done using a Rapidminer data collection and processing process. The result of this step was a final list of words associated with negative and positive feedback; each word was given a term-frequency-inverse document frequency (TF-IDF) score. The words with the highest TF-IDF scores were tagged using a modified NLTK toolkit in order to add positive tags to negative words and vice versa. For example, for a post that says, “I do not feel great”, a negative tag was added to the word “great”. The authors then removed similar words and words that appeared less than 10 times, the result was a list of 110 words, half of which were positive and the other half being negative.
Another word list was created based on searching all forum posts related to side effects of Erlotinib. In order to identify terms associated with side effects, the authors referred to a vocabulary list from the National Library of Medicine’s Medical Subject Heading. A list of the words related to side effects were then fed into the Radidminer processing tool in order to assign TF-IDF scores to each word. Words with the highest score, that appeared at least 10 times, were kept for the final list of words relating to side effects. The result of these two processes was a dataset of user forum posts which were each transformed into two vectors, one with 110 variables for the TF-IDF scores for the positive/negative terms and another with 10 variables containing the TF-IDF scores for the side effect terms. The vectors were then analyzed for clusters using Self Organizing Maps (SOM). The forum posts were first manually labeled as negative or positive before they were fed into the SOM. The purpose of the SOM step was to analyze the clusters formed, and the weights associated with those clusters, to see if there was a relationship between the clusters identified and the classification of the post being negative or positive.
The next step was to identify those users in the forums that are considered “influential.” This was a topic of interest because these influential users can often drive the opinions of other users within the forum. This process was done using a combination of network-based analysis with a Markov chain modeling the various connections between nodes of the network. The opinions of these influential users were then analyzed to identify them as being negative or positive using a module average opinion (MAO) approach. This formula takes the sum of the TF-IDF scores associated with positive terms, minus the TF-IDF scores of the negative terms, and then divides this difference value by the sum of all TF-IDF scores. Lastly, forum posts related to side effects were identified using the list of side effect terms previously developed. The authors found that most feedback related to the drug was positive. The authors demonstrated that they were successful in identifying “influential users” within the forums. These users were found to interact with other users on the forums very often and that users looked to these influential ones for further information. The authors used t-tests to score the posts associated with side effects, finding that rash and itching were the most frequent side effects reported. The authors summarize that methods similar to these can be used in the future to improve patient care and reduce costs.
3.11. Filtering big data from social media –Building an early warning system for adverse drug reactions
Adverse drug reactions (ADR) are unintended reactions or side effects for a medication. Usually, these are determined during clinical drug testing trials. The World Health Organization (WHO) uses “early warning” systems to monitor ADRs. Usually, the early warning systems are based on feedback from pharmacists and physicians rather than the patient. A growing number of pharmaceutical companies are now allowing consumers to report symptoms directly to them in order to ease legal and monetary implications [40]. Not all countries use consumer reports and even the ones that do have experience a delay in getting consumer reports of serious ADRs. Because of this, a different approach is needed.
Patients have taken to social media to discuss their medication use and experience. This information could be used for healthcare research. The user-generated content (UGC) is an emerging trend of data for early detection of adverse disease events [40]. Users tend to share their perceived risk of an ADR on a social media platform. These data provide an opportunity to mine the data for a relationship between drugs and their interactions. The challenge to this type of data is the messages are usually sparse and highly distributed. It is easy to obtain large amounts of unlabeled social media data, but it is costly and time consuming to manually classify and label the ADR messages to build an early warning system.
The objective of this study was to develop a process to scan large amounts of text-based posts collected from drug-related Web forms. The system will integrate both text and data-mining techniques to extract important text features from the posts and then classify the posts into positive/negative examples based on a few pre-identified ADR related posts. The classification process is based on a partially supervised learning method, which uses a small number of known positive posts to identify other posts of similar text features from a large corpus of unlabeled posts [40]. The results can be used to build an early warning system to assist the Food and Drug Administration and pharmaceutical companies.
Data collection consisted of crawling of Web forums to gather patient posts from social media. This study focused solely on discussion boards, in particular Medhelp, however the method could be expanded to include social media platforms such as Twitter and Facebook. The authors used domain experts to tag a large sample of posts related to the drugs in this study. If any ADR wordings were identified, it was labeled as a positive example; otherwise, it was a negative example.
The Latent Dirichlet allocation (LDA) is applied to construct a topic space over the corpus. It uses a small number of topics to describe a collection of documents. The LDA model reduces the dimensions while maintaining the structure of the document. The authors then used the Gibbs sampling inference algorithm for approximation. During classifier construction, the authors selected reliable positive and negative examples to fit the distribution of the positive and negative classes, respectively.
In order to reduce the diversity of topics, the negative dataset is partitioned into smaller clusters. Here, they used the k-means clustering method. After the negative examples were extracted, they moved to the positive examples. The authors used Support Vector Machines as the text classifier.
Four benchmark methods, Example Adaptation for Text categorization (EAT), Positive examples and Negative examples Labeling Heuristics (PNLH), Active semi-supervised Clustering based Two-stage text Classification (ACTC) and Laplacian SVM, were compared with the method used in this study. The paired-sample Wilcox signed-rank test was applied to assess the statistical significance with respect to the best benchmark method. The approach in this study outperformed the benchmark techniques in most cases.
3.12. Helpfulness of user-generated reviews as a function of review sentiment, product type and information quality
In dealing with data mining, text analysis plays a vital role in filtering through reviews that people write for products to determine if they are useful or not. In this study, a method was developed to model the large amounts of reviews that people post on a daily basis (from sites such as Amazon) to determine which of those reviews are actually helpful.
In order to collect the data, reviews were collected and multiple regression was used to classify reviews as helpful or not. Text analysis revealed that extremely high and extremely low reviews were often over inflated, being based on very individualized experiences that would not help a wider audience. ANOVA served as a statistical measure to analyze the differences between the various categories of review (such as by star rating). Text analysis found that in the majority of cases, the most helpful and detailed information was being found in the 4-2 star rating [41].
Further filtering was able to be performed to determine truly useful features of reviews. Further modeling was performed to be able to factor in product type, which had different factors that impact what reviews are deemed to display quality information. Further considerations in this work can be to put important reviews more accessible to customers or identify fake reviews that are being posted simply to increase or decrease a specific product rating for an online site [41].
4. Overview of Findings
4.1. Social Media Studies
In the paper describing urban emergency event description through social media data mining, the authors developed a simple 5W model to describe the event of interest [29]. This method is very simple in that it only requires searching through public posts within a given location on a certain date range to describe an event that has already occurred. This paper showed how easily information can be extracted from social media posts using basic words to search posts. While this paper develops a user-friendly way to search for social media posts of interest, there are some issues that could arise from this method. For example, if a researcher were to use this information to search for posts related to a fire that occurred in a certain area on a given date, searching for the word “fire” in Weibo posts may result in posts being returned that had this word but that were not related to the event that occurred. While this is still a good method to identify posts of interest, one should be aware that a method would need to be developed to filter-out posts that are irrelevant to the topic of interest. In the future, researchers should come up with an algorithm that can be employed to filter-out posts that are irrelevant to the current topic of interest. Future work involving these methods should also consider that size of the dataset that will need to be searched for relevant posts. In this example, the event was in a specific location. If this model were to be applied to future research that was concerned with a larger geographic location, for example an entire country, additional methods, such as programing, may need to be deployed to efficiently search through social media posts to find those that are of interest.
In the paper which described a system for identifying student experience, the authors used Twitter API search and Naïve Bayes classification to examine the problems faced by engineering students [32]. An easy method of searching for a relevant hashtag within Twitter was implemented. This approach works well for a system like Twitter in which users’ posts very often include hashtags to identify the main themes in the post. The authors showed that the Naive Bayes classifier performed best with their dataset of interest. It is important to test multiple classification methods when analyzing datasets such as this one to find the best method. Future research that involves a similar dataset could use the methods described by these authors to compare if such methods would apply to all Twitter post datasets searching for hashtags of interest, or if the best classification method varies depending on what the resulting dataset is after a Twitter API search. One limitation to this specific approach was that the authors only searched for problems faced by engineering students but did not develop a method to identify positive feelings from engineering students. A collection of data like this may imply that only negative experiences were faced by engineering students. It would’ve been beneficial to compare positive posts from engineering students to learn more about the engineering student experience as a whole. In the future, this same algorithm could be applied to include other social media platforms, such as Facebook, because not all students actively use Twitter. An addition of this experiment should also involve coming up with positive hashtags or terms that would be used to identify posts of engineering students.
While studying “Investigating the impact of social media advertising features on customer purchase intention” it was clear that sites such as Facebook and Twitter performed well for the model [33]. However, the applications of this research were not tested in other social media environments to see if the same results would hold up. One argument for this is the reasoning of why certain personalities gravitate towards specific types of social media platforms. Since much time was devoted to model validity, it would have been worthwhile to explore how well the model did analyzing photo captions on a site such as Twitter, or tying in photo analysis itself. As opposed to just text, video and images on social media could provide an unseen angle as to how customers look at products [33]. As viewed in the introductory section, with all social media platforms experiencing a rise in recent years, further work should be done to view correlations and associations between the various sites to see what behaviors can be seen as a commonality. As the data was collected from a survey of participants, it would be beneficial to anyone using this model to test it against a randomly selected group of individuals from other areas.
Corpus for Customer Purchase Behavior Prediction in Social Media provided insightful methodology of how social media posts could be used to determine if an individual would buy a product based on what they posted [34]. The downfall of this article was that it did not actually create a workable model that could be tested. Therefore, all proposed methodology were based off of other studies and what should theoretically” work and produce the best results (i.e., appropriate classifiers, sentiment analysis procedures, learning methods) without demonstrating that these claims were in fact true. This work does however provide an easy point for new researchers to build off of to help develop a working model. While the article mentions twitter extensively to obtain the data, no reference is mentioned as to how this would actually fully be implemented. Based on other studies, it seems reasonable that Twitter API searches could be implemented to gather tweets that could be fed into this proposed model once it is created [34].
The paper “Predicting Postpartum Changes in Emotion and Behavior via Social Media” provided several different methods of how to classify the data once text analysis was performed. This idea was an extremely highlighting feature of this paper since it involved linear and Quadratic discriminant classifiers, Naïve Bayes, k-nearest neighbor, decision trees, and support vector machines as tested methods. This allowed the reader to confirm the results of several other studies that SVM appeared to be the classification method which yielded the highest success and reliability rate [35]. The paper also shows social media can apply to make predictions about important aspects of people’s lives. While the study focused primarily on Twitter, it would have been beneficial to see if the performance held up over other platforms as well [35]. Extensions in the research could also examine commonalities between the various social media platforms to make extensions on how a model for one social media platform may perform or be adjusted for any of the others. Based on the analysis performed and the more reliable results from the SVM classification method, this should form a good method choice for testing the analysis of text on sites that allow users to be more expansive with their word limits in posts. Additional analysis of the SVM method’s reliability correlated with character length would provide great insight into if SVM is an overall choice for this type of analysis, or if it is the most effective when a stricter character limit is imposed on a user.
In the paper describing a system to perform sentiment analysis in response to disaster responses and recovery, sentiment analysis and SVM were used to create a classification system for social media. These results were presented to emergency responders in a visual form to help understand the needs of those affected [36]. The combination of both sentiment and SVM proved to be an effective method of classification. The method also included bag of words, where the entire text is shown as a list of words. The downfall to this is when taken out of context, the words may seem unimportant but in the full context of a sentence or tweet the word may be very important. Improvements to this study would be to include data from other sources, instead of only Twitter data, as well as considering sentences rather than individual words within tweets to ensure the context is captured properly. Also, particular keywords were provided to extract the appropriate data. Another improvement would be to create an algorithm that monitors Twitter data for an increase in use of a particular word or sentence, as is done with data that is trending in Twitter. The authors suggested future studies could include data from various disasters to improve the accuracy of the model. With multiple social media platforms, extracting data from multiple sources, while complex, could also improve the disaster response models.
In the paper describing a system to analyze sentiments of U.S. sports fans using tweets, sentiment analysis was performed using two methods: NRC Word-Emotion Association and analysis of tweets for emoticons expressing the mood. This study presented results that were expected: a fan’s emotional state during a game is directly related to how well or how poorly their team is performing [37]. A limitation of this study is that a very specific group of fans was analyzed. The study used tweets from US fans that watched the World Cup 2014 from the United States, not in person. The authors assumed that when fans were happy it was because their team was doing well, so their assumption and hypothesis were essentially identical [37]. Data was collected only during the games. An improvement to this study would be to collect tweets from a longer time frame to determine if the users are truly fans of the team or only fans during the particular game evaluated. Additional statistical techniques could be applied, such as SVM, which works well with text classification. Individual words within the tweets were examined, rather than examining the context of a word within a tweet. To improve this method, future research could involve examining the entire tweet to ensure the proper context is examined.
4.2. Photo Sharing Studies
In the paper describing the creation of a travel recommendation system, the authors used a combination of P-DBSCAN clustering and TF-IDF to create a travel recommendation system based on the user’s previous travel data [38]. This system was based on making recommendations for new travel locations based on previous locations the user has traveled to. The authors proved that their method of combining P-DBSCAN clustering and TF-IDF was efficient, and successful, in handling large datasets. With the size of the dataset that this method was tested on, one can assume that the same methods would be successful if an application of this kind were to be available to all social media users when traveling. It is likely these methods would be successful in other recommendation applications that used social media, such as an application to recommend restaurant options in a user’s location. While the methods presented here provide a reliable system to follow to make future recommendations, there is some room for improvement in that the researchers only consider making recommendations for users in which previous data has been supplied. A system such as this would not work for new users because there would be no previous data to go off of. A system such as this one should include an additional feature that new users can use to answer questions based on previous travel that has not been tracked in the travel recommendation system. A questionnaire which identifies previous places the user has traveled to and points of interest visited in those locations would improve the function of the travel system to be more beneficial to new users.
In the paper describing a system defining tourist behavior, the authors used Flickr’s API to export photos and related metadata for analysis. The methods used were General Architecture for Text Engineering (GATE) for text processing, and P-DBSCAN for clustering [31]. P-DBSCAN is used to identify popular tourist areas. Speeded-Up Robust Features (SURF) and Kernel Density Estimation are applied. Time series models were used to determine the future tourist demand and seasonality demands. This system proved to be effective for not only the location analyzed in this study, Melbourne, Australia, but also for other locations if sufficient data is collected [31]. The strength of this study was that the authors incorporated tourist photos, which had not been done in previous studies. One limitation was the metadata for the photos. Complete metadata was not available for all photos extracted from Flickr. Another limitation was only one site was used to extract data. This limits the information to only photos and does not include emotional responses that may be found in other social media, such as tweets. A future recommendation would be to include data from some of the other social media platforms, such as Instagram, Snapchat, Facebook and Twitter to improve recommendations. Multiple types of data could also be analyzed, including photos, videos and status updates. Some users may tag themselves into a location without sharing a photo, making it valuable to collect other types of data. These additional data would likely require adjustments to the model; however, the model would provide a good foundation.
4.3. Medical Forum Studies
In the paper which described a system for improving medical care, the authors use a combination of TF-IDF and self-organizing maps to analyze forum posts within various medical forums [39]. The authors’ model was careful to add negative and positive tags so that these posts were categorized correctly. The authors also identified influential users that could potentially sway the opinions of new users. As shown in the other papers mentioned here, TF-IDF is a common method used when analyzing social media posts, and it has shown to perform well for extracting information of interest. The authors show that the use of self-organizing maps is successful when the goal is not only to find social media posts relevant to your topic of interest, but also to find which users are considered to have influence over other users. One item that the authors did not consider was how long users of the forums may have been taking the drug of interest. It is well known that there is a period of time when a person begins taking a new drug in which their body is adapting to the drug, so some side-effects may be more intense for a period of time in the beginning. An improvement to this system may be to retrieve information on how a users’ post may change over time after they have been taking the drug of interest for a longer period. The same logic would apply to medical treatments that don’t specifically involve drugs, such as a new kind of therapy that a patient is trying.
In the paper describing an early warning system for adverse drug reactions, the authors used Latent Dirichlet Allocation and Support Vector Machines to classify text from Medhelp [40]. Domain experts were used to tag sample posts related to the drugs in this study. If any ADRs were identified, the posts were marked as positive examples; otherwise, they were marked as negative examples. Support Vector Machines are particularly effective in text analysis. LDA performed well against the benchmarks from other studies that were presented in this paper. One limitation to this study is the need to use domain experts to classify posts. When human interaction is needed with big data, the sheer number of posts that can be evaluated is limited. In the future, an improvement could be creating an automated system to evaluate the social media posts rather than relying on a human to interact with the data. This would provide a larger sample of data, and allow the system to react in real-time, or close to real-time. As the authors discussed, an improvement to this model would be to collect from other sources, such as social media posts, rather than just web forums. While this method appeared successful compared with the benchmark methods, it is hard to imagine doing large scale analysis while relying on domain experts to manually review data in order to build a model. Other methods considered as well, since SVM and sentiment analysis were successful in several of the studies observed.
4.4. Product Review Studies
In the paper which described how to build a function to determine the helpfulness of user-generated reviews as a function of review sentiment, product type and information quality, text analysis was relied heavily on to be able to examine reviews [41]. Text analysis is a very big need when collecting data based on what people right. With the number of variables required to take into consideration, multiple regression was selected as the method of analysis with ANOVA being used to analyze the differences in the types of review classifications (such as 1-star, 2-star, etc.). In this text analysis situation, sentiment analysis did not appear. Since the text was already broken down into categories based on how a user rated them, it is interesting to wonder if this is the reason why sentiment analysis never made an appearance. From a classification standpoint, sentiment analysis would likely need to be used to classify them into their rating category, if this step was not already completed. Hence, it would have been an interesting extension if the researchers could have applied this to social media (as other papers) to analyze the mentions of products and then analyze if posts are useful [41]. As the authors only analyzed three product searches and three experience searches, the fact that the helpfulness and quality varied greatly over the review sentiment and product type raises questions of how this methodology would perform if used to model more diverse products.
5. Conclusion
In this paper, we evaluated twelve research papers that explored various data mining techniques for social media data. While many methods were used for analysis, common themes were text analysis, SVM and sentiment analysis. The previous researchers used a variety of methods to extract data, such as using the API for the social media platform. Both the Twitter Search API and the Flickr API were used to extract data in some of the studies. Future recommendations were made for each individual study, sometimes recommending methods that worked particularly well in one of the other papers evaluated. Several of the studies evaluated were similar in theme but did not necessarily use the same types of analysis. All of the methods provided sufficient results for the studies, but it was interesting to look at different methods used for similar studies.
In the study that utilized social media posts to describe emergency events, the 5W method was used. Another study that also used social media for emergency events used sentiment analysis to determine the needs of the affected people. The authors used several algorithms, including SVM and sentiment analysis. Both of these studies had similar goals but very different and effective approaches. This may show that while a particular big data technique may work best in a situation, there are multiple research methods worth testing.
Two studies used proposed methods using Flickr data to provide recommendations to travelers and Travel Destination Management. Both of these studies used P-DBSCAN, but one expanded the recommendations further by analyzing seasonal timeframes of destinations. P-DBSCAN was effective in both of these studies.
The studies that used social media for improving medical care used different methods. The study monitoring feedback of the drug Erlotinib used a combination of TF-IDF and SOM. The study monitoring ADRs used LDA, k-means clustering and SVM as a classifier. Since the methods tested provided sufficient results, it would be worth further study to compare both methods to determine the best approach for using social media to analyze medical data.
Three studies evaluated social media for products. All three used different techniques in data mining. The Goodness of Fit, structured equation modeling and other similar models were used when investigating the impact on purchase intent. The study that focused on predicting iPhone sales proposed using machine learning to train a classifier based on phrasing in social media posts. The final product study focused on the helpfulness of product reviews. Multiple regression and text analysis were used in classifying reviews.
One study used Twitter data to evaluate students’ learning experiences. Naïve Bayes was found to be the most effective classification method.
While all of these studies were based on social media data, they show there many diverse ways to effectively classify and analyze the data.
- Pew Research Center. (2021, April 26). Demographics of Social Media Users and Adoption in the United States. Pew Research Center: Internet, Science & Tech https://www.pewresearch.org/internet/fact-sheet/social-media/?menuItem=ad42e188-04e8-4a3c-87fb-e101714f1651
- M. N. Injadat, F. Salo, and A. B. Nassif, “Data mining techniques in social media: a survey.” Neurocomputing, 214, 2016, doi: 10.1016/j.neucom.2016.06.045.
- Data science & big data analytics: discovering, analyzing, visualizing and presenting data. Wiley, 2015.
- V. Mhaskar, “Measure Search Relevance using NDCG – Know More: T/DG Blog – Digital Thoughts,” Measure Search Relevance using NDCG – Know More | T/DG Blog – Digital Thoughts, 28-Jun-2015. [Online]. Available: https://blog.thedigitalgroup.com/measuring-search-relevance-using-ndcg. [Accessed: 05-Apr-2020].
- S. Gupta, Sentiment Analysis: Concept, Analysis and Applications. 19-Jan-2018. [Online]. Available https://towardsdatascience.com/sentiment-analysis-concept-analysis-and-applications-6c94d6f58c17 . [Accessed: 15-Apr-2020].
- “Text Classification,” MonkeyLearn, 27-Jan-2020. [Online]. Available: https://monkeylearn.com/text-classification/. [Accessed: 15-Apr-2020].
- H. C. Wu, R. W. P. Luk, K. F. Wong, and K. L. Kwok, “Interpreting TF-IDF term weights as making relevance decisions,” ACM Transactions on Information Systems,. 26(3), 1–37, 2008, doi: 10.1145/1361684.1361686..
- “Standard search API – Twitter Developers,” Twitter. [Online]. Available: https://developer.twitter.com/en/docs/tweets/search/api-reference/get-search-tweets. [Accessed: 15-Apr-2020].
- X. Zhang and W.-X. Xiao, “Clustering based two-stage text classification requiring minimal training data,” in 2012 International Conference on Systems and Informatics (ICSAI2012), 2012, doi: 10.1109/ICSAI.2012.6223496.
- S. Shimojo, Web and communication technologies and internet related social issues: proceedings, Springer, 2005.
- “Get Started with GATE (General Architecture for Text Engineering),” WhoIsHostingThis.com, 12-Dec-2018. [Online]. Available: https://www.whoishostingthis.com/resources/gate/. [Accessed: 20-Apr-2020].
- “Linear, Quadratic, and Regularized Discriminant Analysis,” datascienceblog.net: R for Data Science, 30-Nov-2018. [Online]. Available: https://www.datascienceblog.net/post/machine-learning/linear-discriminant-analysis. [Accessed: 05-Apr-2020].
- R. Gandhi, “Support Vector Machine – Introduction to Machine Learning Algorithms,” Medium, 05-Jul-2018. [Online]. Available: https://towardsdatascience.com/support-vector-machine-introduction-to-machine-learning-algorithms-934a444fca47. [Accessed: 15-Apr-2020].
- R. S. Brid, “Decision Trees-A simple way to visualize a decision,” Medium, 26-Oct-2018. [Online]. Available: https://medium.com/greyatom/decision-trees-a-simple-way-to-visualize-a-decision-dc506a403aeb. [Accessed: 20-Apr-2020].
- O. Harrison, “Machine Learning Basics with the K-Nearest Neighbors Algorithm,” Medium, 14-Jul-2019. [Online]. Available: https://towardsdatascience.com/machine-learning-basics-with-the-k-nearest-neighbors-algorithm-6a6e71d01761. [Accessed: 20-Apr-2020].
- J. Bekker and J. Davis, “Learning from positive and unlabeled data: a survey,” Machine Learning, 109, 719-760, Apr. 2020, doi: 10.1007/s10994-020-05877-5.
- K. Baxter, “Similarity Matrix,” Similarity Matrix – an overview | ScienceDirect Topics. [Online]. Available: https://www.sciencedirect.com/topics/computer-science/similarity-matrix. [Accessed: 15-Apr-2020].
- K. S. do Prado, “How DBSCAN works and why should we use it?,” Medium, 03-Jun-2019. [Online]. Available: https://towardsdatascience.com/how-dbscan-works-and-why-should-i-use-it-443b4a191c80. [Accessed: 20-Apr-2020].
- M. M. A. Patwary, D. Palsetia, A. Agrawal, W.-K. Liao, F. Manne, and A. Choudhary, “A new scalable parallel DBSCAN algorithm using the disjoint-set data structure,” 2012 International Conference fo1`r High Performance Computing, Networking, Storage and Analysis, 2012, doi: 10.1109/SC.2012.9.
- M. J. Garbade, “Understanding K-means Clustering in Machine Learning,” Medium, 12-Sep-2018. [Online]. Available: https://towardsdatascience.com/understanding-k-means-clustering-in-machine-learning-6a6e67336aa1. [Accessed: 20-Apr-2020].
- J. Hollmen, Self-Organizing Map (SOM), 08-Mar-1996. [Online]. Available: https://users.ics.aalto.fi/jhollmen/dippa/node9.html. [Accessed: 15-Apr-2020].
- D. Soni, “Supervised vs. Unsupervised Learning,” Medium, 16-Jul-2019. [Online]. Available: https://towardsdatascience.com/supervised-vs-unsupervised-learning-14f68e32ea8d. [Accessed: 15-Apr-2020].
- W. Kenton, “Goodness-Of-Fit Definition,” Investopedia, 29-Jan-2020. [Online]. Available: https://www.investopedia.com/terms/g/goodness-of-fit.asp. [Accessed: 05-Apr-2020].
- “Kernel Density Estimation,” DeepAI, 17-May-2019. [Online]. Available: https://deepai.org/machine-learning-glossary-and-terms/kernel-density-estimation. [Accessed: 05-Apr-2020].
- M. Malaeb, “Recall and Precision at k for Recommender Systems,” Medium, 04-Aug-2019. [Online]. Available: https://medium.com/@m_n_malaeb/recall-and-precision-at-k-for-recommender-systems-618483226c54. [Accessed: 05-Apr-2020].
- W. Kenton, “How Analysis of Variance (ANOVA) Works,” Investopedia, 29-Jan-2020. [Online]. Available: https://www.investopedia.com/terms/a/anova.asp. [Accessed: 20-Apr-2020].
- P. Grant, “Understanding Multiple Regression,” Medium, 23-Mar-2020. [Online]. Available: https://towardsdatascience.com/understanding-multiple-regression-249b16bde83e. [Accessed: 05-Apr-2020].
- “Time Series Analysis,” Statistics Solutions. [Online]. Available: https://www.statisticssolutions.com/time-series-analysis/. [Accessed: 15-Apr-2020].
- Z. Xu et al, “Crowdsourcing based Timeline Description of Urban Emergency Events using Social Media,” International Journal of Ad Hoc and Ubiquitous Computing, 25(1/2), 1, 2017, doi: 10.1504/IJAHUC.2017.083481.
- S. Hall, “What Is Inductive Content Analysis?,” Small Business – Chron.com, 26-Oct-2016. [Online]. Available: https://smallbusiness.chron.com/inductive-content-analysis-24666.html. [Accessed: 20-Apr-2020].
- S. J. Miah, H. Q. Vu, J. Gammack and M McGrath, “A Big Data Analytics Method for Tourist Behavior Analysis,” Information & Management, 54(6), 771-785, 2017, doi: 10.1016/j.im.2016.11.011.
- X. Chen, M. Vorvoreanu, and K. P. Madhavan, “Mining Social Media Data for Understanding Students’ Learning Experiences,” IEEE Transactions on Learning Technologies, 7(3), 246–259, 2014, doi: 10.1109/TLT.2013.2296520.
- A. A. Alalwan, “Investigating the impact of social media advertising features on customer purchase intention,” International Journal of Information Management, 42, 65–77, 2018, doi: 10.1016/j.ijinfomgt.2018.06.001
- S. Sakaki, F. Chen, M. Korpusik, & Y.-Y. Chen, “Corpus for customer purchase behavior prediction in social media,” in Proceedings of the Tenth International Conference on Language Resources and Evaluation (LREC’16), 2976–2980, 2016.
- M. D. Choudhury, S. Counts, and E. Horvitz, “Predicting postpartum changes in emotion and behavior via social media,” in CHI ‘13: Proceedings of the SIGCHI Conference on Human Factors in Computing Systems, 3267-3276, 2013, doi: 10.1145/2470654.2466447
- J. R. Ragini, P. R. Anand and V. Bhaskar, “Big data analytics for disaster response and recovery through sentiment analysis,” International Journal of Information Management, 2018(42), 13-24, 2018, doi: 10.1016/j.ijinfomgt.2018.05.004.
- Y. Yu and X. Wang, “World cup 2014 in the Twitter world: a big data analysis of sentiments in U.S. sports fans’ tweets,” Computers in Human Behavior, 48, 392-400, 2015, doi: 10.1016/j.chb.2015.01.075
- A. Majid, L. Chen, G. Chen, H. T. Mirza, I. Hussain, and J. Woodward, “A context-aware personalized travel recommendation system based on geotagged social media data mining,” International Journal of Geographical Information Science, 27(4), 662–684, 2013, doi: 10.1080/13658816.2012.696649.
- A. Akay, A. Dragomir, and B.-E. Erlandsson, “Network-Based Modeling and Intelligent Data Mining of Social Media for Improving Care,” IEEE Journal of Biomedical and Health Informatics, 19(1), 210–218, 2015, doi: 10.1109/JBHI.2014.2336251.
- M. Yang, M. Kiang and W. Shang, “Filtering big data from social media – Building an early warning system for adverse drug reactions,” Journal of Biomedical Informatics, 54, 230-240, 2015, doi: 10.1016/j.jbi.2015.01.011.
- A. Y. Chua, & S. Banerjee, “Helpfulness of user-generated reviews as a function of review sentiment, product type and information quality,” Computers in Human Behavior, 54, 547–554, 2016, doi: 10.1016/j.chb.2015.08.057.