Effectiveness and Suitability of the Automotive EHPS Software Reliability and Testing

Adv. Sci. Technol. Eng. Syst. J. 6(3), 205–212 (2021);
 DOI: 10.25046/aj060323
The effectiveness and suitability for the reliability and test of the embedded software of the automotive EHPS (Electrical Hydraulic Power Steering) pump are extensively explored in this paper. The Crow-AMSAA analysis has been applied to evaluate the embedded software reliability growth based on the failure data collected in the prototype phase and in the field. The slope β of the Crow-AMSAA plot is smaller than 1 which indicates that the reliability of the embedded software is increasing and failure rate is decreasing. The field performance and reliability of the embedded software, which is the key indicator to evaluate the effectiveness and suitability of the reliability management and testing methods used in design and development, are also summarized in this paper. Using the real field and zero mileage data to evaluate the effectiveness and suitability of DFR (Design for Reliability) is also beneficial for the company to make the continuous improvement for the future embedded system/software design and development.
1. Introduction
This paper is an extension of work originally presented in paper entitled “An Automotive EHPS Software Reliability and Testing” that was published in 2020 Annual Reliability and Maintainability Symposium (RAMS) [1]. The previous paper was addressing the methodologies for Design for Reliability (DFR) and testing of the embedded software. This paper is using the data collected in the prototype build and in the field to address the reliability growth, the effectiveness and suitability of the reliability management and testing which were used in design and development. (Figure 1 shows the scopes of these two papers).
The vehicle steering system consists of steering wheel, column, EHPS pump, steering gear, pipes, and linkage etc.. EHPS pump has a hydraulic pump, BLDC (brushless direct current) motor, and ECU (electronic control unit). The hydraulic pump is driven by an electrical motor, and motor is controlled by ECU. EHPS pump provides the hydraulic flow to the steering gear in the power steering system. The control software is embedded in the MCU (Microcontroller Unit). (Figure 2 shows the EHPS pump and its interface).
1.1. Advantage of EHPS pump
Comparing to the conventional engine belt driven hydraulic power steering pump, the EHPS pump is powered by vehicle alternator and controlled on demand by the algorithm, the conventional engine belt driven hydraulic power steering pump operates continuously while the engine is powered. The EHPS pump provides 70% energy saving over a comparable conventional power steering pump with constant displacement volume.
- Control Software of EHPS pump
Control software quality is the key for providing reliable and safe power steering system operations. The application of systematic processes and techniques ensures software reliability. This includes the DFR (Design for Reliability), component and sub-system level reliability test, vehicle level test, and feedback from the field during development and the life of the product. The quality of the control software is also a concern for the OEMs (Original Equipment Manufacturer). In [2], the author illustrated the embedded software in crisis with examples from the automotive industry. In [3], the authors edited the Automotive Embedded Systems Handbook which provides an introduction and the scientific challenges to the automotive embedded system. The dependability and performance of an embedded system is also depending on communication networks and protocols. Hence, certain characteristics on communication network have to be verified. In our case, the CAN (Controller Area Network) communication is used.
In addition to applying the DFR and testing methodologies in the software design and development, the effectiveness and suitability of DFR and testing of the embedded software need be evaluated [Figure 1].
Literature review
In [4], the author stated that software reliability is different from hardware reliability, it does not follow bathtub curve, it follows revised bathtub curve (shark teeth curve). This matched our experience when new features were added in earlier prototypes. During development, we placed a strong emphasis on regression testing. In [5], the authors described the enormous potential for defect prevention that can be achieved before the software is even tested. We saw that the quality difference between the concept prototypes and the production software which used different processes. Our evaluation is ongoing regarding the use of identical processes for concept prototypes and production software. The ASPICE process [6] matches [7] which proposed the software reliability assurance approach during its life cycle, and in [8] the authors is to address the software complexity. In [9], the authors presented a new embedded software reliability growth model. We are still evaluating the most practical calculations for future projects. In [10], the author proposed a verification strategy which enhances the effectiveness of integration testing of the distributed software functions. In [11], the author described the organization to adapt the standard classification scheme to and describes a methodology for comprehensively evaluating defect classification schemes. In [12], the authors describes the impact of strategical decisions on the software quality. In [13], the authors described the model based verification for embedded software. In [14], the authors introduced a method for constructing a software reliability evaluation framework based on historical data. They establish a software reliability evaluation model based on code metrics. In [15] proposed two approaches to use metric to analyze the large amount of measurement data generated during the software development process. In [16], the author proposed a technique to guide for the selection of an appropriate software reliability model for an ongoing software development project. In [17], the authors performed a review of currently available quantitative software reliability methods. In [18], the authors proposed a hazard-based effect analysis method to assess the distribution of the hazard degree of a remaining requirements fault. In [19], the authors described that the full automation of evolutionary testing method can improve the effectiveness and efficiency of the test process.
We apply the Crow-AMSAA (CA) model and field return data analysis methods to evaluate the effectiveness and suitability of the software reliability. The advantage of our methods is to use the system level or field failures on the vehicle to assess the component level embedded software reliability.
The CA and field data analysis methodologies are introduced in section 2. The data analysis of CA and field data is described in section 3. The lessons learned and effectiveness of DFR methods are also summarized in section 3. In section 4, the lessons learned and effectiveness of the testing are summarized. Finally, the work of this paper is summarized in section 5.
2. Methodologies
2.1. Crow-AMSAA Reliability Growth
Dr. Crow proposed that the Duane model can be represented as non-homogeneous Poisson process (NHPP) model under Weibull intensity function ([20], [21], [22]).
When CA model applies, the cumulative failure N(t) can be calculated as following
 Where t is the time in days, λ and β are constants, the scale parameter, λ, is the intercept on the y axis of N(t) when t =1, (ln(1) =0); the slope β, is interpreted in a similar manner as a Weibull plot, If the slope β > 1, the failure rate is increasing, the failure rate is more rapid, if the slope β < 1, the failure rate is decreasing, the failure rate is slower, if the slope β = 1, the process is named the Homogenous Poisson Process (HPP), if the slope β is not equal 1, the process is called Non Homogenous Poisson Process (NHPP). ([20], [21]). Weibull plot is for single failure mode, but CA model is for mixing failure modes.
IEC (International Electrotechnical Commission) MLE (Maximum Likelihood Estimation) solutions for interval or grouped data method is used for the fitting method in CA analysis ([23]). Using IEC 61164 methods, the Cramer-Von Mises statistic accepts the goodness of fit at a Fit-p% of 10% as indicated on the plots.
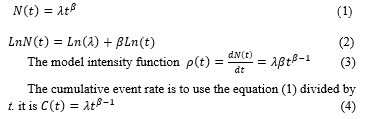
Based on the equation (1) and (2) above, the cumulative failures versus the cumulative days are used for CA analysis. We also apply the CA model to the cumulative quantities delivered in addition to the cumulative days for the failure event, the equation is as
![]() here q(t) is the cumulative quantities delivered.
here q(t) is the cumulative quantities delivered.
The cumulative reliability R(t) is calculated as following:
 We also apply the CA plot to the cumulative reliability versus the cumulative days.
2.2. Field Data Approach
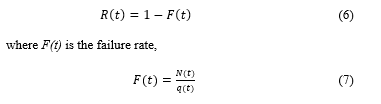
Not all the defects, faults and errors can be detected during software and system design and development. The field performance and reliability data has been collected and analyzed for this automotive EHPS pump. The product has been in the production for more than three years, we have sufficient data from the field (zero mileage [Table 1] and warranty [Figure 7,8,9,10]). The field complaints can be categorized to the following: supplier design manufacturing issue (SDMI), adjoining components’ failure, and misdiagnosis by servicers [Figure 8]. The real root cause of the EHPS pump failures from warranty is listed in the Figure 10. Since the EHPS pump is an electrical mechanical/hydraulic component on the vehicle, we need determine the root cause by mechanical-hydraulic (pump), electrical-mechanical (BLDC motor), electronic and embedded software (ECU). The failure rate and reliability of embedded software are calculated by using the following formulas
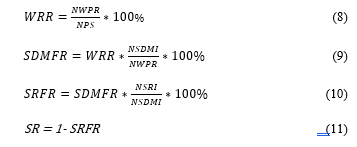 where WRR is the warranty return rate. NWPR is the number of warranty parts replaced. NPS is the number of parts sold. NSDMI is the number of supplier design manufacturing issue. SDMFR is the supplier design manufacturing failure rate. NSRI is the number of software related issue. SRFR is the software related failure rate. SR is the software reliability.
The failures detected in the field can be traced back, and can be used to analyze the effectiveness and suitability for the reliability management and testing in design and development. The lessons learned is also beneficial for the future embedded software projects.
The aim of this paper is to assess the achievements, and to list all the anomalies found in the field, and to illustrate the effectiveness and suitability for all the methods listed in the previous 2020 RAMS paper [1].
3. Effectiveness and suitability for Design for Reliability
The CA software reliability growth is analyzed by using EHPS pump failure data. The following describes the embedded software reliability growth, the effectiveness and suitability by using ASPICE[6] design and development process.
3.1. Crow-AMSAA Data Analysis
The EHPS pump failure data has been collected since beginning of developing this project starting on 1/20/2014. There are four phases in this project: Phase I – Prototype, Phase II – Design Verification (DV) 1, Phase III –DV2 & Production Validation (PV), Phase IV – Production. The system failures and customer returns were counted at different phases. The root causes of the failures have been investigated and documented in the 8Ds (8 Disciplines). The failures which caused by the embedded software were recorded separately. The time period of different phases, the cumulated days, the cumulative quantities delivered, the cumulative failures (due to software) and the cumulative reliability are summarized in the Table 2. The SuperSmith package (developed by Fulton Findings) was used for CA plots.
The CA analysis has been conducted for the cumulative failures (due to software) versus the cumulative days, and plotted in Figure 3. From the plot, the β value is 0.415 which is smaller than 1. Thus the failure rate (due to embedded software) is decreasing, the embedded software reliability is growing as the timing cumulated.
The CA analysis has been conducted for the cumulative failures (due to software) versus the cumulative quantity delivered, and plotted in Figure 4. From the plot, the β value is 0.085 which is smaller than 1. Thus the failure rate (due to embedded software) is decreasing, the embedded software reliability is growing as large quantities delivered to customer.
The total software reliability versus the cumulative days was plotted in CA format in Figure 5 and 6. Figure 5 is normal plot without the log-log, but Figure 6 is the log-log plot. From the plots, the overall reliability change by time is demonstrated. The slope (β1= 0.422) indicates the embedded software reliability change rate while the timing cumulated.
3.2. The effectiveness of understanding the requirements
Based on the zero mileage, warranty data and frequent DCRs (Design Change Request), the following statements are applying to the effectiveness and suitability of understanding the requirements.
- Up to now, we have shipped roughly more than 600,000 EHPS pumps to our customers. The WRR is 0.1% (equation 8) (the 07% is replaced after misdiagnosis by servicers, only 0.03% (equation 9) is EHPS pump related issue, only about 0.0025% (equation 10) may be embedded software related). From the warranty data, we can see the customer original requirements were well understood and implemented in EHPS pump system and software design and development. The misdiagnosis by servicers (about 71%) is a big concern, this was caused by the vehicle system level issues, or the other adjoining components with EHPS pump [Figure 9,10]. For example, for the sake of the safety concern, if the EHPS does not receive CAN communication from the controlling stability and braking module, the EHPS must shut down. But this requirement would make the end driver with no power steering assist when losing CAN communication but no information on the instrument panel. Consequently, the EHPS pump had replaced unnecessarily in warranty, and EHPS pump reliability score had been decreased because of this requirement.
- There are dozens of power circuitry failures [Figure 9] (about 5% of warranty returns) and majority of these cases were caused by the high current on the vehicle. This is a vehicle system issue, and the requirements were not clearly defined by the OEMs. That means the situation on the vehicle which could have the high current can damage the ECU of EHPS pump, and the EHPS control software needs protect the power circuitry in EHPS ECU in that situation. But unfortunately the situation and condition is not clearly defined yet.
- The zero mileage issues: (a) Un-necessary ignition startup/run DTC (Diagnostics Trouble Code) issue implies that the customer requirement especially in the OEMs manufacturing site was not discussed and understood. This is a lessons learned for the future embedded software design and development. In addition to the requirement from different stakeholders, the OEMs vehicle assembly requirements must be understood and implemented; (b) As we found in the warranty, there are power circuitry failures in zero mileage as well. These may be related to the high current spike situation on the vehicle as well.
- Almost all the OEMs would request software changes, and we have received dozens of DCRs for all our supplied pumps after starting the productions. DCRs had significant impacts on the final software. They changed the pump speed maps and fan motor speeds. These reflect the differences between the real data collected in the field and the original customer requirements. The EHPS software was designed to adapt to changed requirements.
3.3. The effectiveness of developing the embedded software requirements & reliability goals
According to the field data, the requirements of the embedded software of the EHPS pump were carried over very well from vehicle and system requirements, but some of the vehicle system requirements (section 3.2) were not well defined which caused the lacking of the embedded software and system requirements of EHPS pump. The reliability of the embedded software of the EHPS pump SR is 1-0.0025%=99.9975% (equation 11), this indicates the performance of the embedded software in the field is excellent.
3.4. The effectiveness of designing the system architecture
According to the field data, the DTCs such as ignition start up/run had not well defined in the system and software design. This was caused by the lacking of understanding of the vehicle requirements in OEMs and their assembly plants. Also the power circuitry issues (both zero mileage and warranty) were not well understood and calibrated between hardware and software. These issues need be considered further in future embedded software design and development.
3.5. The effectiveness of fault tree and design failure mode effect analysis (DFMEA)
According to the zero mileage and warranty issue, we realize we need a vehicle/system DFMEA and fault tree analysis to catch the potential failure modes at the vehicle/system level. In this way, it would prevent a lot of vehicle/system level zero mileage and warranty issues (CAN bus short, loss CAN communication etc.). This vehicles/system fault or failure modes analysis could be done by OEMs engineers. Dare Auto system engineers need contact OEMs engineers to prevent this kind of vehicle/system level issue. Because of the vehicle/system CAN bus issues, the EHPS pumps were replaced without any sympathy since the driver feels there is non-assist from power steering. The EHPS pump is the victim of the “shut off the pump” requirement when the CAN is off (section 3.2).
Also the accuracy of the zero angle issues happened dozens of time during EHPS pump assembly. This caused the current and pump RPM were not accurate and out of the specification. The anomaly which we have experienced is to find the accurate zero-angle for the BLDC motor after motor assembly. This is caused by using a universal controller after motor assembly to find the zero angle, but after the whole EHPS assembly, the zero angle was changed since the new controller and motor are assembled together. In our software/system DFMEA and manufacturing PFMEA development, we need consider the accuracy of the parameters such as zero angle which could cause the performance degradant of EHPS pump. Hence we need require the motor/pump manufacturing to design and implement the correct processes in order to achieve the accurate parameters.
3.6. Software Reliability Growth & design change
We track the software reliability by using the software reliability growth matrix and four different levels of testing (Figure 11). The reliability performance of the embedded software in the zero mileage and warranty needs be updated in the reliability growth matrix. This will help us for future embedded software motor control project.
When we launched this product, the thorough reliability test had been performed in different design and development both in component and system level. Therefore, the software remained stable and without issues for a year. The software reliability is decreased when the OEMs requests a change. Generally, the software reliability after a change follows the shark teeth curve, not the bathtub curve [4]. After the first DCR, the software is considered suspect until its reliability is proven. For example, the OEMs requested a change in the DTC after the launch. Although, the DCR was successfully developed and validated according to our process, the requested change was found to be somewhat incompatible with the OEMs production line equipment. Under certain conditions at the factory, the DTC was set. The OEMs plant could not control the environment. This negatively impacted our reliability score. The lesson learned for the above issue is to certify the software only after the completion of the PER (Production Evaluation Run) at the OEMs factory.
Due to the customer requirements changes for the pump speed maps and fan motor speed requirements which mentioned in section 3.2, we had dozens of DCRs from customers for the software changes. One lessons learned is to cascade the customer CNs (change notice) to the cross functional team, the kickoff meeting is necessary to let every team members to understand the change request, and to implement it and validate it without any discrepancy.
4. Effectiveness and suitability of testing
4.1. Effectiveness of the component testing
As mentioned in section 3.2, some of the OEMs requirements were not clearly defined, this caused some of the system and software requirements were not well defined, hence the architecture design/coding and component testing were not well implemented.
4.2. Effectiveness of the SW integration testing
The comments of the effectiveness and suitability is the same as section 4.1.
4.3. The effectiveness of the sub-system level testing
The key output for the EHPS pump is to output the flow at a given pressure and pump speed. Each time we have the software release, we conduct the 5 points testing, the mapping test and pump bench testing (pressure vs. flow). The 5 points testing is described in the table below (Table 3). We also called the sub-system testing as “EHPS pump on the bench” test.
According to the zero mileage and warranty data, the simulated DTC code testing and the simulated CAN communication situation need be tested more at the system level. These need happen at EOL (end of line) test and system bench test. We have more work to do to define how we can simulated these testing without a vehicle in future.
4.4. The effectiveness of the vehicle level testing
A CAN bus is a robust vehicle bus standard designed to allow microcontrollers and devices to communicate with each other in applications without a host computer. It is a message-based protocol.
Without vehicle, it can only simulated the CAN message testing on the bench. But we do not have other electrical components on vehicle to communicate with. So the vehicle is needed in order to fully test the CAN network and communication timing. Some examples of tests include:
- CAN bus short
- Sleep/Wake up cycles
It is obvious that vehicle level CAN communication and electrical component harmony testing are needed according to the zero mileage and warranty data. 71% EHPS pump replaced after warranty misdiagnosis by servicers is not acceptable due to the system or adjoining component related issues. The CAN and power mating connectors testing are needed before starting the production. In order to reduce the unnecessary cost of the warranty, the vehicle level test need be performed more by OEMs before starting the production.
5. Conclusion
The embedded software of the EHPS pump reliability growth has been modeled by using Crow-AMSAA method both in the cumulative timing and in the cumulative qualities delivered. The slope β value is < 1 which means the failure rate is decreasing and the embedded software reliability is growing.
Based on zero mileage and warranty performance & reliability data of the EHPS pump, the effectiveness and suitability of the reliability and test of the embedded software have been discussed in this paper. This is an extension of the 2020 RAMS paper [1]. Using the real field data to evaluate the effectiveness and suitability of ASPICE DFR is beneficial for the future embedded software/system design and development. The lessons learned have been documented and evaluated to improve the software reliability management and test processes. The ASPICE processes require the organization to collect the data to evaluate the effectiveness and suitability of each process. This paper summarizes the findings.
The main lesson is that the proper operations of the EHPS depend on the vehicle systems where it is installed. Our engineering staff need to involve the OEM’s system engineering and service staff in order to prevent misdiagnosis of issues in the field that lead to unnecessary replacement of the properly operating units in the field.
As expected, the OEMs issue the change requests after the units have been in the field. The flexibility of the software and the regression testing reduce the occurrence of the shark tooth defects.
In summary, the paper is about the reliability of the EHPS pump software. Through multi-staged /multi-facet software testing procedures and methodologies, the zero-mileage failure rate of software has been significantly dropped. The rate has been dropped about 80%. The zero-mileage issues are due to the failure of the process principally, (a) Incorrect software version loaded, (b) Incorrect calibration, (c) Incorrect process at the OEMs plant. The warranty issues are caused by mismatch of the specified behavior versus the real world conditions and the incorrect service instructions.
Table 1: List of zero mileage issues
| Zero Mileage issues | Total |
| Unnecessary DTCs | 10+ |
| Power circuitry failures | 2 |
| Coupler broken | 1 |
| Inlet blockage | 1 |
| Residual oil | 10+ |
| Oil cap damaged | 10+ |
| Repeated bar code | 4 |
| Connector pin damaged | 10+ |
| Noise pump | 2 |
| Missing screws | 2 |
Table 2: System failures due to software at different phases. The cumulative timing (total days), the cumulative quantities delivered, cumulative failures (due to the software) and cumulative reliability are documented in this table.
| Period | Cum
Days |
Cum
Quant Delivers |
Cum
Fail. |
Cum Reliability | ||
| Starting | Ending | |||||
| I | 1/20/2014 | 3/2/2015 | 406 | 168 | 32 | 0.809524
|
| II | 3/3/2015 | 4/29/2016 | 830 | 586 | 44 | 0.924915
|
| III | 4/30/2016 | 11/1/2017 | 1381 | 1964 | 49 | 0.975051
|
| IV | 11/2/2017 | 3/27/2021 | 2623 | 601964 | 69 | 0.999885
|
Table 3: 5 points test
| Function and Performance 5 Points Test | |||
|
T low (-40°C) |
T normal (23°C) | T high (105°C) | |
| V low (9V) | (5) | (5) | |
| V normal (13.5V) | (5) | ||
| V high (16V) | (5) | (5) | |
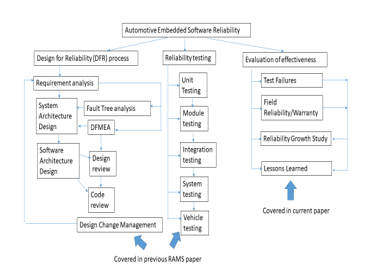 Figure 1: Flow chart of methods for automotive embedded software reliability. The DFR process and reliability testing were covered in previous RAMS paper. The evaluation of effectiveness is covered in current paper
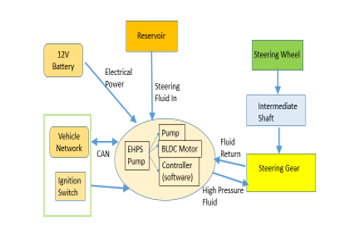 Figure 2: EHPS pump and its interface
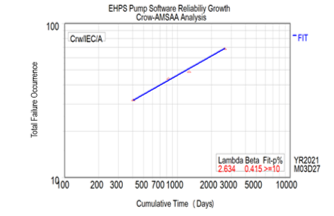 Figure 3: Crow-AMSAA Analysis (total failures vs. total days). The X axis is the total accumulative days since the project starting. The Y axis is the total accumulative occurrence of failures (due to software).
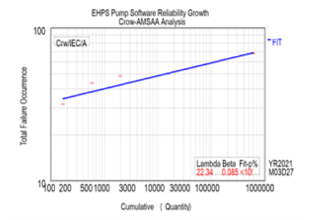 Figure 4: Crow-AMSAA Analysis (total failures vs. total quantities). The X axis is the total accumulative quantities delivered since the project starting. The Y axis is the total accumulative occurrence of failures (due to the software).
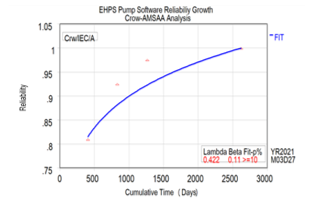 Figure 5: Crow-AMSAA Analysis (total reliability vs. total days). The X axis is the total accumulative days since the project starting. The Y axis is the total software reliability. (This is not the log to log plot).
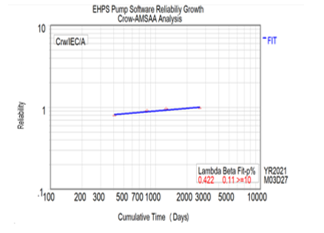 Figure 6: Crow-AMSAA Analysis (total reliability vs. total days). The X axis is the total accumulative days since the project starting. The Y axis is the total software reliability. (This is the log to log plot).
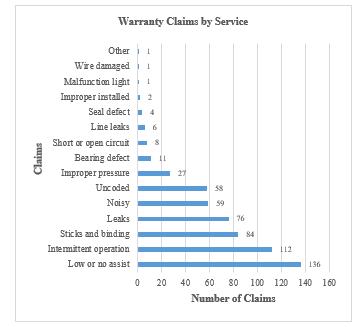 Figure 7: EHPS pump warranty complains by customer
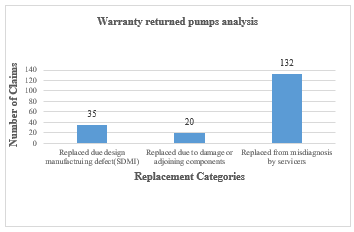 Figure 8: EHPS pump warranty replacement categories
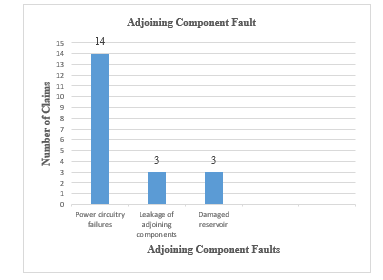 Figure 9: Warranty adjoining component faults
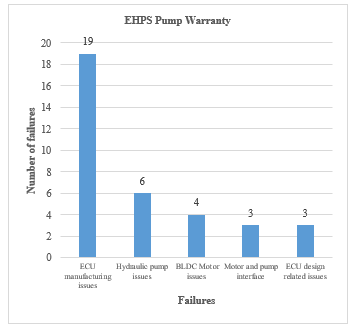 Figure 10: Total EHPS pump supplier design manufacturing issues
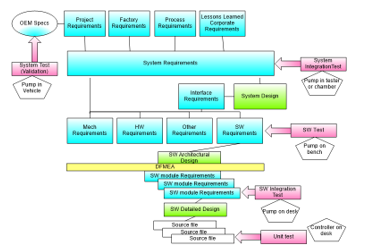 Figure 11: Requirements vs. test
Conflict of Interest
The authors declare no conflict of interest.
Acknowledgment
Thanks to the colleagues at Dare Auto Inc. in EHPS pump team for providing the data and implementing the embedded software, ECU, BLDC and pump. Also, thanks to the reviewers of the ASTES Journal for valuable advices for this paper.
- Y. Wang, J. J. Yang and N. M. Mbiye, “An Automotive EHPS Software Reliability and Testing,” 2020 Annual Reliability and Maintainability Symposium (RAMS), Palm Springs, CA, USA, 2020, pp. 1-6, doi: 10.1109/RAMS48030.2020.9153725.
- M. Wolf, “Embedded Software in Crisis,” in Computer, vol. 49, no. 1, pp. 88-90, Jan. 2016, doi: 10.1109/MC.2016.18.
- N. Navet, F. Simonot-Lion, (Editors) “Automotive Embedded Systems Handbook, CRC Press , 2009 by Taylor & Francis Group, LLC.
- J. Pan, “Software Reliability,” Carnegie Mellon University, 18-849 Dependable Embedded Systems, Spring 1999, https://users.ece.cmu.edu/~koopman/des_s99/sw_reliability/index.html
- M. Silverman,”Software Design for Reliability,” George de La Fuente, Ops A La Carte LLC, 2008 Annual Reliability and Maintainability Symposium (RAMS).
- VDA QMC Working Group 13 / Automotive SIG, “Automotive SPICE Process Assessment / Reference Model”, Version: 3.1, Date: 2017-11-01, Revision ID: 656, http://www.automotivespice.com/
- Y. Shi, P. Kalia, J. Evans, A. DiVenti, “An integrated life cycle-based software reliability assurance approach for NASA projects,” 2010 Annual Reliability and Maintainability Symposium (RAMS).
- S. Saxena1, D. Agarwal, “A Systematic Literature Review on Software Reliability Estimation Model for Measuring the Effectiveness of Object Oriented Design,” 2017 International Journal of Advanced Research in Computer and Communication Engineering, ISO 3297:2007, Certified Vol. 6, Issue 6, June 2017, doi:10.17148/IJARCCE.2017.6671
- R. K. Sharma, A. Kumar, “Analysis of Various Software Reliability Models and Proposing a New Model of Software Reliability for Embedded Systems,” International Journal of Innovative Research in Computer Science & Technology (IJIRCST) ISSN: 2347-5552, Volume-5, Issue-3, May 2017 DOI: 10.21276/ijircst.2017.5.3.6
- A. Chunduri, “An Effective Verification Strategy for Testing Distributed Automotive Embedded Software Functions,” Master of Science, Faculty of Computing Blekinge Institute of Technology, SE–371 79 Karlskrona, Sweden, 2016. Thesis no: MSSE-2016-08
- N. Mellegard, “Improving defect management in automotive software development,” Ph.D thesis, Department of Computer Science and Engineering, Division of Software Engineering, Chalmers University of Technology | University of Gothenburg, Göteborg, Sweden 2013.
- C. Kugler, S. Kowalewski, J. Richenhagen, R. Maquet, A. Schloßer (2017) “Metrics-based strategies for quality assurance of automotive embedded software.” In: Bargende M., Reuss HC., Wiedemann J. (eds) 17. Internationales Stuttgarter Symposium. Proceedings. Springer Vieweg, Wiesbaden. https://doi.org/10.1007/978-3-658-16988-6_56, First Online08 April 2017, DOIhttps://doi.org/10.1007/978-3-658-16988-6_56
- H. Shokry and M. Hinchey, “Model-based verification of embedded software,” Lero—the Irish Software Engineering Research Centre, Published by the IEEE Computer Society APRIL 2009, DOI:10.1109/MC.2009.125, Corpus ID: 17393996
- Z. Song, Y. Wang, P. Zong, L. Wang, G. Feng, and W. Kang, “An Empirical Study of Comparison of Code Metric Aggregation Methods and Software Reliability Evaluation,” 2020 Annual Reliability and Maintainability Symposium (RAMS), Palm Springs, CA, USA, 2020, DOI: 10.1109/RAMS48030.2020.9153606
- S. Dahab, E. Silva, S. Maag, A. S. Cavalli and W. Mallouli, “Enhancing Software Development Process Quality based on Metrics Correlation and Suggestion,” In Proceedings of the 13th International Conference on Software Technologies (ICSOFT 2018), pages 120-131, DOI:10.5220/0006856501540165
- N. Miglani, “On the Choice of an Appropriate Software Reliability Growth Model,” International Journal of Computer Applications (0975 – 8887), Volume 87 – No.9, February 2014, DOI:10.5120/15237-3772
- T. Chu, M. Yue, G. Martinez-Guridi, and J. Lehner, “Review of Quantitative Software Reliability Methods,” Brookhaven National Laboratory Letter Report, Digital System Software PRA, JCN N-6725,September 2010
- B. Li, C. Smidts, “Effects Assessment for Requirements Faults of Safety Critical Software in Nuclear Industry,” 2020 Annual Reliability and Maintainability Symposium (RAMS), Palm Springs, CA, USA, 2020. DOI: 10.1109/RAMS48030.2020.9153594
- H. Sthamer, J. Wegener and A, Baresel, “Using Evolutionary Testing to improve Efficiency and Quality in Software Testing,” 2002 In Proceedings of the 2nd Asia-Pacific Conference on Software Testing Analysis and Review (AsiaSTAR)
- L. H. Crow, “Reliability Growth Planning, Analysis and Management,” Tutorial, 2011 Annual Reliability and Maintainability Symposium
- R. B. Abernethy, “The New Weibull Handbook,” Fifth Addition, , 2006
- D. E. Tananko, “Practical Guide to Reliability Growth Analysis,.” Tutorial at 2020 Annual Reliability and Maintainability Symposium, Palm Springs, CA, USA, 2020,
- IEC 61164 Ed. 2.0 en:2004, “Reliability growth – Statistical test and estimation methods,” International Electrotechnical Commission, 2004.