Estimation of Land Degradation Loss by Water Erosion: Case of the Site of Biological and Ecological Interest of Ain Asmama (Western High Atlas, Morocco)
 , Said Moukrim 2, Said Lahssini 3, Said Laaribya 4, Hicham Mharzi Alaoui 5, Jamal Hallam* 6
Adv. Sci. Technol. Eng. Syst. J. 6(3), 241–247 (2021);
 DOI: 10.25046/aj060326
Erosion affects large parts of Moroccan land, particularly in the mountains leading to soil quality deterioration and less vegetation cover. Located in the South-west of Morocco, the Site of Biological and Ecological Interest (SBEI) of Ain Asmama, where erosion threatens a major part of the region was investigated. The site has a terraced transitional bioclimate, between arid to sub-humid, of local conservation importance. The varied, dense, continuous, and well-preserved vegetation of the area is crucial to protect the soils against erosion. Qualitative observations show that soils are increasingly degraded, water erosion is developing, and sediments accumulate in dams and ponds. In this study we have used the Revised Universal Soil Loss Equation (RUSLE) to assess the erosion risk in this area. It helped to develop a synthetic map of erosion susceptibility. Our results show that the integration of the different parameters in the water erosion process estimated the loss of soil amounting 339,03 tons/ha/year over the whole site. This is equivalent to a value of soil lowering of 2,82 cm which is considered extremely high.
1. Introduction
Water erosion is an extremely complicated natural phenomenon. It has serious economic, human, and ecological consequences. Economic losses are estimated in millions of Dollars and are mainly associated to downslope damage to property, roads and other infrastructure, and destruction of plant cover trough grazing affecting the most productive agricultural and forest lands [1–3]. People, including women and youth, in the rural area whose livelihoods depend on natural resources for subsistence, are vulnerable to land degradation [4]. In this area, land degradation by water erosion leads to a persistent impoverishment of the populations, which causes their exodus towards cities.
Land degradation by water erosion impacts extend to ecosystems. It has significantly altered ecosystems functions and services, decreased the biological diversity of soils and forest, and reduced agricultural lands productivity [5].
Estimates of soil losses due to water erosion in Morocco, range from 500 to > 5,000 tons / km2 / year depending on the region. Accumulation of sediments in natural and artificial waterbodies (siltation of dams and ponds) is estimated to average 75 million m3, equivalent to an annual reduction of 0.5% in the storage capacity of dams. In addition to the degradation of the quality of the mobilized drinking water, the storage capacity decline leads to a significant loss of water that would irrigate 10,000 ha / year [6]. In the Souss-Massa region, the cost of erosion has been estimated overall at 20.7 million DH; the core contributions to this cost are associated to dam reservoirs (76.5%), upstream of the basin (22.4%), and to the Souss-Massa plain (1.12%) [7].
This study forms part of a larger project which evaluates land degradation at the Sites of Biological and Ecological Interest (SBEI) at national level. The aim of the study detailed here was to estimate loss of soil by water erosion in the SBEI of Ain Asmama, an important site for nature conservation in the Souss-Massa region. The outputs would provide useful data to assist in the design of adequate facilities based on multi-criteria analysis using GIS and remote sensing.
2. Study area
The SBEI of Ain Asmama is located at the western High Atlas of Morocco (between 9.03° and 9.33° East Longitude and 30.74° and 31° North Latitude) on the upper parts of the Ait Moussa river right bank. The total site area is 23 564 ha (Figure. 1).
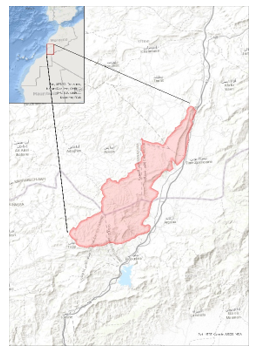 Figure 1: Location map of the SBEI of Ain Asmama
Storied stands plateaus dominate the SBEI. They decrease gradually at altitude, from 1744 m to 780 m, toward the west and north. Argana corridor is a valley depression of the Issen river bordering the SBEI of Ain Asmama. The geological massif of the area contains deep valleys, canyons, sheer cliffs, and steep relief cut by short ravines and giving a rugged hilly feature with an eventful and picturesque appearance.
From the geological view, we have found the domination of the Jurassic and Permo-Triassic classes, with the presence of Quaternary terracing of local alluvium cones and colluvium deposits of the recent piedmonts (Figure. 2).
The climate of the area is dominated by the arid and the sub-humid [8]. The annual rainfall average varies from 240 mm to 470 mm and the highest recorded rainfall falls between November and February. The site is characterized by a diverse vegetation including endemic trees of the region such as Argan, Thuija, Holm oak and Juniper.
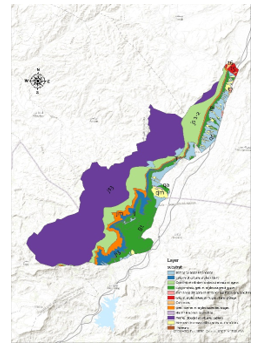 Figure 2: Geological classes’ map of the Ain Asmama’s SBEI
3. Materials and methods
Soil loss rates were estimated using the RUSLE factors were integrated into the GIS following the adjusted model to Moroccan conditions [9,10]:
A = R * K * LS * C * P (1)
where:
A = average soil loss (ton/ha/year)
R = rainfall-runoff erosivity factor (MJ.mm/ha.h.year)
K = soil erodibility factor (t.ha.h/ha.MJ.mm)
L = slope length factor (m)
S = slope steepness factor (degree)
C = cover-management factor
P = support practice factor.
3.1. Rainfall erosivity factor (R)
The erosive potential of raindrops impact is determined by the R factor. Several studies quantifying erosion in Morocco, to estimate the R factor we have used the Arnoldus model [11]:
R = 1.735*10*(11.5 * log∑ (pi2 /p) – 0.8188) (2)
where
R: Rainfall erosivity factor (MJ.mm/ha.h.year)
Pi: Average monthly (mm), and
P: mean annual precipitation (mm).
To allow comparison with previous studies, the R factor was estimated using the same model. Monthly and annual rainfall data was computed for each weather station within the SBEI to calculate the R index using.
3.2. Soil erodibility factor (K)
The K factor is the intrinsic susceptibility of a soil to resist to climatic aggression. Given that the soil units map of SIBE does not exist, we developed a homogeneous distribution map of lithological units. the lithological map assumes that soil units are intricately linked to the parent material e of the underlying geological formations. The map of lithological formations was in turn assigned to different homogeneous soil units. A field survey was then carried out to collect soils samples within each homogeneous soil unit. The organic matter and soil textures were measured in the laboratory and the K factor was computed using the following formula:
100*K = 2.1*10-4*M1.14 (12-a) + 3.25 (b-2) + 2.5 (c-3) (3)
where
K: soil erodibility factor (t.ha.MJ-1.mm-1)
M = (% sand + silt) * (100 -% clay)
a =% organic matter,
b = code of permeability,
c = code of the structure
3.3. Slope length (L) and steepness (S) factors
The slope length (L) and the slope steepness (S) factors give us an overview of the effect of topography on soil erosion. LS factor estimation was much easier and more accurate when using digital elevation model (DEM) in GIS. To evaluate the LS factor, we have used the following equation [12]:
LS= (L/22.15) m * (65.41*Sin²(S) + 4.56 * Sin(S) + 0.065) (4)
where
L = Slope length
S = Slope degree
m = factor dependent on the value of S:
m = 0.5 if S > 5.0%
m = 0.4 if 3.5<= S =< 4.5%
m = 0.3 if 1.0 <= S =< 3.0%
m = 0.2 if S = 1.0%
The slope length was determined using the Horton (1945) model that relates the slope steepness and length:
B = S/2L (5)
where
B: The average of the watershed slope length (m);
S: The catchment area (m2) and
L: The length of the river (m).
3.4. Land cover factor (C)
The estimation of the land cover factor takes in consideration the soil degradation’s conditions, the nature of the land cover (presence of a different type of vegetation) allowed a slow runoff and a better infiltration [13]. The C factor is of a significant importance in RUSEL equation and was estimated out of a developed land use map using Sentinel-2 satellite imagery, missions 2019 [14].
3.5. Support practice factor (P)
The (P) factor takes in consideration the different management related to the conservation measures on water and soil. In this study, we identified the cultivation practices at the SBEI for which the conservative value was assumed to be 0,50 [15].
4. Results and discussions
Erosion is a natural process that occurs worldwide and cannot be stopped [16]. The estimation of soil loss by erosion aims, however, to regulate human effects to maintain tolerable soil loss. For the very same purpose we mapped the water erosion of the Ain Asmama SBEI to help locate the impacts of the different influencing factors on the soil to manage them so that the erosion rate is within an acceptable range. In what follows, we present the results of each factor of the RUSLE equation and then the estimated soil loss of the watershed. Since there is no established threshold between acceptable and unacceptable erosion levels [16], we will convert our final estimation results to values of soil lowering [17] to verify the severity of erosion in the area. We will then discuss the loss of soil thickness relative to the literature.
4.1. Rainfall erosivity factor (R)
Rainfall data series from 1982 to 2019 (37 years) were collected for eight weather station within the SBEI. The data were used to estimate the Rainfall erosivity factor R following the Arnoldus method [11] (Table 1).
Table 1: Weather stations locations within the Ain Asmama SBEI’s and the estimated Rainfall erosivity factor R
| Station | X Easting (m) | Y Northing (m) | P (mm) | R | |
| Argana | 143 624 | 425 520 | 349.66 | 74.04 | |
| Ain Asmama | 127 963 | 426 663 | 473.72 | 83.00 | |
| Imouzzer ida outanane | 108 989 | 414 756 | 540.78 | 96.37 | |
| Amsoul | 148 975 | 432 400 | 214.45 | 46.27 | |
| Aguenza | 140 550 | 422 600 | 252.78 | 58.12 | |
| Bge Abdelmoumen | 139 379 | 411 720 | 413.25 | 88.88 | |
| Tizguine | 144 302 | 441 023 | 236.63 | 50.31 | |
| Iloudjane | 175 648 | 469 482 | 332.15 | 54.89 |
The estimated R values (Table 1) within the SBEI range between 46,27 and 96,37 units / year. A linear interpolation model was built in ArcGIS to accurately differentiate between the climate zones around the area of a selected weather station. All the estimated Rainfall erosivity were then adjusted to the weather station altitude to account for elevations effect. Figure 3 shows the resulting R factor map.
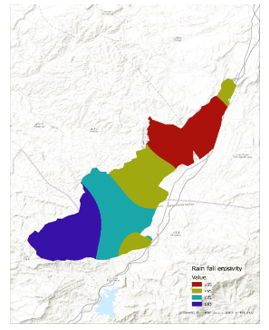 Figure 3: Rainfall erosivity factor (R) of the SBEI of Ain Asmama
4.2. Slope length (L) Slope and Slop steepness (S)
A topographic contour lines of a scanned and georeferenced standard topographic map of 1:50 000 were digitized to generate generated a digital elevation model (DEM). This resulted in an actual spot elevation of each selected point of the grid. The resulting data shows an elevation amplitude between 780 m to 1740 m.
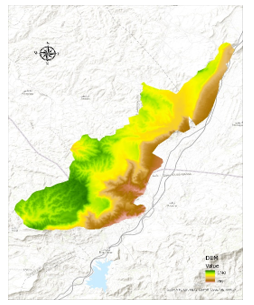 Figure 4: Digital Elevation Model (DEM) map of the SBEI of Ain Asmama
The processing of the developed DEM showed a varying topography within the SBEI of Ain Asmama. The extracted slopes were between 0 and 74 degrees. The reclassification of the DEM resulted in 5 slope classes (Table 2). The slope classes, 0 to 5 degrees, suitable for agronomic land use were only 29.25% of the total area. Thirty eight percent of the area has a slope greater than 15 % suggesting an extremely high vulnerability to water erosion. Our results show the percentages of steep slopes are large and the can increase the impact of the erosion in our study area which will in turn have an impact on the average soil loss downstream of the basin.
Table 2: Slope classes obtained from the reclassification of the Digital Elevation Model (DEM) of the SBEI of Ain Asmama
| Slope in degree | Area (ha) | Percentage (%) |
| 0 – 2 | 3 913.66 | 16.61 |
| 2 – 5 | 2 978.28 | 12.64 |
| 5 – 10 | 4 474.67 | 18.99 |
| 10 – 15 | 3 260.92 | 13.84 |
| 15 – 74 | 8 936.70 | 37.92 |
| Total | 23 564,23 | 100.00 |
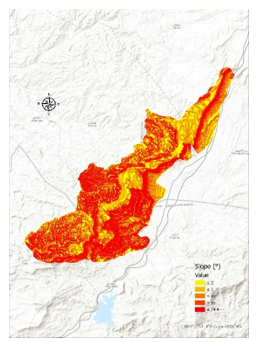 Figure 5: Slope map of the SBEI of Ain Asmama (classes values are in degree)
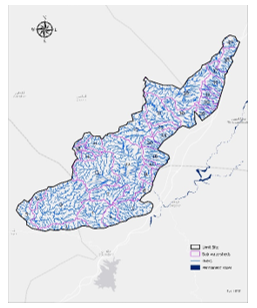 Figure 6: Sub watersheds map of the SBEI of Ain Asmama
The Hydrology tools were applied in GIS to create a stream network of 40 sub-basins within the watershed. The slope length (L) was measured for each delineated sub basin using Horton method. The L values were between 45 and 183 m and the average length was101.95 m.
The estimated LS values were between 0 to 201 units 66% of which are higher than 30 units. This % coverage is in accordance with the classification of Manrique [18].
Table 3: LS factor classes and their %coverage in the Ain Asmama SBEI
| LS classes | % coverage |
| 0 – 5 | 20.01 |
| 5 – 15 | 07.05 |
| 15 – 20 | 02.70 |
| 20 – 30 | 04.52 |
| > 30 | 65.71 |
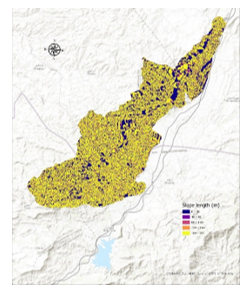 Figure 7: Map of the combined slope steepness and Slope length factor (SL) of the SBEI of Ain Asmama
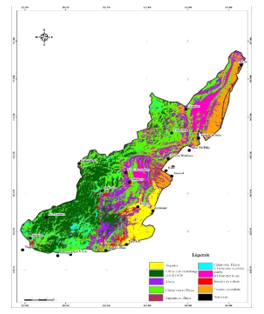 Figure 8: Land cover map of the SBEI of Ain Asmama
4.3. Land cover factor (C)
Supervised classification of land cover using Sentinel-2 images brought out the following groupings: Crop lands, Matorral, Argan trees, Thuija, Juniper, Holm oakand Wasteland.
Uncovered soil (bare soil with low canopy and residue) is likely to be exposed to water erosion. Combining the NDVI map together with the 2019 land cover gives an estimation of density of vegetation. Using this outcome in addition to the land cover map (Figure 8) allowed identification of five land vegetation classes (Table 4) for which C factor values were assigned.
Table 4: Land cover classes and Values of land cover classes in the site of Ain Asmama
| Vegetation classes | C factor value |
| Dense forest | 0.01 |
| Clear forest | 0.10 |
| Matorrals | 0.16 |
| Cultivated land | 0.50 |
| Wasteland | 1.00 |
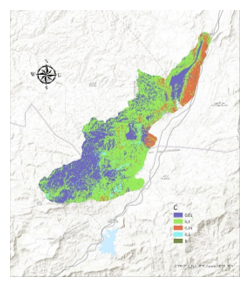 Figure 9: Land cover factor map of the SBEI of Ain Asmama
4.4. Soil erodibility factor (K)
Soil erodibility factor depends on several parameters such as cohesion strength between soil particles, soil and plant roots interaction, plants exudates, biological organisms (e.g., earthworms) and soil structure and its relation to soil moisture content [19]. Following the classification of Manrique [18] our results show that 95 % of the soils are highly to very highly erodible (Figure 10), in accordance.
Table 5: Soil erodibility factor (K) classes at Ain Asmama’s site and the equivalent risk of erodibility following the classification of Manrique
| K factor classes | Risk of erodibility | Area (ha) | Percentage coverage |
| K < 0.15 | Very little erodible soils | 0 | 0.00 |
| 0.15 < K < 0.25 | Slightly erodible soils | 474.29 | 02.01 |
| 0.25 < K < 0.35 | Moderately erodible soils | 762.98 | 03.24 |
| 0.35 <K < 0.45 | Highly erodible soils | 11 225.79 | 47.64 |
| 0.45 < K < 0.60 | Very highly erodible soils | 11 101.17 | 47.11 |
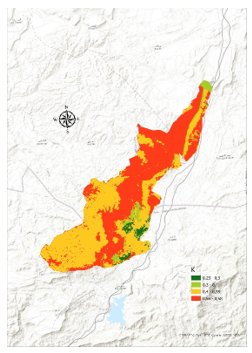 Figure 10: Soil erodibility factor (K) map of the SBEI of Ain Asmama
4.5. Support practice factor (P)
The factor P shows the effect of water and soil management and conservation measures on erosion. Qualitative observation made whilst identifying the land management practices of the SBEI indicate that 0.5 is the suitable P factor value to use for the soil loss assessment.
4.6. Soil loss rate estimation (A)
The overlapping of the thematic maps of RUSEL model factors, using GIS, has led to the establishment of the erosion map. This was in turn reclassified to produce the losses in soils by water erosion (tons / ha / year) (Figure. 11) of the SBEI of Ain Asmama: The estimated losses in soil regularly displaced downstream were between 0.1 and 339 tons/ha/year.
This range of rates of erosion alone is hard to interpret in terms of erosion severity and is meaningless because of the lack of an established threshold between acceptable and unacceptable. levels of erosion [16]. In the 1950s, the USDA considered values of soil-loss of ≈5–12 tons/ha/year as tolerance values to evaluate rates of soil erosion [20]. Researchers have expressed concern that the suggested values by USDA pose uncertainty on how to interpret the differences between modern and geological erosion rates [17]. The estimate of soil erosion in previous studies and its interpretation is very dependent on 1) the scale of the study (From laboratory measures, Field-plots compilation, sub-basins to catchments estimation), 2) the approaches adopted to generate the estimates (Rainfall simulation, Splash cups, Stereo photography, RUSLE, USLE, etc), 3) and the aptitude of a soil to maintain its functions to provide ecosystem services [21].
To contrast the severity of erosion in the SBEI to previous studies using typical ranges of erosion, we converted our outputs to values of soil lowering [17]. For the conversion we used the standard soil bulk density of 1200 kg m-3 as suggested by Montgomery [17] in his widely cited paper. The results show that the soil in the SBEI is lowering by up to 2.82 cm per year, which is considered as an extremely high loss of soil. This soil lowering value is on average hundreds of orders of magnitude greater than the estimated soil lowering values in most of the previous literature summarized in [16], [17]. It is also several times greater than estimates of mean global soil production (from 0.06 to 0.08 mm per year) [22, 23].
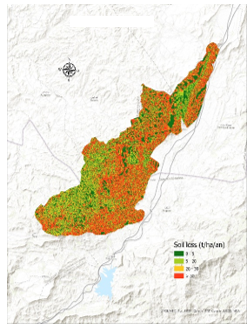 Figure 11: Soil loss map of the SBEI of Ain Asmama
5. Conclusion
This note presents the results of the hydric erosion assessment of the SBEI of Ain Asmama. We first established and implemented a cartographic database for each of the factors of the RUSLE model. which were in turn associated to thematic maps using GIS.
The outputs show that the rainfall an aggressiveness was up to 96.37 units / year. Most of the soils of the region are alluvium and colluvium depositions and weakly developed soils due to erosion on red clay. These soils are poorly permeable and prone to streaming development which in turn keeps the ravines actively widening. The estimated erodibility values were up to 0.58. The values of the slope length and steepness LS vary from 0 to 201. Land use map was established after a supervised classification of the Sentinel imagery associated to the field survey C factors were then assigned to each land cover class identified.
The thematic maps of each factor of the RUSLE equation; were overlapped to give the water erosion map [24]. The results show that the soil in the SBEI is lowering by up to 2.82 cm per year, several times greater than estimates of average global soil production
- J. Boardman, “A short history of muddy floods,” Land Degradation & Development, 21(4), 303–309, 2010, doi:10.1002/ldr.1007.
- R. Evans, J. Boardman, “The new assessment of soil loss by water erosion in Europe. Panagos P. et al., 2015 Environmental Science & Policy 54, 438–447—A response,” Environmental Science & Policy, 58, 11–15, 2016, doi:10.1016/j.envsci.2015.12.013.
- P. Panagos, P. Borrelli, J. Poesen, C. Ballabio, E. Lugato, K. Meusburger, L. Montanarella, C. Alewell, “The new assessment of soil loss by water erosion in Europe,” Environmental Science & Policy, 54, 438–447, 2015, doi:10.1016/j.envsci.2015.08.012.
- L. Olsson, H. Barbosa, A. Cowie, K. Delusca, D. Flores-Renteria, K. Hermans, E. Jobbagy, W. Kurz, D. Li, D.J. Sonwa, L. Stringer, Land Degradation. In Climate Change and Land: an IPCC special report on climate change, desertification, land degradation, sustainable land management, food security, and greenhouse gas fluxes in terrestrial ecosystems, Intergovernmental Panel on Climate Change (IPCC), 2019.
- R. Parveen, U. Kumar, “Integrated approach of universal soil loss equation (USLE) and geographical information system (GIS) for soil loss risk assessment in Upper South Koel Basin, Jharkhand,” 4(6), 9, 2012, doi:10.4236/jgis.2012.46061.
- S. El Khatri, T. El hairech, “Drought conditions and management strategies in Morocco,” Direction de La Météorologie Nationale, Casablanca, 7.
- F. Elame, M.R. Doukkali, A. Fadlaoui, “La gestion intégrée de l’eau à l’échelle du bassin de Souss-Massa: développement d’un modèle intégré de Bassin,” Al Awamia127, 91–111, 2013.
- S. Moukrim, S. Lahssini, M. Rhazi, A.H. Mharzi, A. Benabou, I. Wahby, M. El Madihi, M. Arahou, L. Rhazi, “Climate change impacts on potential distribution of multipurpose agro-forestry species: Argania spinosa (L.) Skeels as case study,” Agroforestry Systems, 93(4), 1209–1219, 2019, doi:10.1007/s10457-018-0232-8.
- R. Kalman, The Climatic Factor of Erosion in the Sebou Watershed Morocco. Sebou Project, 32 p, 1967.
- S. Schmidt, C. Alewell, K. Meusburger, “Monthly RUSLE soil erosion risk of Swiss grasslands,” Journal of Maps, 15(2), 247–256, 2019, doi:10.1080/17445647.2019.1585980.
- H.M.J. Arnoldus, “Methodology used to determine the maximum potential average annual soil loss due to sheet and rill erosion in Morocco,” 1977.
- W.H. Wischmeier, D.D. Smith, Predicting rainfall erosion losses: a guide to conservation planning, Department of Agriculture, Science and Education
- S. El Khatri, T. El hairech, “Drought conditions and management strategies in Morocco,” Direction de La Météorologie Nationale, Casablanca, 7.
- A.Y. Yesuph, A.B. Dagnew, “Soil erosion mapping and severity analysis based on RUSLE model and local perception in the Beshillo Catchment of the Blue Nile Basin, Ethiopia,” Environmental Systems Research, 8(1), 17, 2019, doi:10.1186/s40068-019-0145-1.
- A. Gayen, S. Saha, H.R. Pourghasemi, “Soil erosion assessment using RUSLE model and its validation by FR probability model,” Geocarto International, 35(15), 1750–1768, 2019, doi:10.1080/10106049.2019.1581272.
- D.J. Pennock, Soil erosion: The greatest challenge for sustainable soil management, Food and Agriculture Organization of the United Nations, Rome, Italy, 2019.
- D.R. Montgomery, “Soil erosion and agricultural sustainability,” Proceedings of the National Academy of Sciences, 104(33), 13268–13272, 2007.
- L.A. Manrique, Land erodibility assessment methodology (LEAM): using soil survey data based on soil taxonomy, Editorial and Publication Shop, Honolulu, Hawaii, 1988.
- J. Hallam, M.E. Hodson, “Impact of different earthworm ecotypes on water stable aggregates and soil water holding capacity,” Biology and Fertility of Soils, 56(5), 607–617, 2020, doi:10.1007/s00374-020-01432-5.
- D.L. Schertz, “The basis for soil loss tolerances,” Journal of Soil and Water Conservation, 38(1), 10–14, 1983.
- FAO, Revised World Soil Charter, Rome, Italy, 2015.
- F.R. Troeh, J.A. Hobbs, R.L. Donahue, Soil and water conservation for productivity and environmental protection., Prentice-Hall, Inc., New jersey, USA, 1980.
- T. Wakatsuki, A. Rasyidin, “Rates of weathering and soil formation,” Geoderma, 52(3–4), 251–263, 1992, doi:10.1016/0016-7061(92)90040-E.
- V. Prasannakumar, H. Vijith, S. Abinod, N. Geetha, “Estimation of soil erosion risk within a small mountainous sub-watershed in Kerala, India, using Revised Universal Soil Loss Equation (RUSLE) and geo-information technology,” Geoscience Frontiers, 3(2), 209–215, 2012, doi:10.1016/j.gsf.2011.11.003.