Parametric Study for the Design of a Neutron Radiography Camera-Based Detector System

Adv. Sci. Technol. Eng. Syst. J. 6(3), 248–256 (2021);
 DOI: 10.25046/aj060327
The field of view (FOV) and spatial resolution (SR) are the major image quality parameters which are being optimized in neutron radiography (NR) technique. This requires effective components selection during the design of NR detector systems. The selection is a discouraging task owing to often having conflicting experimental requirements and related constraints. In this work, models were developed to study the relationship between detector system components. These allow the simulation of detector system components whilst taking cognizance of specific experimental requirements and constraints in order to aid the design. Various commercial detector system components combinations were simulated to evaluate their performance. Results were benchmarked with the result from secondary data. 100% agreement between these data demonstrated the accuracy of the models, allowing purposeful selection. The ?90% negative correlation between SR and FOV was identified as a tradeoff between these variables. Currently selected best combination offers a monotonic SR range of 25.5 – 170.92 µm pixel size, over FOV range of 52.3 × 52.3 mm2 – 350 × 350 mm2. The results also show that components can be selected for design of desired detector system within constraints to manage the field of view effectively; thereby optimizing the SR.
1. Introduction
The demand for high spatial resolution (SR) in neutron radiography (NR) facilities has grown with the need to investigate components comprising smaller features for scientific and industrial applications. This necessitates NR facilities to develop their detection methods as for maximal SR resulting in increased image quality. SR as a key parameter determines the imaging performance of detector systems[1, 2]. This describes the degree which two features of the object can be distinguished or separated in the acquired image [3], as well as the ratio of the image sensor size to that of the field-of-view (FOV) [4]. The availability of a simple and efficient method to manage the FOV in optimizing the SR is of high importance for NR, especially for camera-based detector systems (CBDS), as most NR installations incorporate a variable FOV using this type of the detector [1, 2, 5, 6]. The optimum combination of a large FOV and high SR is a great technical challenge for neutron detectors [1, 2, 7] due to the trade-offs between the two. Sophisticated high resolution detectors are ideal for small specimens; however, they are not appropriate for experiments involving larger specimens owing to their small, fixed FOV [2, 8]. This is especially true where image stitching cannot be exploited for example in time dependent investigations such as liquid flow experiments. This requires detector development to meet the demands for various types of experiments that are performed using the NR technique [5, 9].
CBDS comprises a camera, lens and scintillator as basic components [2, 8]. They utilize prime lenses as part of the optics [4, 10]. These lenses are of great value in this type of detector system as their optical performance is usually much better than that of zoom lenses. Prime lenses are optimized for a single fixed FOV and most often have a wide maximum aperture setting which enable much faster shutter speeds and improved low-light functionality when compared to their zoom counterparts [4]. By employing a light tight detector box together with properly aligned components enables them to preserve the light illuminated from the back of the scintillator to yield high quality results [2, 5]. Prime lenses are significantly sharper than zoom lenses as they do not have additional internal elements that translate in order to enlarge the image [11]. Diffraction increases with the number of internal lens elements as in the case of zoom lenses, resulting in degraded optical quality (N. Mansurov, Prime vs Zoom Lenses – A Beginners Guide, Photography Life, 2011). Finally, prime lenses cost relatively less [2] than zoom lenses for such reasons as having fewer internal components.
The use of prime lenses requires that the object distance (OD) be varied to increase or decrease the FOV size [4]. This can be achieved by either moving camera or the object plane (scintillator surface in this case) on a linear path corresponding to optical path. The latter is however not possible due to a fixed scintillator configuration in conventional CBDS. Translating the camera is therefore the only viable option to change the OD without exchanging components [4]. This technique enables a variable FOV[7] within a fixed range which is limited by factors such as space available in experimental area, scintillator size and neutron beam dimensions. The diagram in Figure 1 shows motorized CBDS intrinsic components to demonstrate the FOV management concept.
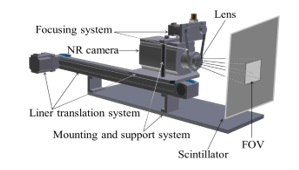 Figure 1: FOV management concept with a motorized camera translation
The other available method for consideration in changing the FOV is interchanging similar lenses of different focal lengths [5,12]. A different focal length will introduce a different angle-of-view (AOV) and therefore a different FOV. The number of achievable FOVs with this method is however limited by the number of lens units available and monotonic FOV variation across a desired range cannot be achieved. Methods such as these are expensive as they involve many components. The exchange process is time consuming and may also damage the fragile scientific components as a result of mishandling.
CBDS as used in NR requires careful selection of appropriate components during design based on established specific experimental requirements and constraints. Conventional component selection, configuration and calibration often lead to sub-optimal use with respect to the components maximum potential, limiting the ability to maximize SR.
The selection of components for design of CBDS can be a discouraging task, especially when constraints such as space available in the NR facility chamber and budget must be adhered to [13]. These together with experimental requirements involving investigations of specimens with various sizes and time dependent examinations, makes a choice of appropriate components combination for design of CBDS inevitable [2,4,12]. The detector system in NR facilities can be viewed as a portable instrument that can be employed at different NR facilities for experimental purposes [4]; therefore its technical requirements can be formulated independently of characteristics of the beam and other external factors [4]. In this research, pragmatic mathematical models were developed to study parameters of the detector components and their relationship. Arbitrarily selected components combinations were used to evaluate the models. Combinations which ensure versatility with respect to investigations of specimens with various sizes, and still obtain the best possible SR, are presented. The trade-offs that must be considered when designing a CBDS under given constrains and experimental requirements are also described.
2. Material and Methods
The mathematical models were developed deriving from the detector system’s optical system represented in Figure 2. Different inherent properties of similar detector system components results in different responses during experiments. The inherent properties are referred to as primary or independent parameters in this work and are defined by parameter values as specified by the manufacturer of the specific component. Selection of components allows these parameters to be varied to produce different results. Variables that are being manipulated using primary parameters are referred to in this work as secondary parameters. These performance-related variables are used in the design of the CBDS in order to satisfy specific requirements and are a function of the primary parameters. Their values are derived from mathematical models which were developed based on the CBDS’s optical system and geometric arrangements of components. This allows parametric studies to be performed in order to establish relationships between parameters.
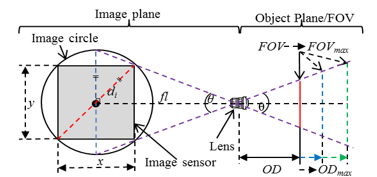 Figure 2: Schematic of the detector system’s components geometrical arrangement and optical system
2.1 Material
Similar but different detector system components including scintillators, cameras and lenses were chosen arbitrarily to undertake a comparative parametric study through simulation in order to enable selection of components for the design of a suitable detector system based on requirements and constraints.
The following provides details for each category of components selected for simulation:
Cameras
Three cameras with vastly different properties were selected from the Andor products range for comparison. Manufacturer’s specifications show that connectivity is through a USB interface and all three feature a standard bayonet F-mount which enables lenses to be exchanged easily (Andor Technology, Belfast, Northern Ireland). The selected cameras are described below.
The Andor iKon-L 936 CCD-camera has a 2048 × 2048 array, aspect ratio of 1.0 and 13.5 µm pixel pitch which delivers a 27.6 × 27.6 mm2 active image area. It features a 5-stage cooler which enables its large area sensor to be cooled down to -100 °C. This makes the iKon-L camera suitable for long exposure times and is ideal for low-light applications such as radiography
The Andor Zyla 5.5-HF front-illuminated CMOS-camera with a 2560 × 2160 array and 6.5 µm pixel pitch delivers a 21.8 mm diagonal FOV with a 16.6 × 14 mm2 active image area giving an aspect ratio of 1.185. Its operating temperatures are from 0 ºC to 30 ºC ambient.
The Andor iKon-XL 230 model with back-illuminated CCD sensor offers a very large 61.4 × 61.4 mm2 imaging area with a 4096 × 4108 array format, aspect ratio of 0.997 and 15 μm pixel size. The chip is thermoelectrically cooled down to -100 °C, and is ideal for applications such as Astronomy or X-ray/Neutron radiography.
Lenses
Table 1 shows a summary of the four lenses selected from Nikon products and their properties from datasheets (Nikkor, Nikon Inc., Melville, NY, USA).
Table 1: Summary of Selected Lenses and their Properties
| Lens | Focal Length | AOV | MFD |
| PC-E Micro NIKKOR f/2.8D ED | 45 mm | 51.4º | 250 mm |
| Nikon AF-S NIKKOR f/1.4G | 50 mm | 46.8º | 450 mm |
| Micro-NIKKOR f/2.8 | 55 mm | 42.9º | 250 mm |
| AF-S Micro NIKKOR F2.8G ED | 60 mm | 39.7º | 185 mm |
Scintillators
Two, high light (blue emission) output, high resolution scintillators, namely a 6LiF: ZnS Large Scintillator (LS) and a ZnS (Ag) –6LiF Medium Scintillator (MS) were adopted for the object plane. The type, active size and the aspect ratio of these scintillators are shown in Table 2.
Table 2: Summary of Selected Scintillators for Simulation and their Properties
| Scintillator | Type | Size | Aspect ratio |
| Larger | 6LiF: ZnS | 400 × 400 mm2 | 1 |
| Medium | ZnS(Ag)-6LiF | 350 × 350 mm2 | 1 |
3.1 Secondary Parameters Modeling
Figure 2 show that, the relationship between the image circle and the image sensor can be represented by the theorem of Pythagoras in equation (1).
di2 = x2 + y2 (1)
The sensor aspect ratio (δ) is the ratio of sensor width (x) to height (y) as given in the following equation as: height (y) as given in the following equation as:
δ = x/y (2)
Also in Figure 2, the focal length (fl) and AOV (θ) are fixed owing to the use of prime lenses. A change in FOV can therefore be achieved by varying the OD or by exchanging similar lens of different focal lengths; thus change in AOV. The latter cannot easily achieve monotonic FOVs similar to when a single lens is in use with a motorized translation systems. This leaves the change in OD as the only appropriate method to change the FOV.
Calculation of the FOV is established by considering the similar triangles theorems, namely the vertical opposite angles and the angle-angle similarity theorem. These indicate that the object plane, as observed through a lens, has the same properties as the image plane of the optical system. As the OD can be changed, various FOVs can be achieved by varying the OD as shown in Figure 2, producing an instantaneous FOV (IFOV). This is calculated by the width (FOVw) and the height (FOVh) at a given OD and taking the aspect ratio of the image sensor into account. The length of the rectangle representing the IFOV’s diagonal line is the actual FOV at the sensor position, and is calculated according to Pythagoras’ theorem as in equation (3).
![]() The physical size of the FOV is defined using the OD and the lens AOV using a trigonometric equation (4), as follows:
The physical size of the FOV is defined using the OD and the lens AOV using a trigonometric equation (4), as follows:
FOV = 2 × tan(θ/2) × OD (4)
The maximum FOV (FOVmax) is achieved at the position where the maximum OD (ODmax) is realized, and vice versa. ODmax is given by (5).
ODmax = FOVmax/2 × tan(θ/2) (5)
The camera image sensor properties such as aspect ratio; play a major role in defining how the scintillator surface would be imaged, and to what extents the image can be captured and resolved. By disregarding the neutron beam size, the maximum FOV (FOVmax) the detector system can image is equal to the size of the maximum rectangle subjected to the sensor aspect ratio that can fit into the area of the scintillator defined by the width (W) and the height (H). The aspect ratios of both the scintillator and the image sensor must match, for the sensor to image the entire scintillator at FOVmax as shown in Figure 3(a).
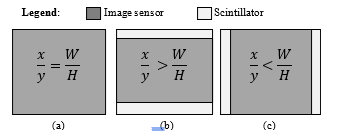 Figure 3: Effect of image sensor-scintillator aspect ratio matching at maximum FOV (a) Equal aspect ratios, (b) Large image sensor aspect ratio, causing vertical mismatch (c) Large scintillator aspect ratio, causing horizontal mismatch
If this is not the case, the mismatch in aspect ratios will result in the area of the scintillator not being imaged entirely at FOVmax [5], this phenomenon is illustrated in Figure 3 (b) and (c).
The mismatch as shown in the figures will cause either the horizontal side or vertical side to saturate first, curtailing any further increase in FOV, giving FOVmax. The following equations (6) – (8), based on Pythagoras’ theorem were conditionally used to calculate the FOVmax, given the scintillator and the image sensor aspect ratios:
|
; if x/y =W/H | (6) | |
|
; if x/y > W/H | (7) | |
|
;if x/y < W/H | (8) |
The minimum focus distance (MFD) is a primary parameter which describes the minimum distance between the lens and the object plane, from which the lens is able to focus. This limits the extent to which the lens can be closest to the object plane, thereby defining the minimum OD (ODmin). The FOVmin the detector system can capture is calculated from this value by substituting the ODmax with ODmin and FOVmax with FOVmin in (5), as in (9).
FOVmin = 2 × tan(θ/2) × ODmin (9)
The FOV is changed primarily to achieve high level of SR. A change in FOV however changes the surface area of the object plane which the camera can image, thereby causing the area that the image sensor can resolve using a given lens to vary. This is equivalent to varying a SR. SR can be calculated either from the ratio of the sensor size to the FOV size, giving SR in line pairs per millimeter (lp/mm), or from the ratio of the FOV size to the sensor size, giving SR in micrometers (µm). This can be achieved using equations (10), and (11), respectively:
SR = FOV/CCDsize = FOV/di (lp/mm) (10)
SR = di/FOV (µm) (11)
3. Results and Discussion
This section discusses the benchmarking and evaluation of the results from simulation of models developed. To begin with, the Radiography Simulator software which is designed to simulate a radiograph of particular shape or type of material of the sample was used. Firstly, the simulation of radiographs with components combination selected from section 2.1 was carried out with Radiography Simulator in [14] to generate the evaluation datasets. The generated datset is then analysed for correctness of parameters representing the selected simulation setup. The results are presented to contrast with the results from models simulation.
Secondly, the models are then simulated and the results are benchmarked against the Radiography Simulator results. The capability of the models to produce desirable results is then assessed, and lastly the results are used to select the best combination of components for a particular envisaged experimental requirement and constraint.
4.1 Models Benchmark Samples and Analysis Software
Secondary data were generated using Radiography Simulator to evaluate the success of the designed models. The dataset comprised of a simulated 12 cm × 1 cm × 12 cm (l×b×h) cube specimen made from two materials half each. The parameters used for simulation were from combination of the following detector system components specified in section 2.1: Andor iKon-L 936 CCD camera and MS in combination with the four lenses. Dataset of radiographs from MFD to the FOVmax were produced for each lens. Table 3 show a sample of data from each lens dataset. For each lens shown on the table, the first row consists of image at minimum OD with their respective OD position, second row consists of image at maximum OD also with position and the third row is the number of images generated per lens.
Table 3: Properties of images generated by Radiography Simulator
| Lens | PC-E Micro NIKKOR f/2.8D ED 60mm | Nikon AF-S NIKKOR f/1.4G 55mm | Micro-NIKKOR f/2.8 50mm | AF-S Micro NIKKOR F2.8G ED 45mm |
| ODmin | ||||
| 185 mm | 250 mm | 450 mm | 250 mm | |
| ODmax | ||||
| 1238 mm | 1135 mm | 1032 mm | 928 mm | |
| Images | 1053 | 885 | 582 | 678 |
| Total Images | 3198 | |||
ImageJ open source imaging software, which is freely available to the scientific community [15] was used to analyse the simulated images and measure the sample size, FOVmin, FOVmax and SR in each of the dataset in Table 3 as shown in Figure 4.
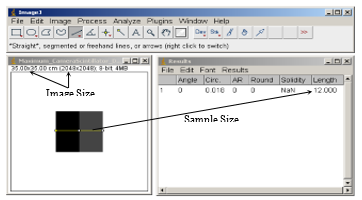 Figure 4: Radiograph measurement using ImageJ image analysis software
The results from ImageJ are tabled in Table 4, and they demonstrated that the simulated sample and components parameters selected are intrinsic to the simulated images.
Table 4: FOV range and SR range analyzed using ImageJ software
| Lens | 60mm PC-E Micro NIKKOR f/2.8D ED | 55mm AF-S NIKKOR f/1.4G | 50mm Micro-NIKKOR f/2.8 | 45mm AF-S Micro NIKKOR F2.8G ED |
| FOV range (mm) | 73.9 –
495 |
109.0 –
495 |
216.1 – 495 | 133.5 – 495 |
| SR range (µm) | 25.5 –
170.9 |
37.6 –
70.9 |
74.6 – 170.9 | 46.1 – 170.9 |
| SR range (lp/mm) | 39.2 –
6.4 |
26.6 –
6.4 |
13.4 –
6.4 |
21.7 –
6.4 |
5.1 Simulation
Simulation of detector system components parameters for the design was undertaken using models developed in section 3.1. The results would aid in selecting the optimal combination of detector system components, constrained by experimental requirements. The data from physical detector system component listed in 2.1 were used in components combinations. The derived models were implemented in a spread sheet and the results are presented in the following subsections.
Field-of-View Area Saturation Determination
To determine the FOV saturation (FOVmax) for a particular, the camera sensor and the scintillator aspect ratios were matched to determine the saturation size. This was realized using the aspect ratio matching for a camera sensor and scintillator. This was repeated the for combinations of the three Andor cameras and two scintillators. The aspect ratio matching was accomplished througt one of the fitting equation in (6) – (8) in each case. The results are given in Table 5. Column 1 shows the camera model; and column 2 and 4 indicate the match or type of mismatch for MS and LS respectively. The FOVmax with dimensions indicated in size by W × H for each combination is shown in column 3 and 5 for MS and LS respectively.
Object Distance Determination for a Variable Field-of-View
The ODmax from which the FOVmax is derived is calculated from equation (5). The OD range data-points were simulated from zero (0) mm to ODmax with fixed predefined OD shift intervals of 1mm. In normalizing the data-points, the lens MFD was taken into account and all ODs below this point were discarded, staying on the useful OD range. The MFD and the resulting ODmax, are the OD range limits in each case shown in column 4 and 7 for MS and LS respectively.
Table 5: Aspect Ratio Matching for Sensor-Scintillator Combination with the Field-of-View Saturation
| Camera name;
Aspect Ratio |
Medium Scintillator (LS) – (400 x 400 mm2) | Larger Scintillator (MS) – (350 x 350 mm2) | ||
| Sensor Scintillator Match | FOV Size Saturation
(W ×H) mm2 |
Sensor Scintillator Match | FOV Size Saturation (W×H)mm2 | |
| Zyla 5.5 HF ;1.185 | x/y > W/H | 400 × 337 | x/y > W/H | 350 × 295 |
| iKon-L 936 ;1.0 | x/y = W/H | 400 × 400 | x/y = W/H | 350 × 350 |
| iKon-XL230
;0.997 |
x/y < W/H | 399 × 400 | x/y < W/H | 349 × 350 |
In evaluating the developed models, the parameters’ values from benchmark dataset agree 100% with the Camera-Lens-Scintillator simulation using models in the result on Table 6 for Andor iKon-L 936 CCD camera and MS in combination with the four lenses.
The plots on Figure 5 show the OD range per camera using all lens-scintillator combinations. From the OD ranges determined, the variable FOV would then be realized by utilizing equation (4), and varying the OD within the OD range, resulting in a FOV ranging from the position of MFD where FOVmin is realized, to the position of ODmax were FOVmax is realized. Data points for FOV were simulated by ussuming a 1mm shift intervals for OD. The achieved FOV ranges for each combination are shown in Table 6 column 5 for MS and column 8 for LS. The evaluation dataset for Andor iKon-L 936 camera combined with the PC-E Micro NIKKOR f/2.8D ED 60mm lens match the result from models. The FOV change behavior was plotted over the OD range in Figure 5 for each lens-scintillator combination using different cameras shown in Table 6 column 1. MS was used in Figure 6 (a), (b), and (c) and LS in (d), (e) and (f).
Table 6: Simulation results for combinations of Camera-Lens-Scintillator
| Andor Camera; Aspect Ratio(δ) | Lens focal length | Maximum Spatial Resolution (lp/mm; µm) | Medium scintillator | Larger scintillator | ||||
| Object Distance Range (mm) | Field-of-View Range (mm) | Minimum Spatial Resolution (lp/mm; µm) | Object Distance Range (mm) | Field-of-View Range (mm) | Minimum Spatial Resolution (lp/mm; µm) | |||
| Zyla 5.5 HF;
1.185 |
45 mm | 22.9;43.7 | 250-782 | 146.4-458 | 5.85; 136.71 | 250-894 | 146.4-523 | 5.12;156.29 |
| 50 mm | 14.1;70,7 | 450-870 | 236.9-458 | 5.85; 136.71 | 450-994 | 236.9-523 | 5.12;156.29 | |
| 55 mm | 28.0;35.6 | 250-958 | 119.5-458 | 5.85; 136.71 | 250-1094 | 119.5-523 | 5.12;156.29 | |
| 60 mm | 41.3;24.2 | 185-1045 | 81.1- 458 | 5.85; 136.71 | 185-1194 | 81.1-523 | 5.12;156.29 | |
| iKon-L 936;
1.0 |
45 mm | 21.7;46.1 | 250-927 | 133.5-495 | 7.31; 170.92 | 250-1059 | 133.5-566 | 6.40;195.26 |
| 50 mm | 13.4;74.6 | 450-1031 | 216.1-495 | 7.31; 170.92 | 450-1178 | 216.1-566 | 6.40;195.26 | |
| 55 mm | 26.6;37.6 | 250-1135 | 109.0-495 | 7.31; 170.92 | 250-1297 | 109.0-566 | 6.40;195.26 | |
| 60 mm | 39.2;25.5 | 185-1238 | 73.9-495 | 7.31; 170.92 | 185-1415 | 73.9-566 | 6.40;195.26 | |
| iKon-XL 230;
0.997 |
45 mm | 23.0;43.5 | 250-927 | 133.3-494 | 11.74; 85.21 | 250-1059 | 133.3-565 | 10.27;97.35 |
| 50 mm | 37.2;26.9 | 45 -1031 | 215.8-494 | 11.74; 85.21 | 450-1178 | 215.8-565 | 10.27;97.35 | |
| 55 mm | 18.8;53.3 | 250-1135 | 108.9-494 | 11.74; 85.21 | 250-1296 | 108.9-565 | 10.27;97.35 | |
| 60 mm | 12.7;78.6 | 185-1238 | 73.8-494 | 11.74; 85.21 | 18 -1416 | 73.8-565 | 10.27; 97.35 | |
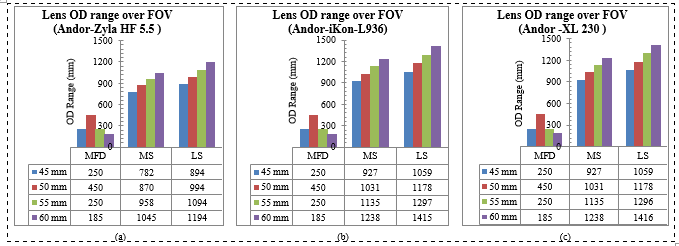 Figure 5: OD range per lens-scintillator combination for Andor cameras: (a) Zyla 5.5-HF, (b) and (c) iKon-L 936 and Andor iKon-XL 230
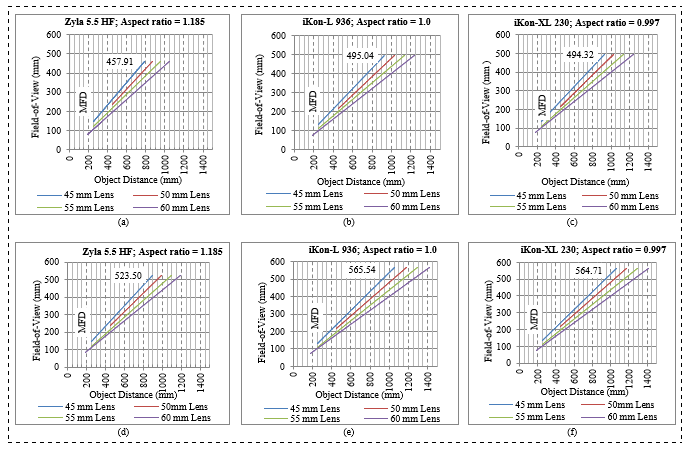 Figure 6: FOV range over OD for all camera-lens combination: First column (Zyla 5.5 HF), second column (iKon-L 936) and third column (iKon-XL 230)
Field-of-View Change for Variable Spatial Resolution
As the FOV size changes (IFOV) with change in OD, SR also changes owing to a fixed sensor size. In simulating the SR each camera-lens-scintillator combination would produce at each FOV data point, equation (10), derived from the ratio of FOV to the di was used, giving results in lp/mm and vice versa, using equation (11), giving results in µm; both defines SR range. A 1mm shift interval for FOV data points was adopted over OD range. High SR range limit using both scintillators are shown in Table 6 column 3 and the low range limits in column 6 and 9 for MS and LS respectively. Figure 7 shows change in SR over the FOV size using various camera-lens combinations with the LS. Figure 7 (a), (b) and (c) shows the variation of SR in lp/mm whilst Figure 7 (d), (e) and (f) the same results shown in µm.
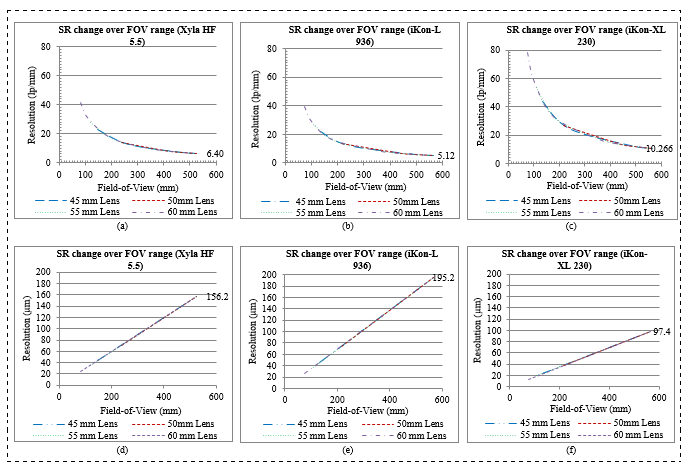 Figure 7: SR change over FOV range for all camera-lens combinations using LS: (a, b and c) in line pairs per mm and (d, e and f): in micrometers pixel size
Spatial Resolution and Object Distance
As the length of OD is changed to vary the FOV, the SR also changes. The change in the SR as a function of OD is demonstrated for all camera-lens combinations and presented in Figure 8 (a), (b) and (c) for the MS and Fig. 8 (d), (e) and (f) for the LS
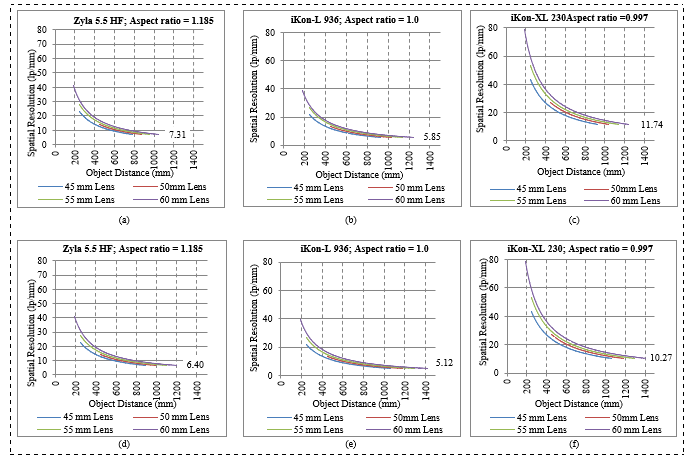 Figure 8: SR changes over OD range for all camera-lens combination using: MS in (a, b and c) and LS in (d, e and f)
The results in Figure 7 and Figure 8 show that the OD increases with increased FOV and OD decreases as SR increases. Figure 7 shows that the effective pixel size becomes bigger with larger FOV, indicating lower SR. The covariance due to the SR, FOV, and the correlation between OD and FOV, for the three cameras (each with a combination of four lenses over LS), were calculated using the covariance function (Cov) given in equation (12).
Cov(x,y) = ∑[(xi – xm) × (yi – ym)]/(n –1) (12)
where: xi = a given x value in the dataset.
xm = the mean, or average, of the x values.
yi = the y value in the dataset that corresponds with xi.
ym = the mean, or average, of the y values.
n = the number of data points.
The strength of these relationships was calculated using Spearman’s correlation coefficient (ρ), given by (13).
ρ = 1 – (6∑di2)/(n (n2 –1)) (13)
where: ρ = Spearman rank correlation coefficient
di = difference between the ranks of corresponding variables
n = number of observations
The results of this relationship are tabled in Table 7.
Table 7: Field-of-View, Spatial Resolution Covariance and Correlation per Camera-Lens Combination over LS
| Lens | Zyla 5.5 HF | iKon-L 936 | iKon-XL 230 |
| Covariance; Correlation | Covariance; Correlation | Covariance; Correlation | |
| PC-E Micro NIKKOR 45 mm f/2.8D ED | -443.8;
-0.947 |
-488.56;
-0.934 |
-978.6;
-0.934 |
| Nikon AF-S NIKKOR 50 mm f/1.4G | -174.5;
-0.979 |
-221.14;
-.970 |
-442.9;
-0.970 |
| Micro-NIKKOR 55 mm f/2.8 | -589.8;
-0.930 |
-628.8;
-0.915 |
-1258;
-0.915 |
| AF-S Micro NIKKOR 60 mm F2.8G ED | -922.4;
-0.893 |
-939.67;
-0.874 |
-1883;
-0.874 |
The graphs in Figure 7 demonstrate an existing negative monotonic relationship between the SR and the FOV. Results also show that there is strong negative correlation between SR and the FOV (-90 %) as confirmed by the results in Table 7. Overall results show that, despite the trade-offs that accompanies each choice of combination. The selection lies in the balance between SR and a larger FOV range to accommodate specimens of different sizes.
Larger scintillators offer a large maximum FOV useful in the examination of large specimens without having to examine them in parts. However, the results given in Figure 6 show that, despite the lens or camera in use, larger scintillators demand longer ODs to cover the entire FOV. This contributes to the overall size of the detector system.
Smaller scintillators offering a small maximum FOV are good for a compact design. They are ideal when investigating small specimens. However, they complicate experiments involving large specimens, owing to specimens being scanned in sections. This requires increased time for examination and expert knowledge of image stitching during post-processing. While the camera chip size and the required SR should be the primary consideration in selecting the size of the scintillator, the underlying rationale should be based on the expected size of specimens and trade-offs.
Larger AOV lenses are ideal for a compact design where examinations involving large specimens and large FOVs are necessary; however, these lenses have long MFD and are unable to achieve a very small FOV. They produce small FOV ranges due to immediate FOV saturation. While it is useful to employ a larger FOV, it must be observed that the anti-correlation between the FOV and SR means the trade-off between the two is unavoidable. In contrast to larger AOV lenses, smaller AOV lenses have short MFDs which allow them to be placed very close to the object plane, thereby increasing the reproduction rate. These lenses are ideal in a design intended for smaller specimens necessitating a smaller FOV to maximize the SR; however, they demand a longer displacement for larger FOV applications, increasing the size of the detector system.
By assuming the sample sizes between 10 cm × 10 cm to 30 cm × 30 cm as a target size of samples envisaged, this suggests a FOV range as an experimental requirement. An adequate minimum FOV in the given range of components would be achieved by a 60mm PC-E Micro NIKKOR f/2.8D ED lens. This combined with the iKon-L 936 CCD camera and the 35mm × 35mm FOV scintillator would allow a SR range of 25.5 – 170.92 µm pixel size. In other work CBDS have previously reported a SR at the region of ≈ 100 to 500 µm and recently less than 50 µm [2]. If the budget as a constraint allows, with 1.3m space available at the position where the detector must be located. This detector system would make a bests combination for requirements stated.
4. Conclusion
In conclusion to the component selection strategy, the CBDS design should optimize the SR by managing the FOV. In pursuit to achieve this, the parametric study for the design of a CBDS was presented. We developed models to determine the maximize performance of the CBDS based on experimental requirements and given constraints. In particular, we tried to attain a balance between the FOV and the SR in order to provide a versatile detector system with respect to both variables through simulation. A clear understanding of the different constraints and experimental requirements would aid in the choice of components using the developed models.
To evaluate our models, we benchmarked the results with the secondary data and 100% agreement between the results demonstrated the desirable functionality of the models. The chosen scenario of experimental requirements and constraint has shown that these models are effective in guiding the development of the best detector system with given limitations.
In addition, we proposed a use of linear translation system for the changing the OD to achieve a monotonic FOV and SR. As future work, we plan to develop software for components combination selection. This software will take experimental requirements and constraints as input and return the best possible components combination that can be achieved.
Conflict of Interest
The authors declare no conflict of interest.
- A.P. Kaestner, Z. Kis, M.J. Radebe, D. Mannes, J. Hovind, C. Grünzweig, N. Kardjilov, E.H. Lehmann, “Samples to Determine the Resolution of Neutron Radiography and Tomography,” Physics Procedia, 88(September 2016), 258–265, 2017, doi:10.1016/j.phpro.2017.06.036.
- E.H. Lehmann, G. Frei, G. Kühne, P. Boillat, “The micro-setup for neutron imaging: A major step forward to improve the spatial resolution,” Nuclear Instruments and Methods in Physics Research, Section A: Accelerators, Spectrometers, Detectors and Associated Equipment, 576(2–3), 389–396, 2007, doi:10.1016/j.nima.2007.03.017.
- J. Rueckel, M. Stockmar, F. Pfeiffer, J. Herzen, “Spatial resolution characterization of a X-ray microCT system,” Applied Radiation and Isotopes, 94(September), 230–234, 2014, doi:10.1016/j.apradiso.2014.08.014.
- H. Pleinert, E. Lehmann, S. Körner, “Design of a new CCD-camera neutron radiography detector,” Nuclear Instruments and Methods in Physics Research, Section A: Accelerators, Spectrometers, Detectors and Associated Equipment, 399(2–3), 382–390, 1997, doi:10.1016/S0168-9002(97)00944-3.
- N. Kardjilov, M. Dawson, A. Hilger, I. Manke, M. Strobl, D. Penumadu, F.H. Kim, F. Garcia-Moreno, J. Banhart, “A highly adaptive detector system for high resolution neutron imaging,” Nuclear Instruments and Methods in Physics Research Section A: Accelerators, Spectrometers, Detectors and Associated Equipment, 651(1), 95–99, 2011, doi:10.1016/j.nima.2011.02.084.
- E. Lehmann, M. Raventos, R.P. Harti, P. Trtik, A. Kaestner, D. Mannes, C. Grünzweig, “Methodical Progress in Neutron Imaging at PSI,” Physics Procedia, 88(September 2016), 250–257, 2017, doi:10.1016/j.phpro.2017.06.035.
- D.S. Hussey, D.L. Jacobson, M. Arif, P.R. Huffman, R.E. Williams, J.C. Cook, “New neutron imaging facility at the NIST,” Nuclear Instruments and Methods in Physics Research Section A: Accelerators, Spectrometers, Detectors and Associated Equipment, 542(1–3), 9–15, 2005, doi:10.1016/j.nima.2005.01.004.
- C. Tötzke, I. Manke, A. Hilger, G. Choinka, N. Kardjilov, T. Arlt, H. Markötter, A. Schröder, K. Wippermann, D. Stolten, C. Hartnig, P. Krüger, R. Kuhn, J. Banhart, “Large area high resolution neutron imaging detector for fuel cell research,” Journal of Power Sources, 196(10), 4631–4637, 2011, doi:10.1016/j.jpowsour.2011.01.049.
- E.H. Lehmann, P. Vontobel, G. Frei, C. Brönnimann, “Neutron imaging—detector options and practical results,” Nuclear Instruments and Methods in Physics Research Section A: Accelerators, Spectrometers, Detectors and Associated Equipment, 531(1–2), 228–237, 2004, doi:10.1016/j.nima.2004.06.010.
- M. DINCA, “The implementation of a charge coupled device (CCD) camera in a neutron imaging system for real time and tomography investigations,” Neutron Imaging:A Non-Destructive Tool for Materials Testing (IAEA-TECDOC Series), (September), 53–67, 2008, doi:978–92–0–110308–6.
- K. Eismann, S. Duggan, T. Grey, Real world digital photography, Pearson Education, 2010.
- N. Kardjilov, A. Hilger, I. Manke, M. Strobl, M. Dawson, S. Williams, J. Banhart, “Neutron tomography instrument CONRAD at HZB,” Nuclear Instruments and Methods in Physics Research Section A: Accelerators, Spectrometers, Detectors and Associated Equipment, 651(1), 47–52, 2011, doi:10.1016/j.nima.2011.01.067.
- E.H. Lehmann, P. Vontobel, G. Frei, G. Kuehne, A. Kaestner, “How to organize a neutron imaging user lab? 13 years of experience at PSI, CH,” in Nuclear Instruments and Methods in Physics Research, Section A: Accelerators, Spectrometers, Detectors and Associated Equipment, 2011, doi:10.1016/j.nima.2010.12.135.
- R. Nshimirimana, A. Abraham, G. Nothnagel, A. Engelbrecht, “X-Ray and Neutron Radiography System Optimization by Means of a Multiobjective Approach and a Simplified Ray-Tracing Method,” Nuclear Technology, 1–20, 2020, doi:10.1080/00295450.2020.1740562.
- C.A. Schneider, W.S. Rasband, K.W. Eliceiri, “NIH Image to ImageJ: 25 years of image analysis,” Nature Methods, 9(7), 671–675, 2012, doi:10.1038/nmeth.2089.
No related articles were found.