Performance of a Thermoelectric Cooler Box Powered Using Solar Panels with a Mini Pin Fin Heat Removal Unit

Adv. Sci. Technol. Eng. Syst. J. 6(3), 355–360 (2021);
 DOI: 10.25046/aj060341
Experiments to investigate the performance of a thermoelectric cooler box powered using a solar panel with a mini pin fin as the heat removal unit was conducted at the un-condition ambient temperature. Due to solar power, the power given to the thermoelectric on different days was different. However, the power on the day of the experiment was nearly stable because the solar panel was connected to a battery. The parameters tested were the cooler box temperatures and COP (coefficient of performance)and there were four Cases examined in this study: Case A (the cooler box was empty), Case B (the cooler box was filled with water of 3000 ml), Case C (the cooler box was charged with 6000 ml of water), and Case D (the cooler box was filled with 9000 ml of water). For these experimental conditions, the maximum COP was 0.51. This was obtained for the run with 9000 ml of water. Increasing the water volume raises the temperatures inside the cooler box and the optimum performance is discussed.
1. Introduction
This study was performed due to the goods transportation requirements. The transportation of goods, blood and vaccines needs portable refrigerators. Thermoelectric (TE) cooler boxes seem like becoming an option. This was owing to the reports presented by previous researchers, e.g. [1-5]. The authors elucidated that the TE cooler box was much lighter, compact, no leakages, durable and easier to maintain. However, there is a limitation of this cooler type, namely low COP, even its COP is always less than 1. This indicates that studies in this field are still wide open to increase the COP.
Several researchers have been trying some ways to increase the TE cooler performances. The COP can be raised by advancing the quality of TE materials, differing the application procedures, and wangling the unit of heat dissipation. The research on TE materials is devoted to increasing the COP. Nevertheless, in terms of material, the TE development is slow. Good material for TE is indicated by its figure of merit. Bismuth telluride (Bi2Te3) is widely employed in TE generators and coolers for low temperature. Bi2Te3 possess a maximum value of ZT~1 as reported in [6, 7]. According to the authors in [8], if the figure of merit can be increased to 2 or 3, the TE cooling can be cut-throat with compression systems. Furthermore, if the figure of merit is as big as 6, then the TE cooling system can be used for cryogenic purposes. Due to the low development of TE material, increasing COP through applications has been becoming a choice. Some researches on the TE cooling application have been performed by several researchers, e.g. [1, 4, 5, 9]. However, the authors still obtained low COP (even less than 1). One parameter that can influence the COP of the TE cooling systems is the heat removal unit. In [10], the authors studied several heat removal units. They used heat removal units: a heat sink fin fan and a double fan heat pipe. Nevertheless, they still had a small COP.
Authors in [1] studied TE cooling using a mini channel and the power used to operate the TE cooling was a solar panel. They found that solar panel was promising power for the TE cooling system in the future. Furthermore, as electricity is expensive in several countries, e.g. Indonesia, renewable energy may be important to be applied. The good thing about using the solar panel is that this energy is free. Therefore, in this study, the energy used is generated using solar panels.
The theory of mini and microchannels has shown better heat transfer and more effectiveness. The studies of the micro and mini channels were conducted e.g. [11, 12]. The authors found that micro and mini channels could increase heat transfer. Nevertheless, again, in [1], the authors still obtained the COP of less than 1, although they already used a mini channel as the heat removal unit.
Table 1: COP attained from available literatures related to the unit of heat dissipation
| Referenses | Study | Heat removal unit | COP |
| [1] | TE cooler box powered using solar panels with a mini channel. | Mini channel | 0.01-0.76 |
| [10] | Experimental cooler box using two different heat dissipation units | Heat sink with fansDouble fan heat pipe | 0.002-0.02 |
| [17] | Design and experimental solar TE refrigerator | Heat sink with fans | 0.16 |
| [18] | TE device for small scale space conditions | Heat sink with fans | 0.43-0.45 |
| [19] | TE refrigerator performance | Heat sink with fans | 0.64 |
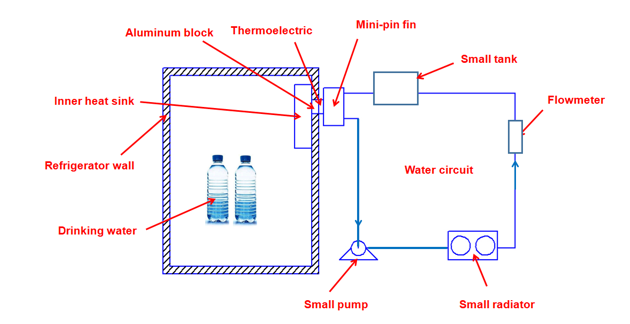 Figure 1: Schematic diagram of the apparatus
Because the COP gained in the previous study was still low, so this study tried using a mini pin fin. Studying mini or micro pin fin was ever conducted by several previous researchers, e.g. [13-15]. However, the authors in [16] stated that the mini pin fin could transfer high heat flux than conventional heat exchanger or mini channels. Owing to their encouragement, this current study used a mini pin fin as the heat removal unit. It was expected that the COP of the TE cooler box examined was higher than the COP obtained in the previous studies. This study was just to investigate the performance of the cooler box powered using solar panels with a mini pin fin as the heat removal unit. The study using a mini pin fin as a heat removal in a TE application has not been investigated yet. As shown in Table 1, none of the previous studies exposes the use of a mini pin fin as the heat removal unit at TE cooling systems. Hence, the novelty of this study is the heat removal unit that is constructed from a mini pin fin; it also contributes to the TE cooling system studies.
This study is a continuation of the previous study entitled performance of a large thermoelectric refrigerator power by a solar panel [1]. The difference in this study from the previous study is the heat removal unit. In the previous study, the heat removal unit was constructed of a mini channel, while in this study the heat removal unit used was a mini pin fin.
2. Research Method
2.1. Experimental Set-up
This work is a part of TE cooling system studies using solar panels as power. This study is aimed to investigate the ability of a TE cooler run by solar panels with a mini pin fin as the heat dissipation unit, and to know the effect of water volume on the COP of the system. In the previous study, the heat removal unit was a minichannel, while in this recent study; the heat removal unit was a mini-pin fin. Nevertheless, the focus of this study was the performance of the TE cooler due to the heat removal unit. The study used a test rig shown in Figure 1. The test rig was also used in [1]. It consisted of a box, a TE, water, solar panels, a mini-pin fin, a pump, a radiator, a small tank, meter flow, a battery, a solar charger, and a data logger National Instrument (cDAQ-NI 9174). Similar to the previous study, all temperatures were measured utilizing thermocouples (K-type) that were calibrated in an oil bath with an accuracy of ± 0.2°C, and the electrical power employed was assessed using a Vichy Vc8145 digital multimeter. The accuracy of ampere and volt measurement was 0.1% reading and 0.05% reading. Meanwhile, the water flow passing the mini-pin fin was calculated using FLR1000 flowmeter with an accuracy of ± 0.2 g/s.
As the electric current surges into the TE, the hot side temperature of the TE increased drastically. This increased temperature should be maintained so that it did not exceed 65°C, e.g. using water flow. If the hot side temperature was low, the cold side temperature was low too. That was why using TE as the cooler machine could be successful in cold countries because the environmental temperature was already low.
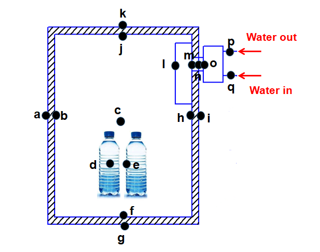 Figure 2: Thermocouple placements
Finally, the heat from the TE was taken away by the water flowing inside the mini pin fin towards the small radiator. The heat was then discharged from the small radiator into the ambient through a finned heat exchanger or radiator. Then the water came back to the small tank. The source of the electricity was solar panels; therefore, it fluctuated. When the sky was clear, the power was large and vice versa. However, these fluctuations were eliminated by using a battery.
Thermocouple placements can be seen in Figure 2. Their locations are noted using the letters a-q. Meanwhile, the electrical flow diagram is presented in Figure 3. Two pieces of solar panels, each with 100WP power, were utilized and one free maintenance battery with a voltage of 12 V, and a current of 100 AH was employed. However, the analysis here was focused on the performance of the TE cooler only, while a depth analysis of the mini-pin fin and solar panel was not given in this study.
Parameters investigated were (1) heat absorbed by the TE (noted by Qc), (2) the power is given to the TE noted, PT, and (3) COP. The heat absorbed by the TE (Qc) comprised of heat from the air, water and bottles inside the cooler box. The heat from the air can be predicted using equation (1). This equation can be found in [4, 10, 20]. The experimental uncertainties and conditions are listed in Table 2.
![]() Ea is the energy removed from the air inside the cooler box (J), ma represents the air mass (kg), cp is the specific heat (J/kg°C) and T is the temperature of the air. To change the energy into the heat rate, eq. (2) can be used, this equation can be obtained in [1, 4-5, 20-21].
Ea is the energy removed from the air inside the cooler box (J), ma represents the air mass (kg), cp is the specific heat (J/kg°C) and T is the temperature of the air. To change the energy into the heat rate, eq. (2) can be used, this equation can be obtained in [1, 4-5, 20-21].
The cooler box size used was 0.317 m x 0.235 m x 0.447 m. The mini-pin fin was bought from an online shop and this was usually used in the CPU for cooling the processor. The variations of investigated parameters are Case A (the cooler box is empty), Case B (the cooler box is filled with bottles containing 3000 ml of water), Case C (the cooler box is filled with bottles comprising 6000 ml of water) and the last is Case D (the cooler box is filled with bottles consisting 9000 ml of water).
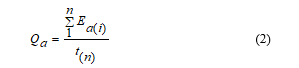
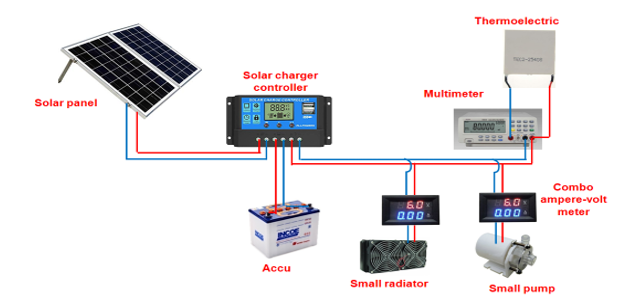 Figure 3: Electrical flow diagram
Table 2: Uncertainty and the operational conditions
| No. | Parameter | Uncertainty | Range of measurements |
| 1 | Temperature (T) | ± 0.2°C | 9.42°C – 48.75°C |
| 2 | Cooling capacity (Qc) | ± 0.12 W | 2.70 W – 20.63 W |
| 3 | Power input (PT) | ± 2 W | 52.74 W – 85.68 W |
| 4 | Pump power (Pp) | ± 0.21 W | 4.86 W – 9.65 W |
| 6 | Power input for system (Ps) | ± 2.8 W | 65.9 W – 100.7 W |
| 7 | COP | ± 0.01 | 0.041-0.34 |
Qa is the heat rate taken from the air (W), t is the time of the running cooler box (s). The energy and the heat rates absorbed by the TE from the water and bottles also can be estimated using equations (1-2) by changing the subscript a to w and b. For water, the energy and the heat rate are noted as Ew and Qw, while for the bottles, they are designated as Eb and Qb. Despite Q from air, water and bottles, Q also came from the ambient through the cooler box walls. This type of heat rate is called the conduction heat rate.![]() where Qk is the conduction heat (W), A is the heat transfer area (m²), L is the wall thickness (m), Two and Twi are the outer and inner wall temperatures (°C). The total heat rate is noted by Qc, it is the cooling capacity (W). Qc is expressed in equation (4), which can be found in Changel and Boles [22].
where Qk is the conduction heat (W), A is the heat transfer area (m²), L is the wall thickness (m), Two and Twi are the outer and inner wall temperatures (°C). The total heat rate is noted by Qc, it is the cooling capacity (W). Qc is expressed in equation (4), which can be found in Changel and Boles [22].
![]() Then the COP is the performance of the TE cooler box that can be expressed as
Then the COP is the performance of the TE cooler box that can be expressed as
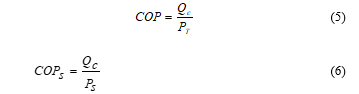 COPs is the coefficient of performance based on all powers supplied to the experimental system. PT is power flowed to the thermoelectric module (TEM) in watt, in the experiment it was measured directly using a multitester. Ps is the total power given to the experimental system such as power for TEM, pump and heat exchanger. All powers required were measured directly. The TE specification used in this study is shown in Table 3.
Table 3: TEM specification
| Model | TEC2-25408 |
| Voltage | 15.54V |
| Vmax (V) | 15.4V |
| Imax (A) | 8 A |
| Qmax (W) | 65 W |
3. Results and Discussion
Experimental results of a TE cooler box performance are presented in the form of graphs. Some recorded temperatures of air, water and bottle are reported in Figure 4. Figure 4 indicates that the ambient temperature increases for all Cases. This phenomenon was due to the time of experiments. The experiments were conducted from 9 o’clock until 12 o’clock local time. Therefore, the ambient temperature increased because the sun elevates with time. At the same time, the ambient temperature was not conditioned. However, the air temperature inside the cooler box for Cases A and B decreased with time, while for Cases C and D remained constant. For Cases C and D, the cooler box could no longer decrease the temperature inside. This was due to the performance of the cooler box. Increasing the volume of water inside the cooler box, the cooler box could not decrease the water temperature further. For Cases A and B, the phenomenon was also found in the previous studies, e.g. [1, 4-5, 19].
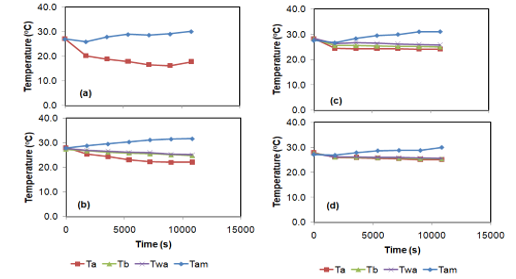 Figure 4: Recorded temperatures of air, water, and bottle inside the cooler box; (a) Case A, (b) Case B, (c) Case C, and (d) Case D
The increased ambient temperature affect greatly the cooling value. The estimated cooling value Qc is presented in Figure 5. For all Cases, the Qc increased with time. This was due to the presence of the conduction heat transfer from the ambient to the inner box through the cooler box walls. Increasing the ambient temperature levelled the difference temperature between the inside and ambient temperatures. Using equation (3) the obtained conduction heat rate increased. The increased conduction heat rate was also found in the previous studies [1, 4-5]. When Qc was dominated by the conduction heat transfer rate, then it increased with time. Nevertheless, in this study, the experiments were run until noon local time, while in [4], the experiments were conducted for 7 hours. Therefore, they found that after the maximum value, the Qc was constant. The problem in this current study was that in the afternoon the sun was covered by the building and trees so that the experiments were stopped. Nevertheless, Qc could not be compared because that was obtained on different days as the cooler box was operated using solar panels. The reason for this was the power given to the system. It could be different on different days.
Another parameter investigated in this study was the COP. Although COP was obtained on different days, it could be compared because COP was cooling capacity per 1-watt power given to the TEC module, see equation (5). The relationship between COP and observation time is presented in Figure 6. The trend of the COP was different from that obtained by researchers in [4]. In [4], the ambient temperature remained constant, it did not increase and the COP increased and then after the peak, it decreased. In this study, the COP did not achieve the maximum value yet. However, Case D had the highest COP. The average COP of Case D was 0.51. Increasing the water volume elevated the COP. Comparing the COP of this study and the previous study indicated that using mini-pin fin got a lower COP than using a mini channel. This comparison did not agree with the results concerning mini and micro pin fins in [13-16]. Nevertheless, the problem, as explained above, was due to the imperfect placement of the mini pin fin. Also, in the previous study, the size of the mini channels was a bigger little bit.
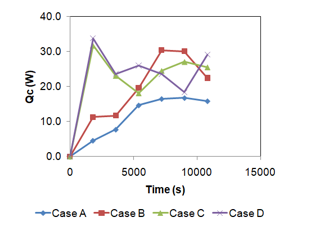 Figure 5: Relationship between Qc and observation time
Additional data given in this study were the performance of the mini-pin fin, which was indicated by the mini pin fin efficiency. The experimental mini-pin fin efficiencies were found ranging from 82% – 93%. The efficiency was important to be reported in this study to know the performance of the mini-pin fin. Those efficiencies were already good, however, the mini-pin fin installation was not perfect. It was difficult to instal the mini pin fin perfectly on the hot side surface of the TEC because between the mini pin fin and the hot side of the TEC, a thermocouple should be placed to measure the hot side temperature of the TEC.
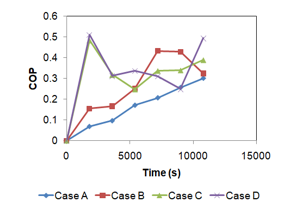 Figure 6: Relationship between COP and time
As the cooler box was run using solar panels, the recorded solar power was presented in Figure 8. Solar power, in general, increased with time. This was a similar trend to the Qc and COP. This was due to the sun that rose along the time, especially in this study, the experiments were conducted from 09.00 to 12.00 local time. However, at midnight local time, all recorded solar powers decreased. This phenomenon was due to surrounding conditions. The solar panels were placed near the building and trees so that starting at 11.30 local time, the solar power panels were shaded. This was also the reason for the short time of running experiments. Due to the sun shaded, the experiments were stopped at 12 local time.
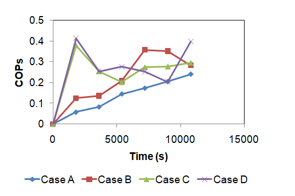 Figure 7: Relationship between COPs and time
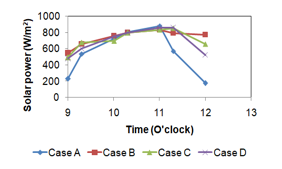 Figure 8: Relationship between solar power and observation time
4. Conclusion
A continuation study to assess the performances of a TE cooler box powered using solar panels with a mini pin fin as the heat removal unit was performed. Increasing the water volume raises the COP and the cooler temperatures. The optimal performance of the TE cooler box is Case B. COP increases with time for these experimental conditions. COP is lower than that obtained using the mini channel heat removal unit in the previous study. The maximum COP is 0.51 and the lower temperature obtained is 18°C. The lower COP is due to the imperfect placement of the heat removal unit. Further experiments need to be conducted to clarify the performance of the mini-pin fin in transferring heat. The parameter that can be compared is COP, but not the others. The solar panels are adequate to power the TE cooler box.
Acknowledgement
The authors would like to admit the DRPM due to the funding through PDUPT research schema 2019 – 2021, and the Department of Mechanical Engineering, the University of Mataram for the facilities.
- M. Mirmanto, S. Syahrul, M. Wirawan, I.M.A. Sayoga, A.T. Wijayanta, I. Mahyudin. “Performance of a thermoelectric powered by solar panel for a large cooler box” Advances in Science, Technology and Engineering Systems Journal, 5, 325-333, 2020.
https://dx.doi.org/10.25046/aj050141. - M.K. Rawat, H. Chattopadhyay, S. Neogi, “A Review on developments of thermoelectric refrigeration and air conditioning systems: A novel potential green refrigeration and air conditioning technology,” Int. J. Engineering Technology and Advanced Engineering, 3, 362-367, 2013.
- B.V.K. Reddy, M. Barry, J. Li, M.K. Chyu, “Enhancement of thermoelectric device performance through integrated flow channels,” Frontiers in Heat and Mass Transfer, 4, 1-7, 2013. https://doi.org/10.5098/hmt.v4.2.3001
- M. Mirmanto, S. Syahrul, Y. Wirdan, “Experimental performances of a thermoelectric cooler box with thermoelectric position variations,” Engineering Science and Technology, An International Journal, 22, 177-184, 2019. https://doi.org/10.1016/j.jestch.2018.09.006
- Mirmanto, I.W. Joniarta, A.T. Wijayanta, Pranowo, M. Habiburrahman, Experimental performance of a cooler box with heat dissipation unit variations,” International Journal of Heat and Technology, 37, 991-998, 2019. https://doi.org/10.18280/ijht.370408
- G. Min, D.M. Rowe, “An improved model for calculating the coefficient of performance of a peltier module,” Energy Conversion and Management, 41, 163–171, 2000.
https://doi.org/10.1016/S0196-8904(99)00102-8 - G. Min, D.M. Rowe, “Symbiotic application of thermoelectric conversion for fluid preheating/power generation,” Energy Conversion and Management, 43, 221–228, 2002.
- S.B. Riffat, X. Ma. “Improving The Coefficient of Performance of Thermoelectric Cooling Systems: A Review” Int. J. Energy Res 28, 753–768, 2004. https://doi.org/10.1002/er.991
- I. Bizzy, R. Apriansyah, “Kaji eksperimental kotak pendingin minuman kaleng dengan termoelektrik bersumber dari arus DC kendaraan dalam rangkaian seri dan paralel,” Seminar Nasional Tahunan Teknik XII, Bandar Lampung, 2013.
- M. Mirmanto, I.B. Alit, I.M.A. Sayoga, R. Sutanto, N. Nurchayati, A. Mulyanto, “Experimental cooler box performance using two different heat removal units: A heat sink fin-fan, and a double fan heat pipe,” Frontiers in Heat and Mass Transfer (FHMT) 10, 1-7, 2018. http://dx.doi.org/10.5098/hmt.10.34
- J. Hejcik, M. Jicha. “Single-phase Heat Transfer in Minichannels” EPJ Web of Conference, 67, 1-4, 2014. http://doi.org/10.1051/epjconf/20146702034
- T. Yeom, T. Simon, T. Zhang, M. Zhang, M. North, T. Cui, “Enhanced heat transfer of heat sink channels with micro pin fin roughened walls,” Int. J. of Heat and Mass Transfer, 92, 617–627, 2016. https://doi.org/10.1016/j.ijheatmasstransfer.2015.09.014
- S.B. Chin, J.J. Foo, Y.L. Lai, T.K.Y. Yong. “Forced Convective Heat Transfer Enhancement with Perforated Pin Fins” Heat Mass Transfer, 49, 1447–1458, 2013.
https://doi.org/10.1007/s00231-013-1186-z - Y. Peles, A. Kosar, C. Mishra, C.J. Kuo, B. Schneider, “Forced convective heat transfer across a pin fin micro heat sink,” International Journal of Heat and Mass Transfer, 48, 3615–3627, 2005. https://doi.org/10.1016/j.ijheatmasstransfer.2005.03.017
- O. Khonsue, “Enhancement of the forced convective heat transfer on mini-pin fin heat sinks with micro spiral fins,” Heat Mass Transfer, 1-8, 2017.
https://doi.org/10.1007/s00231-017-2159-4 - A.S. Tijani, N.B. Jaffri, “Thermal analysis of perforated pin fin heat sink under forced convection condition,” Procedia Manufacturing, 24, 290-298, 2018.
https://doi.org/10.1016/j.promfg.2018.06.025 - S.A. Abdul-Wahab, A. Elkamel, A.M. Al-Damkhi, I.A. Al-Habsi, H.S. Al-Rubai’ey’, A.K. Al-Battashi, A.R. Al-Tamimi, K.H. Al-Mamari, M.U. Chutani, “Design and experimental investigation of portable solar thermoelectric refrigerator,” Renewable Energy, 34, 30-34, 2009. https://doi.org/10.1016/j.renene.2008.04.026
- M. Gillott, L. Jiang, S. Riffat, “An investigation of thermoelectric cooling devices for small-scale space conditioning applications in buildings,” International Journal Of Energy Research, 34, 776-786, 2010. http://doi.org/10.1002/er.1591
- S. Jugsujinda, A. Vora-ud, T. Seetawan, “Analysing of thermoelectric refrigerator performances,” Procedia Engineering, 8, 154-159, 2011.
https://doi.org/10.1016/j.proeng.2011.03.028 - J.P. Holman, Heat transfer, McGraw-Hill Education (India) Pvt Limited, 2002.
- F.P. Incropera, D.P. Dewitt, T.L. Bergman, A.S. Lavine, Fundamentals of heat and mass transfer, Sixth Edition, John Wiley and Sons, USA, 2006.
- Y.A. Cengel, Heat transfer a practical approach, 2nd Edition, Mcgraw-Hill (Tx), 2002.