WordPress database error: [User 'astesjco_WP0QT' has exceeded the 'max_questions' resource (current value: 1)]SELECT wp_posts.* FROM wp_posts WHERE ID IN (53088,53089,53090,53091,53092,53093,53094,53095,53096,53097,53098,53099,53100,53101,53102,53103,53104)
WordPress database error: [User 'astesjco_WP0QT' has exceeded the 'max_questions' resource (current value: 1)]SELECT post_id, meta_key, meta_value FROM wp_postmeta WHERE post_id IN (53088,53089,53090,53091,53092,53093,53094,53095,53096,53097,53098,53099,53100,53101,53102,53103,53104) ORDER BY meta_id ASC
Effect of Nano Clay and Marble Powder Waste as a Hybrid Addition on the Behavior of Normal and High Strength RC Columns Subjected to Axial Compressive Loading
 , Ahmed Hassan Ghallab 1, El-Saaid Ibrahim Zaki 2, Ahmed Sayed Elmannaey 3
Adv. Sci. Technol. Eng. Syst. J. 6(3), 367–384 (2021);
 DOI: 10.25046/aj060343
This paper studied the influence of using hybrid additives of Nano Clay (NC) and Marble Powder (MP) on the structural behavior of columns, in terms of ultimate capacity, axial strain, lateral strain, toughness, and failure pattern. For this purpose, ten column specimens were made from reinforced concrete (RC), either normal or high strength, and were tested under axial compressive loading. It was concluded that, regardless of the concrete strength of the RC columns, the presence of the optimum ratio of the hybrid additives (NC and MP) promotes more ductile behavior of the columns with enhancement in ultimate load capacity. Furthermore, it was found that NC particles act as additional ties on the micro scale level and increase the confinement in the RC columns. Also, the filling effect of MP particles, that strengthened the cement matrix, led to higher increment in the lateral strain and toughness. Briefly, Higher axial load capacity, better ductile performance, greater reduction in the ties ratio and larger dissipation of energy can be achieved by using the optimum hybrid additions of NC and MP in the RC columns.
1. Introduction
After many decades, concrete remains to be the most important construction material in the globe. Therefore, improving its properties, to make it more durable and eco-friendly material, is vital. So, adding pozzolanic and/or waste materials to concrete blends can play this role [1–6]. Also, using nanotechnology in processing these materials can add superior characteristics to them [7–11]. Pozzolanic materials such as slag, fly ash, metakaolin and silica fume, and waste (non-pozzolanic) materials such as, marble, granite and limestone powder can be utilized as a partial replacement of the cementing material in the concrete mix. For instance, kaolinite-based Nano Clay (NC) and Marble Powder (MP) are abundant in the Egyptian environment, which represents a motive for the Egyptian research community to use such materials in fabricating eco-friendly concrete [12,13].
NC possesses two major benefits -when properly added and dispersed- to concrete; its miniature size enhances its pozzolanic activity and leads to consume more calcium hydroxide from the matrix producing calcium silicate hydrate gel. Moreover, its sheet-like form acts as a bridge in the hardened concrete, and consequently, prohibits crack propagation under loading. Both benefits boost the mechanical properties and durability of the concrete [13–22]. Also, MP can be used to replace part of the sand in concrete, thus, result in packing the cement matrix structure and producing denser and more durable concrete. In consequence, the reduction of cement amount and the use of waste material (MP) in concrete means less CO2 emissions, and controlled disposal of waste materials to landfills [23–32].
Although the presence of nanoparticles in concrete mixtures enhances their performance, a few numbers of studies were concerned with its effect on the behavior of structural elements. In [33], the author tested eight beam–column joints under cyclic loading. These joints were casted from concrete with various amounts of fly ash and/or nano silica. It was concluded that the presence of additives, either separate or hybrid, enhanced flexural strength, maximum end deflection and maximum lateral load of the joints compared to control mix joint.
In [34], the author tested sixteen RC beams in flexure to investigate their bending and shear capacities. Group of beams was prepared by adding limestone filler as a partial replacement of cement with silica or alumina nanoparticles, while only nanoparticles were introduced in the second group. The first group experienced degradation in both shear and bending capacities, but on the other side, the second group showed enhancement in shear strength by about 7 to 9% and no significant enhancement in bending capacity.
In [35], the author casted seven RC beams to investigate their flexural behavior under the effect of using 10% of NC, effect of compression reinforcement ratios, flexural reinforcement ratios and characteristic strength of concrete. The addition of NC as cement replacement has a positive influence, compared to control beam, that led to an increase of 122, 107, 107 and 125% for initial crack load, ultimate load, maximum deflection and toughness, respectively, with minimum compression reinforcement ratio of 0.44 and minimum flexural reinforcement ratio of 1.29%.
In [36], the author prepared seven RC beams to investigate the effect of using 10% of NC and variation of characteristic concrete strength (fcu) on the shear behavior of the beams. For fcu equal 25 MPa, the addition of NC as cement replacement has a positive influence that led to an increase of 31.5%, 7.4% and 17.6% for initial crack load, ultimate load and toughness, respectively, compared to normal control beam. Moreover, the improved percentages for initial crack load, ultimate load and toughness of beam with 35 MPa concrete grade and with 10% NC were about 28%, 9.3% and 12.6%, respectively, compared to beam with 25 MPa concrete grade and with 10% NC.
In [37], the author prepared seven inverted T-section beams to investigate the effect of using 1% of Nano-Silica (NS) and the effect of flexural and shear reinforcement ratios on the flexural and shear behavior of the beams. Initial crack load, ultimate load and toughness of inverted T- beam with 1% NS as cement replacement improved by 31.4%, 6.6% and 16.65%, respectively, compared to control beam. In addition, the failure of the beam with 1% NS changed from flexure to flexure-shear mode and its cracks spacing were lesser compared to control beam.
In [38], the author tested four RC slabs which contained MP as replacement of cement with different ratios (0, 2.5, 5, and 7.5%). It was observed that, in all slabs containing different ratios of MP, the initial crack load and ultimate load increased compared to control slab. The best performance of RC slab was observed by using 5% MP with improved percentages of initial crack load, ultimate load and maximum deflection of about 20%, 10% and – 4.6 %, respectively. In addition, using 5% of MP in RC slab decreased the number of cracks compared to the control slab, however, the number of cracks increased as the percentage of MP exceeded 5% in the mix increased.
Based on the available literature, the vast majority of research studies dealt with additives effect on concrete behavior from material point of view. On the other hand, the effect of additives on the performance of RC structural elements is still developing and needs to be under spotlight. The present study focuses on the behavior of either ordinary or high strength RC columns, with optimum ratios of NC and MP to take a wide step towards determining structural behavior/properties of concrete elements instead of only determining materials properties. Firstly, different concrete mixes were prepared with different ratios of NC and MP. Secondly, the optimum NC and MP ratios were elected to be used in casting the RC columns. Finally, the obtained test results were interpreted and compared to conventional concrete to reach an augmented comprehension of the behavior of this structural element.
2. Experimental Program
2.1. Overview
Based on an earlier research study conducted by the authors [39], Normal Strength Concrete (NSC) and High Strength Concrete (HSC) mixes were prepared with hybrid additions of various amounts of NC and MP. Also, many mixing techniques (sonicating, stirring and sprinkling after stirring) were adopted to guarantee the success of NC dispersion in the mix. After that, the mechanical performance of the mixes such as, compressive, flexure, splitting and bonding strengths were assessed at the age of 7 and 28 days. Additionally, permeability of the samples was determined, and microstructure of the mixes was captured. It was concluded that the best physical/mechanical performance of concrete mixes can be achieved by using nearly 3% NC and 10% MP additives ratios by weight of cement and sand, respectively. Also, sprinkling after stirring dispersion technique was an effective and practical mean of mixing to overcome NC agglomeration problem in concrete blends. The improvement in performance of concrete mixes can be attributed to three mechanisms; 1- the efficiency of NC in packing the voids by promoting pozzolanic reaction that formed additional C-S-H by consuming calcium hydroxide crystals, 2- the bridging effect of sheet-like NC particles which strengthened the cement matrix by preventing crack propagation, and 3- the filling effect of MP that strengthened cement matrix and the transition zone surrounding aggregates.
2.2. Concrete Mix Materials
The materials used in this study for concrete blends were Ordinary Portland Cement (OPC) (CEMI/52.5R) in accordance with ASTM C150 [40]. While, fine aggregates were natural siliceous sand with fineness modulus of 2.5, and coarse aggregates were crushed clean dolomite with nominal maximum size of 19.0 mm. Also, mineral additives of NC and MP were used for NSC, and Silica Fume (SF) was used in addition to NC and MP for HSC. For specimens’ reinforcement, deformed high tensile steel was used for the longitudinal column reinforcement with actual grade 524/661 (yield stress/ultimate stress, MPa) whereas the transverse column reinforcement was formed from mild tensile steel with actual grade 358/517. The longitudinal and transverse column reinforcement conformed to ES 262-1/2009 [41] and ES 262-2/2009 [42], respectively.
The NC used in this study was amorphous nano-metakaolin with mean particle size distribution of 87.13 μm. The mean particle size distribution of MP was 7.25 μm. Silica Fume (SF) corresponds with the requirements of ASTM C 1240-03a [43]. High Performance Superplasticizer (SP), which is an aqueous solution of modified polycarboxylates, was used to obtain a required average slump within range of 100 to 200 mm. SP complied with EN 934-2 [44]. Tap water was used for both mixing and curing.
2.3. Concrete Mixture Proportions
Four mixes were prepared; two without NC and MP additives, while the other two mixes were supplied with additives. Table 1 shows the proportions of each concrete blend and the targeted compressive strength of each mix. The compressive strength test was conducted for the four mixes on standard cubes of size 150mm to obtain the fcu according to BS EN 12390-3 [45].
2.4. Timber Formwork and Steel Reinforcement
Timber formworks were prepared and leveled horizontally for specimens casting. The steel reinforcement cages of specimens were aligned in the timber forms and adjust concrete clear cover to 20 mm. The longitudinal columns reinforcement was deformed steel bars of 10 mm, whereas, the transverse columns reinforcement was mild steel bars of 8 mm. The longitudinal reinforcement number and transverse reinforcement spacing are shown in Figure 1 and Table 2. At columns specimen ends, two precautions were adopted to prevent premature load failure occurrence at these locations that may result from stress concentration near points of load application as follows, a- the longitudinal bars were flexed horizontally to achieve full bond with concrete leading to resisting compression concentration at ends, b- additional ties were added to enhance confinement at ends of RC columns.
2.5. Concrete Proportions, Mixing and Curing Procedure
For concrete mixes with no additives, all the ingredients were added in the mixer and mixed for two minutes. On the other hand, mixes with additives were prepared by adding SP to mixing water and blended until obtaining homogenous solution. Then, 70% of this solution was utilized to stir and disperse NC using vane motor at about 2000 rpm speed for 2 min. At the same time, cement, aggregates, MP and SF (if added) were dry mixed in a rotary mixer for 1 min. After that, the remaining water-SP solution was added to the blend and mixed for additional 1 min. Finally, the ready stirred NC solution was manually sprinkled during mixing into rotary mixer for additional 3 min. to achieve the desired homogeneity. The fresh concrete was casted in the prepared column specimen forms. The concrete blends were consolidated using electrical vibrator to produce well compacted concrete without either voids or honeycomb. After one day from casting, specimens were de-molded from forms and cured by wrapping with wet burlap for 28 days at the laboratory conditions of 25 ºC temperature. At the end of curing process, RC columns were unwrapped to dry by keeping in the open lab environment into preparation for testing.
2.6. Columns Specimens
Ten square (150×150) RC columns with and without hybrid additions (NC and MP) tested under concentrated axial loading to determine their ultimate capacity, axial strain, lateral strain, toughness, and failure pattern. The parameters that were considered in this study were: material parameters; hybrid additives presence and concrete strength, and structural parameters; columns length (slenderness ratio), transverse and longitudinal steel bars ratio. Table 2 shows all the characteristics of the fabricated columns. As can be seen from Table 2, two target concrete strength were selected: 50 and 70 MPa, to represent NSC and HSC, respectively. The height of columns ranged from 1000mm to 2500mm to represent short or long columns, respectively. Also, the ratio of longitudinal reinforcement area to column cross sectional area (ρ%) had two values of about 1.4% to 2.8%, while the ratio of tie bars volume to column volume (ρv%) ranged between 0.5% to about 1%. Figure 1 depicts the concrete dimensions and steel reinforcement of the casted columns.
2.7. Testing Procedures and Instrumentation
Columns specimens were tested under concentric axial compression using hydraulic loading machine with a capacity of 2000 KN. The axial loading was applied via displacement control, at a rate of 0.5 mm/min, to monitor response of columns specimens beyond peak capacity. The monotonic axial loading was regulated to increase gradually till failure. Two rigid steel caps shown in Figure 2, 150 mm wide, were fabricated for confining the ends of the specimen to ensure preventing premature failure at these locations resulted from stress concentration near points of load application. Before testing, each specimen was aligned vertically until matching the centerline of the specimen with the line of axial load application. To measure axial and lateral strains of the tested specimen, three Linear Variable Differential Transformers (LVDTs) were used as shown in Figure 2. The L1 transducer was mounted at the bottom of the upper steel cap to measure axial displacement. The L2 and L3 transducers were mounted at mid height of the tested specimen on two perpendicular faces to measure lateral displacements. The average lateral deformation recorded using the L2 and L3 transducers was used to plot the lateral load-strain response of the columns.
Table 1: Mixing proportions of Concrete Blends
| NSC | HSC | |||
| Mix No. | 1(N)* | 2(A)** | 3(N) | 4(A) |
| Target fcu (MPa) | 50 | 50 | 70 | 70 |
| Cement (Kg/m³) | 400 | 339.5 | 450 | 391.5 |
| Sand (Kg/m³) | 780 | 702 | 720 | 648 |
| Agg. (Kg/m³) | 1150 | 1150 | 1145 | 1145 |
| Water (L/m³) | 183 | 160 | 160 | 145 |
| SP (L/m³) | 5.8 | 6.13 | 10.8 | 11.25 |
| NC (Kg/m³) | — | 10.5 | — | 13.5 |
| MP (Kg/m³) | — | 78 | — | 72 |
| SF (Kg/m³) | — | — | 50 | 45 |
| Water/binder | 0.457 | 0.457 | 0.32 | 0.32 |
*N: No additives **A: Additives (3%NC and 10%MP)
Two electric resistance strain gauges (G1 and G2) were installed on one of the longitudinal and transverse reinforcement bars at the mid height of the tested specimen as shown in Figure 1. Load and displacement measurements were monitored and recorded using an automatic data acquisition software.
3. Parametric Study
Specimens were classified into groups to manage the collected test data. Thus, the parametric study incorporated hybrid materials presence, concrete strength, slenderness ratio, longitudinal and transverse reinforcement ratios. Table 3 clarifies the groups of column specimens and the studied parameters of each group.
4. Analysis and Discussion of Test Results
The effect of the studied factors on the behaviour of the tested columns is compared using three factors: ultimate strength, ductility and toughness. Figures 3 and 4 show the failure patterns of tested specimens.
Table 2: Scheme of the Tested Column Specimens
| ID | Target fcu (MPa) | Column Height H(mm) | Slenderness Ratio (λ) | Long. Bars | Trans. Bars | ||
| L. Bars (fy=360MPa) | ρ % | Ties (fy=240MPa) | ρv % | ||||
| C1N* | 50 | 1000 | 6.67 | 4Φ10 | 1.39 | Ø8-200 | 0.5 |
| C2N | 50 | 1000 | 6.67 | 4Φ10 | 1.39 | Ø8-160 | 0.65 |
| C3A** | 50 | 1000 | 6.67 | 4Φ10 | 1.39 | Ø8-200 | 0.5 |
| C4A | 50 | 1000 | 6.67 | 4Φ10 | 1.39 | Ø8-160 | 0.65 |
| C5A | 50 | 1000 | 6.67 | 4Φ10 | 1.39 | Ø8-100 | 0.98 |
| C6A | 50 | 2000 | 13.33 | 4Φ10 | 1.39 | Ø8-200 | 0.5 |
| C7A | 50 | 2500 | 16.67 | 4Φ10 | 1.39 | Ø8-200 | 0.5 |
| C8A | 50 | 1000 | 6.67 | 8Φ10 | 2.78 | Ø8-200 | 0.5 |
| C9N | 70 | 1000 | 6.67 | 4Φ10 | 1.39 | Ø8-200 | 0.5 |
| C10A | 70 | 1000 | 6.67 | 4Φ10 | 1.39 | Ø8-200 | 0.5 |
*N: No additives **A: Additives (3%NC and 10%MP)
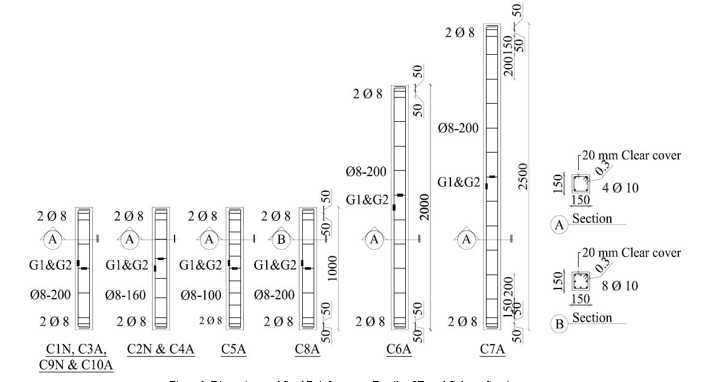 Figure 1: Dimensions and Steel Reinforcement Details of Tested Column Specimens.
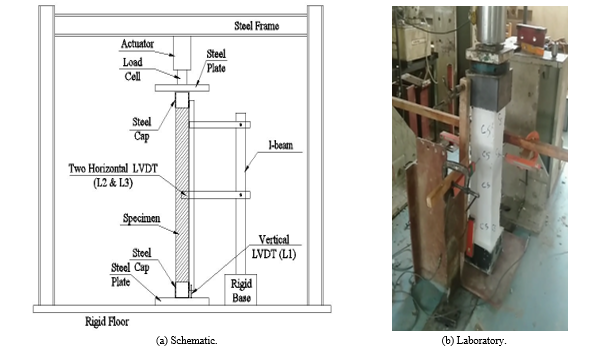 Figure 2: Columns Instrumentation and Test Setup.
Table 4 summarizes the maximum axial load (Pc), the maximum axial strain (εc), the maximum lateral strain (εL) and toughness parameter (Au) for all tested columns.
In the following sections, the results of the experimental program were presented and the effect of each parameter in the parametric study is discussed.
4.1. Failure patterns
Failure locations of RC columns are presented in Figure 3. Failure occurred at two locations; the first is at the top or bottom end of the column specimen which indicating the stress concentration at the ends of the columns, while the second is at the mid third of the column height. Moreover, the bond failure (i.e. slip or separation) between concrete and steel bars could be one more reason for the appearance of end effect [46, 47].
The failure mechanisms of the tested columns were almost the same except for those columns made of HSC as they failed more suddenly in a higher brittle mode. The failure sequence for the columns was as follows: During increasing the applied load cracks occurred before the ultimate load was reached at the failure location, eventually, the concrete cover was spalled off. Finally, the tested columns were failed by crushing of concrete core in addition to yielding/buckling of longitudinal and/or transversal steel bars.
Most of the longitudinal steel bars were yielded and buckled as shown in Figure 4a. For the ties, some of them were yielded and broken due to necking, as shown in Figure 4b. The results of the tested columns in each group is presented and compared in Table 4.
4.2. Effect of Hybrid Additives Presence on RC columns (Group1)
The effect of hybrid additives on the behavior of RC columns was investigated in NSC columns with and without hybrid additives (C1N compared to C3A and C2N compared to C4A) and HSC columns with and without hybrid additives (C9N compared to C10A). Due to the presence of hybrid additives in columns concrete mixtures, the strength and post-peak strains of the columns increased noticeably as observed from the comparison of the test data and the results shown in Table 4 and Figure 5.
As can be seen, the presence of hybrid additions in the column concrete mixture improved the maximum load compared to columns without hybrid additions. This can be attributed to the enhancement in the tensile strength property of the column concrete mixture resulting from NC particles in shape of sheets that act as bridge connecting both sides of the crack together preventing crack propagation which compatible with [15,39], subsequently, NC particles act as additional ties for the column but on the micro scale level. Moreover, the filling effect of MP that strengthened cement matrix and the transition zone surrounding aggregates has a role in this improvement.
For NSC columns with and without hybrid additives, in case of ties ratio = 0.5%, the maximum load of C3A compared to C1N increased from Pc=770KN to 834KN with an improvement of about 8%, while in case of ties ratio = 0.65%, the maximum load of C4A compared to C2N increased from Pc=835KN to 925KN with an improvement of about 11%. On the other hand, for HSC columns with and without hybrid additives, the maximum load of C10A compared to C9N increased from Pc=1261KN to 1372KN with an improvement of about 9% (see Table 4 and Figures 5 and 6).
For post-peak strains, for NSC columns with and without hybrid additives, the improvement in the axial strain of C3A slightly improved compared to C1N (about 4.5%), while the lateral strain of C3A significantly improved compared to C1N reaching about 16.7% indicating an important enhancement in post-peak ductility. In addition, the axial strain of C4A slightly improved compared to C2N reaching about 6%, while the lateral strain of C4A significantly improved compared to C2N reaching about 18%.
Table 3: Groups of column specimens and the studied parameters of each group.
| Groups | Studied Parameter | Column ID | Hybrid Materials% | Column Sizes mm x mm | Column Height mm | Slenderness Ratio (λ) | Actual Fcu (Mpa) | Long bars | Lateral confinement |
||
| L.
Bars |
ρ % | Ties | ρv % | ||||||||
| G1 | Hybrid Materials Presence | C1N | — | 150×150 | 1000 | 6.67 | 48.7 | 4Φ10 | 1.39 | Ø8-200 | 0.5 |
| C3A | 3%NC,
10%MP |
51.2 | |||||||||
| C2N | — | 48.7 | Ø8-160 | 0.65 | |||||||
| C4A | 3%NC,
10%MP |
51.2 | |||||||||
| C9N | — | 68.9 | Ø8-200 | 0.5 | |||||||
| C10A | 3%NC,
10%MP |
72.1 | |||||||||
| G2 | Concrete Strength (Fcu) | C1N | — | 1000 | 6.67 | 48.7 | 4Φ10 | 1.39 | Ø8-200 | 0.5 | |
| C9N | 68.9 | ||||||||||
| C3A | 3%NC,
10%MP |
51.2 | |||||||||
| C10A | 72.1 | ||||||||||
| G3 | Ties Ratio (ρv%) | C1N | — | 1000 | 6.67 | 48.7 | 4Φ10 | 1.39 | Ø8-200 | 0.5 | |
| C2N | Ø8-160 | 0.65 | |||||||||
| C3A | 3%NC,
10%MP |
51.2 | Ø8-200 | 0.5 | |||||||
| C4A | Ø8-160 | 0.65 | |||||||||
| C5A | Ø8-100 | 0.98 | |||||||||
| G4 | Slenderness (λ) | C1N | — | 1000 | 6.67 | 48.7 | 4Φ10 | 1.39 | Ø8-200 | 0.5 | |
| C3A | 3%NC,
10%MP |
51.2 | |||||||||
| C3A | 3%NC,
10%MP |
1000 | 6.67 | 51.2 | |||||||
| C6A | 2000 | 13.33 | |||||||||
| C7A | 2500 | 16.67 | |||||||||
| G5 | Longitudinal bars (ρ%) | C1N | — | 1000 | 6.67 | 48.7 | 4Φ10 | 1.39 | Ø8-200 | 0.5 | |
| C3A | 3%NC,
10%MP |
51.2 | |||||||||
| C3A | 3%NC,
10%MP |
51.2 | 4Φ10 | 1.39 | |||||||
| C8A | 8Φ10 | 2.78 | |||||||||
Also, for HSC columns with and without hybrid additives, the axial strain of C10A slightly improved compared to C9N reaching about 5%, while the lateral strain of C10A significantly improved compared to C9N reaching about 17% (see Table 4 and Figures 5 and 6). The higher increment in the lateral strain has been achieved with the aid of additional confinement offered by the presence of NC sheets that enhance the tensile property of concrete mixture as previously discussed.
The effect of hybrid additives on strength and ductility of RC columns with ties ratio = 0.65% (C4A compared to C2N) was more noticeable than columns with ties ratio = 0.5% (C3A compared to C1N). This resulted from the enhancement of the bond strength between steel reinforcement and concrete due to hybrid additives which is compatible with [15, 39]. As a result of the increase in the ties ratio and the obtained bond strength led to achieve more load capacity and enhanced post-peak strains.
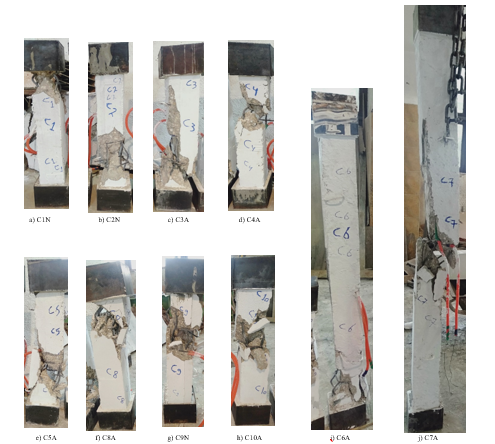 Figure 3: Failure Pattern for Each Column Specimen.
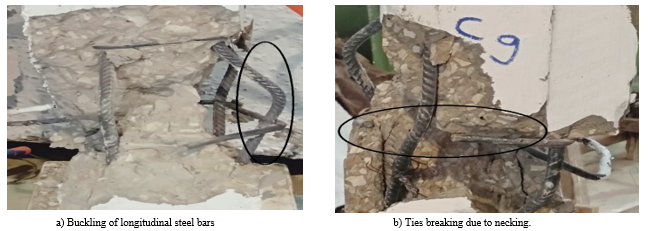 Figure 4: Failure Pattern of the Steel Bars.
Table 4: Test Results of the Tested RC Columns
| (Groups)
& Parameters |
Column ID | Actual Fcu (Mpa) | Maximum Axial Load | Axial Strain | Lateral Strain | Toughness | ||||
| Pc
(KN) |
±%* | εcx10-3 | ±% | εLx10-3 | ±% | Au (KN) | ±% | |||
| (G1) Hybrid Additive Presence | C1N | 48.7 | 770 | — | 5.50 | — | 8.0 | — | 3167 | — |
| C3A | 51.2 | 834 | +8.31 | 5.75 | +4.55 | 9.33 | +16.7 | 3606 | +14 | |
| C2N | 48.7 | 835 | — | 5.80 | — | 10.0 | — | 3700 | — | |
| C4A | 51.2 | 925 | +10.8 | 6.15 | +6.03 | 11.8 | +18.0 | 4581 | +24 | |
| C9N | 68.9 | 1261 | — | 4.95 | — | 7.33 | — | 4641 | — | |
| C10A | 72.1 | 1372 | +8.8 | 5.20 | +5.05 | 8.60 | +17.3 | 5228 | +13 | |
| (G2) Concrete Strength (Fcu) | C1N | 48.7 | 770 | — | 5.50 | — | 8.0 | — | 3167 | — |
| C9N | 68.9 | 1261 | +63.8 | 4.95 | -10.0 | 7.33 | -8.33 | 4641 | +46 | |
| C3A | 51.2 | 834 | — | 5.75 | — | 9.33 | — | 3606 | — | |
| C10A | 72.1 | 1372 | +64.5 | 5.20 | -9.57 | 8.60 | -7.86 | 5300 | +47 | |
| (G3)
Ties Ratio (ρv%) |
C1N | 48.7 | 770 | — | 5.50 | — | 8.0 | — | 3167 | — |
| C2N | 835 | +8.44 | 5.80 | +5.45 | 10.0 | +25 | 3700 | +17 | ||
| C3A | 51.2 | 834 | — | 5.75 | — | 9.33 | — | 3606 | — | |
| C4A | 925 | +10.9 | 6.15 | +6.96 | 11.8 | +26.4 | 4581 | +27 | ||
| C5A | 998 | +19.7 | 6.50 | +13.0 | 14.3 | +53.6 | 5165 | +43 | ||
| (G4)
Slenderness (λ) |
C1N | 48.7 | 770 | — | 5.50 | — | 8.0 | — | 3167 | — |
| C3A | 51.2 | 834 | +8.31 | 5.75 | +4.55 | 9.33 | +16.7 | 3606 | +14 | |
| C3A | 51.2 | 834 | — | 5.75 | — | 9.33 | — | 3606 | — | |
| C6A | 733 | -12.1 | 2.65 | -53.9 | 27.3 | +193 | 1463 | -59 | ||
| C7A | 690 | -17.3 | 2.0 | -65.2 | 30.7 | +229 | 1036 | -71 | ||
| (G5)
Long bars (ρ%) |
C1N | 48.7 | 770 | — | 5.50 | — | 8.0 | — | 3167 | — |
| C3A | 51.2 | 834 | +8.31 | 5.75 | +4.55 | 9.33 | +16.7 | 3606 | +14 | |
| C3A | 51.2 | 834 | — | 5.75 | — | 9.33 | — | 3606 | — | |
| C8A | 717 | -14.0 | 6.0 | +4.35 | 9.67 | +3.57 | 3257 | -9.7 | ||
* ±%: Indicates percentage of increase/decrease in value relative to reference column which is the first column in each group.
For the toughness parameter in case of NSC columns with and without hybrid additives, the increment in toughness of C3A compared to C1N and C4A compared to C2N reached about 14% and 24%, respectively. Moreover, in case of HSC columns with and without hybrid additives, the gain in toughness for C10A reached 13% compared to C9N (see Table 4 and Figure 6).
In summary, the results for group1 columns indicated that the hybrid additives presence on the behavior of either NSC or HSC RC columns led to enhanced strength and ductility of that columns. Also, it should be noted that columns with hybrid additives and with tie ratio 0.5% not only failed at almost the same axial load of column with higher tie ratio 0.65% and without additive (C3A and C2N) but also had higher ductility and toughness.
4.3. Effect of the Concrete strength Fcu (Group2)
The variation in concrete strength was investigated in NSC and HSC columns specimens without additives (C1N compared to C9N) and with hybrid additives (C3A compared to C10A). Due to the increase in concrete strength and as expected, the maximum axial load of C9N increased noticeably compared to C1N as observed from the comparison of the test data and the curves shown in Table 4 and Figure 7. However, for similar columns but with hybrid additive, the increase in column strength was slightly higher compared to columns without hybrid additive.
For post-peak strains in case of increasing concrete strength, for NSC and HSC columns without hybrid additives, the declination in the axial and lateral strains of C9N compared to C1N reached 10% and 8.33%, respectively, while for columns made of NSC and HSC with hybrid additives the declination in the axial and lateral strains of C10A compared to C3A reached 9.57% and 7.86%, respectively. As can be seen, the enhancement in column post- peak ductility due to the hybrid additive was slightly higher in case of NSC and HSC (see Table 4 and Figures 7 and 8). Moreover, the decrease in the axial and lateral strains have been obtained and expected due to the increase in the brittleness of concrete, resulted from the increased concrete strength which is compatible with [39,48].
For the toughness parameter in case of increasing concrete strength, the increment in toughness of C9N compared to C1N and C10A compared to C3A reached about 46% and 47%, respectively (see Table 4 and Figure 8).
In summary, the results for group2 columns indicated that increasing the concrete strength led to the enhancement of strength and toughness in columns, but the decrease of the post-peak strains was obtained. Also, it should be noted that columns with hybrid additives when casted of higher concrete strength blends, slight improvement in axial load, ductility and toughness was achieved in comparison to columns without additives.
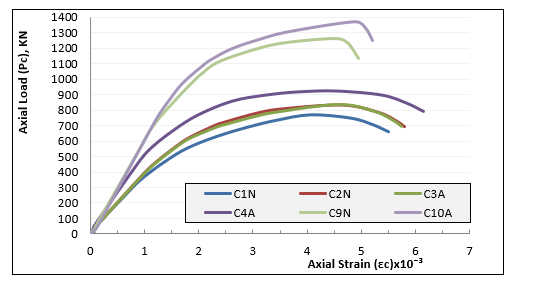 Figure 5: Load-Strain Curve for Group 1.
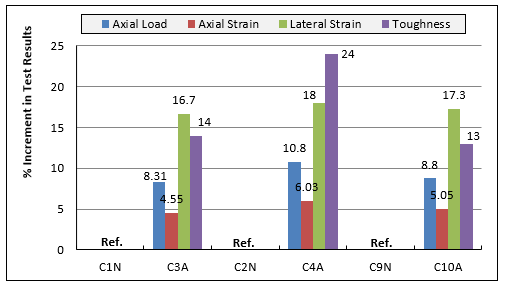 Figure 6: Percent Increment in Test Results for Group 1.
4.4. Effect of Ties Ratio ρv % (Group3)
The effect of increasing ties ratio (ρv %) of columns with hybrid additives was investigated in NSC columns (C3A compared to C4A and C5A), also, the behavior of these three columns and C2N was compared to column C1N to give an idea about how much the presence of additives did affect the response of these columns. Due to the presence of ties and under axial compressive loading the columns specimens turned out to be in a tri-axial compressive status. As the ties ratio increases, the confinement capacity on the RC columns increases significantly. This makes the strength and post-peak strains of the columns increase noticeably as observed from the comparison of the test data and the curves shown in Table 4 and Figure 9.
The effect of increasing ties ratio from 0.5% to 0.65% can be obtained by comparing C1N and C2N. As can be seen, the failure load of C2N increased by 8.44% (compared to C1N). For similar columns but with hybrid additives (C3A and C4A), the increase in strength of C4A was 10.9% compared to C3A (see Table 4 and Figures 9 and 10).
For post-peak strains in case of increasing ties ratio from 0.5% to 0.65%, for NSC columns without additives, the axial strain of C2N slightly improved compared to C1N by about 5.5%, while the lateral strain of C2N significantly improved compared to C1N by about 25%, while for NSC columns with hybrid additives, the axial strain of C4A slightly improved compared to C3A with about 7%, while the lateral strain of C4A significantly improved compared to C3A with about 26.5% indicating obvious enhancement in post-peak ductility (see Table 4 and Figures 9 and 10). The high increment in the lateral strain has been achieved with the aid of additional confinement offered by increasing the ties ratio and the hybrid additives presence.
The other comparison of columns in this group was among columns C1N on one hand and columns C2N, C3A, C4A and C5A on the other hand. This comparison may help to give a clearer idea about the effect of additives presence in conjunction with the effect of ties ratio of columns on the response of these columns to axial loading. For instance, and when comparing the results of C4A (ρv=0.65%) to C1N (ρv=0.5%), a gain in the axial capacity has reached about 20%. This gain is about 2.4 that of C2N (ρv=0.65%) relative to C1N as shown in Figure 11. Also, the axial flexibility and toughness of C4A compared to C1N have experienced an incrementation of about 12 and 45%, respectively. Moreover, the obtained lateral strains have reached about 48%.
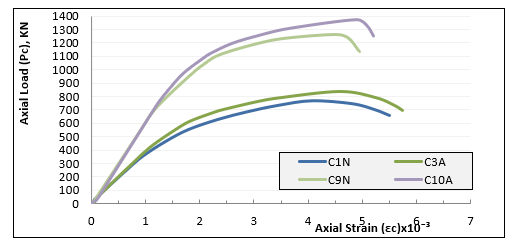 Figure 7: Load-Strain Curve for Group 2.
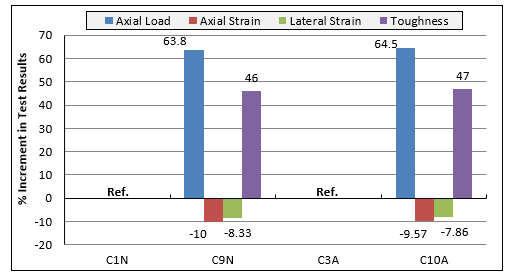 Figure 8: Percent Increment in Test Results for Group 2.
The presence of hybrid additives in RC columns (C4A compared to C3A) enhanced the column behavior in strength and ductility parameters in a higher pace than NSC columns (C2N compared to C1N). This can be attributed to the positive role of hybrid additives in boosting the tensile strength of concrete mixture as NC particles act as additional ties for the column but on the micro scale level. Moreover, the filling effect of MP that has strengthened cement matrix and the transition zone surrounding the aggregates.
Also, the more the ties ratio is (as for C5A compared to C3A), the more improvement in the maximum load was achieved 19.7% improvement ratio. And for post-peak strains, more improvement in the axial and lateral strains was achieved for C5A compared to C3A which reached 13% and 53.6%, respectively (see Table 4 and Figures 9 and 10).
Moreover, it was observed that the behavior of columns with hybrid additions (C3A with low ties ratio) almost resembles the behavior of columns of no additives (C2N with high ties ratio) with respect to strength and ductility. This emphasizes the significant effect of additives on the behavior of columns.
For the toughness parameter in case of increasing ties ratio from 0.5% to 0.65%, the increment in toughness of C2N compared to C1N, and C4A compared to C3A reached about 17% and 27%, respectively. Moreover, when raising the ties ratio from 0.5% to 0.98%, a gain in toughness for C5A reached 43% compared to C3A (see Table 4 and Figure 10).
In summary, the results for group3 columns indicated that increasing the amount of confinement through increasing of ties ratio led to strength and ductility enhancement in columns. Furthermore, it was noted that the hybrid additive presence offered additional confinement in RC columns.
4.5. Effect of the Slenderness Ratio of Columns (Group4)
The effect of increasing slenderness ratio (λ) of columns with hybrid additives was investigated in NSC columns (C3A compared to C6A and C7A), also, the behavior of these three columns was compared to column C1N to give an idea about how much the presence of additives did affect the response of these columns. As expected, the increase of slenderness ratio of
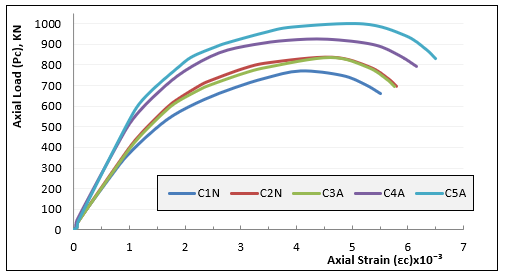 Figure 9: Load-Strain Curve for Group 3
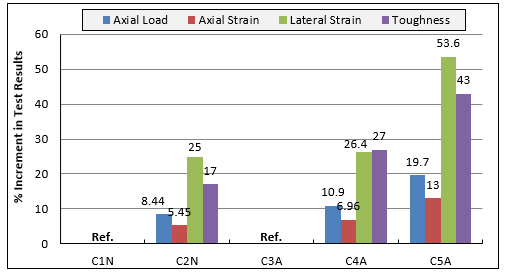 Figure 10: Percent Increment in Test Results for Group 3
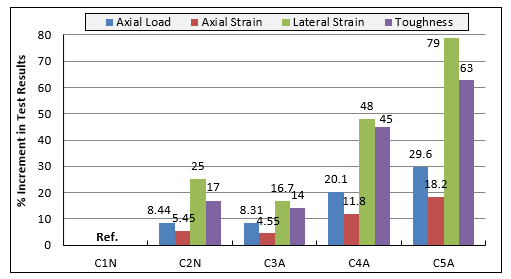 Figure 11: Percent Increment in Test Results for Group 3 Compared to Column C1N
columns led to a decrease in their maximum axial load. For instance, and when comparing the results of C7A to C3A, the reduction in the axial capacity has reached about 17%. Also, its axial flexibility and its toughness have experienced a degradation of about 65 and 70%, respectively. Moreover, the obtained lateral strains have exceeded the 200%, see Table 4 and Figure 12. Also, Figure 13 shows that the ultimate axial strain of column C7A, for example, is about one third that of column C3A. The results of C7A compared to C3A confirm that the higher slenderness ratio of columns gives the chance of higher lateral strains and consequently possibility of inelastic buckling appearance and loss of ductility and axial capacity of columns.
The second comparison was between the three columns (C3A, C6A and C7A) and column C1N. This comparison may help to give a clearer idea about the effect of additives presence in conjunction with the effect of slenderness ratio of columns on the response of these columns to axial loading. For instance, and when comparing the results of C7A to C1N, the reduction in the axial capacity has reached about 10% as shown in Figure 14. Also, its axial flexibility and its toughness have experienced a degradation of about 64 and 67%, respectively. Moreover, the obtained lateral strains have exceeded the 250%.
In summary, the results for group 4 columns indicated that the existence of inelastic buckling through increasing of slenderness ratio led to declining strength and ductility of RC columns.
4.6. Effect of the Longitudinal Steel Bars Ratio ρ% (Group5)
The effect of increasing long. bars ratio (ρ%) of columns with hybrid additives presence was investigated in NSC columns with hybrid additive and variable ρ% (C3A compared to C8A), also, both column test results were compared to NSC column C1N. unexpectedly, column C8A (which has twofold increase in reinforcement ratio of C3A) has shown less axial capacity and higher ductility than C3A, and this may be attributed to the higher load portion transferred to the longitudinal reinforcement. In consequence, local buckling of longitudinal bars has prematurely occurred, and column exhibited lower axial capacity and higher ductility, see Table 4 and Figures 15 and 16. By inspecting Figure 16, the comparison between columns C8A and C3A has shown loss of axial capacity and toughness of about 14% and 10%, respectively. On the other hand, the increase in axial and lateral strains has reached about 4% for both test results.
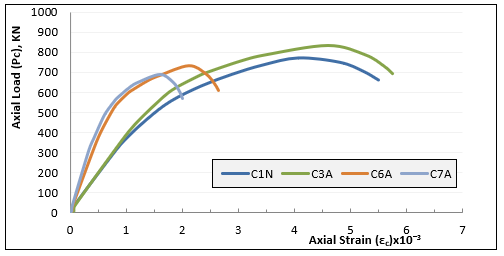 Figure 12: Load-Strain Curve for Group 4
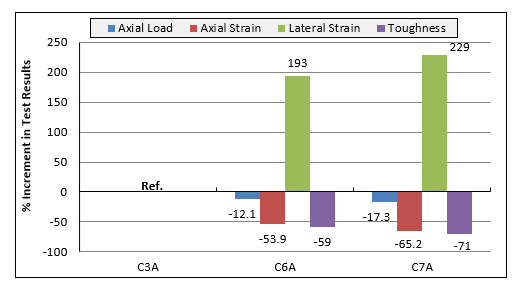 Figure 13: Percent Increment in Test Results for Group 4.
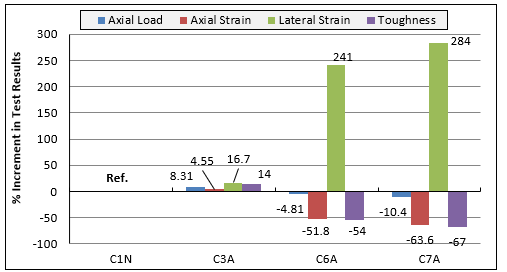 Figure 14: Percent Increment in Test Results for Group 4 Compared to Column C1N.
The other comparison of columns in this group was among columns C1N on one hand and columns C3A and C8A on the other hand. As can be seen from Figure 17, for instance, the comparison between columns C8A and C1N has shown loss of axial capacity of about 7%. On the other hand, the increase in axial strain, lateral strain and toughness has reached about 9%, 21% and 3%, respectively.
In summary, the results for group 5 columns indicated that increasing of long bars ratio led to declining strength and enhancing post-peak strains in columns.
4.7. Theoretical Evaluation of the Experimental Results
In this part, the experimentally evaluated ultimate axial compression load of the NSC/HSC columns with and without hybrid additive were compared with standard codes. Therefore, for each specimen, the calculated capacities according to different codes requirements [49–51]were determined and compared to the experimental results as shown in Table 5 and Figure 18. For each code method, all reduction factors of safety as materials and resistances factors were used to give thorough and reliable comparison between the calculated and experimental capacities that design engineer can effectively use to design such elements. The standard equations used in this study are mentioned below for each code:
ACI 318-18:
Pu= 0.8 Ø (0.85 fc’ (Ac-Ast) +Fy. Ast (1) [49]
Eurocode 2-2006:
Pu= 0.567. fc’. Ac + 0.87. Fy. Ast (2) [50]
ECP 203-2018:
Pu= 0.35. Fcu (Ac-Ast) + 0.67.Fy. Ast (3) [51]
Where, Fcu: Cube Concrete characteristics strength (MPa); fc’: Cylinder Concrete characteristics strength (MPa); Ac: total cross sectional of column(mm2); Ast: total cross sectional of longitudinal bars (mm2); Fy: yield strength of longitudinal bars (MPa), Ø: Strength reduction factor.
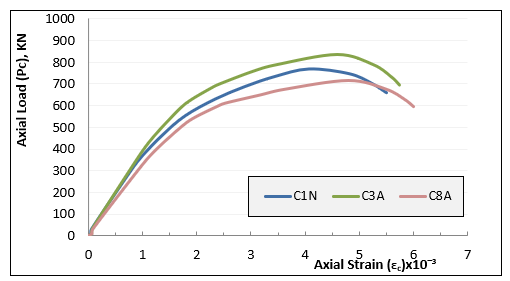 Figure 15: Load-Strain Curve for Group 5
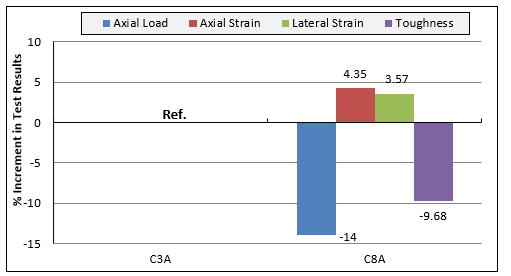 Figure 16: Percent Increment in Test Results for Group 5
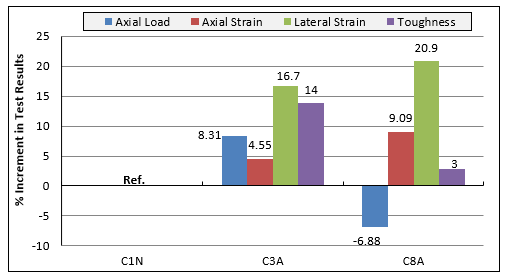 Figure 17: Percent Increment in Test Results for Group 5 Compared to Column C1N
Referring to Table 5 and Figure 18, it is observed that the calculated axial capacities of the NSC/HSC columns are almost the same as the used codes do not consider the confinement effect and mineral additives either has pozzolanic or filling effect as NC and MP for predicting the ultimate axial strength of the columns. As can be seen, the comparative studies (Pc compared to Pu) show that the calculated results are mostly lower than the experimental results which denotes that the calculated column capacities using the three preceding codes are almost on the conservative side.
For NSC columns, Eurocode 2-2006 [50] gives the closest estimate with an average of 21% lower than the experimental results, while ACI 318-18 [49] gives the greatest conservative results with an average of 66% lower than the test results, then it is followed by ECP 203-2018 [51] with an average of 59%. For HSC columns, Eurocode 2-2006 [50] gives an average estimate of about 53% lower than the experimental results, however ACI 318-18 [49] and ECP 203-2018 [51] gives an average estimate of capacity by about half the experimental results which indicates great conservative results.
It can be noted that, the ratio of experimental to calculated capacities (Pc/Pu) of RC columns with hybrid additive is bigger than columns without additive, an indicator of the enhanced bearing capacity of columns with hybrid additive when compared to conventional concrete.
It is clear that considerable contradictions exist between codes and the experimental results especially for HSC columns. It can be attributed to important parameters not adopted in these codes as neglecting of the ties confinement, increasing concrete strength and finally, regarding this study, effect of various mineral additives to concrete mixture that enhance its performance, thus affecting on the behavior of the columns.
4.8. Economic Feasibility Study of Using Nano Clay and the Marble Powder in Concrete Construction
Economic feasibility study for using the optimum ratios of NC and MP in concrete has been depicted herein. The cost of mixes of columns 1N and 3A were analyzed and presented in Table 6. It can be concluded from the feasibility study for the two mixes that the increase in cost was about 43%. On the other hand, the gains in axial capacity, axial strain, lateral strain and toughness were about 9, 5, 17 and 14%, respectively. These gains may seem unfeasible in comparison to the increase in the cost of concrete. But, combining these gains to the environmental benefits of reducing CO2 emissions of cement production, which was reduced by about 15% in this mix, and using MP which represents a burden on landfills and waste management systems, gives the real feasibility of using such mixes. Moreover, these concrete mixes with hybrid additives are more durable as the filling effect of MP reduces its permeability and guarantees its resistance to any hazard attacks from the surrounding environment.
Table 5: Comparison Between Calculated Axial Capacities of Specimens by the Different Codes with the Experimental Results
| ID | Exp. Axial Load | ACI 318-18 [49] | Eurocode 2-2006 [50] | ECP 203-2018 [51] | |||
| Pc
(KN) |
Pu
(KN) |
Pc/
Pu |
Pu
(KN) |
Pc/
Pu |
Pu
(KN) |
Pc/
Pu |
|
| C1N | 770 | 467.6 | 1.65 | 640.2 | 1.20 | 488.4 | 1.58 |
| C2N | 835 | 467.6 | 1.79 | 640.2 | 1.30 | 488.4 | 1.71 |
| C3A | 834 | 487.2 | 1.71 | 665.7 | 1.25 | 507.8 | 1.64 |
| C4A | 925 | 487.2 | 1.90 | 665.7 | 1.39 | 507.8 | 1.82 |
| C5A | 998 | 487.2 | 2.05 | 665.7 | 1.50 | 507.8 | 1.97 |
| C6A | 733 | 487.2 | 1.50 | 665.7 | 1.10 | 507.8 | 1.44 |
| C7A | 690 | 487.2 | 1.42 | 665.7 | 1.04 | 507.8 | 1.36 |
| C8A | 717 | 567.1 | 1.26 | 808.8 | 0.89 | 612.4 | 1.17 |
| Average for NSC Columns |
…. | …. | 1.66 | …. | 1.21 | ….. | 1.59 |
| C9N | 1261 | 626.1 | 2.01 | 846.3 | 1.49 | 645.3 | 1.95 |
| C10A | 1372 | 651.2 | 2.11 | 879.0 | 1.56 | 670.1 | 2.05 |
| Average for HSC Columns |
…. | …. | 2.06 | …. | 1.53 | …. | 2.00 |
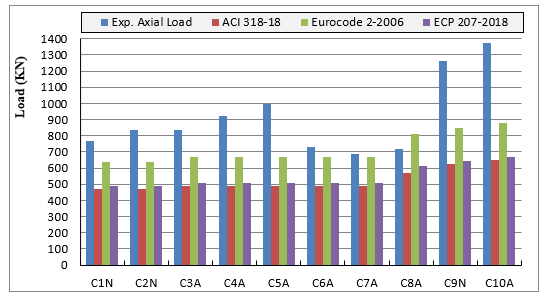 Figure 18: The Calculated Axial Capacities of Specimens by the Different Codes relative to the Experimental Results
Table 6: Economic feasibility of nano clay used in RC columns
| % of Increment in the Column Behavior
(C3A compared to C1N) |
% of Increment in the Cost | Total Price of (Cement & NC) in the Mix (L.E) | Price of NC (L.E) | NC (Kg/m³) | Price of Cement (L.E) | Cement (Kg/m³) | Actual Fcu (Mpa) | Mix |
| Ref. | Ref. | 360 | — | — | 360 | 400 | 48.7 | 1(N)* |
| · 9% in Axial Load
· 5% in Axial Strain · 17% in Lateral Strain · 14% in Toughness |
43% | 515.5 | 210 | 10.5 | 305.5 | 339.5 | 51.2 | 2(A)** |
*N: No additives **A: Additives (3%NC and 10%MP)
5. Summary and Conclusions
Ten reinforced concrete columns with and without the optimum ratio hybrid additives were tested under axial loading to determine their ultimate capacity, axial and lateral strains, ductility, and compared their failure pattern. The effect of presence of hybrid additives on concrete strength, ties ratio, slenderness ratio of columns and longitudinal steel bars ratio were studied. Based on the experimental results the following conclusions were obtained:
- In both NSC and HSC RC columns, the presence of optimum ratios of the hybrid additive (NC and MP) has a positive effect on both strength and ductility of RC columns.
- The presence of hybrid additives in RC columns with high ties ratio reasonably enhanced the column behavior in strength and ductility more than columns with low ties ratio.
- The presence of NC sheets in the concrete mix added additional confinement in RC columns and improved the ductility of the tested columns and achieved highly increment in the lateral strain and toughness.
- Increasing the concrete strength for column with hybrid additive led to slightly enhancing for axial load, ductility and toughness compared to columns without additive.
- The behavior of RC column with hybrid additive and with low ties ratio (0.5%) almost approached the behavior of NSC column with high ties ratio (0.65%) in strength and ductility parameters. This emphasizes the significant effect of additives on the behavior of columns
- Higher axial load capacity, better ductile performance, greater reduction in the ties ratio and larger dissipation of energy can be achieved by using hybrid additions in the RC columns.
- Columns test results indicated that exhibition inelastic buckling through increasing of slenderness ratio led to declining strength and ductility in columns.
- The high ratio of longitudinal steel bars leads to declining strength and enhancing post-peak strains in columns.
- The failure mechanisms of the tested columns were almost the same unless RC columns made of HSC that failed more suddenly and its brittleness is notorious.
- The presence of hybrid additions makes the RC columns less brittle compared to NSC/HSC columns. Generally, the RC columns with a higher concrete strength grade, a lower ties ratio, a higher slenderness ratio and a lower longitudinal reinforcement ratio exhibit a brittle failure behavior of RC columns.
- Various coefficients should be adopted in the used codes as they have effect on the strength and ductility of columns such as confinement coefficient due to ties, increasing concrete strength for HSC and the effect of various mineral additives to concrete mixture.
- The ratio of experimental to calculated capacities (Pc/Pu) of RC columns with hybrid additive is bigger than columns without additive, an indicator of the enhanced bearing capacity of columns with hybrid additive when compared to conventional concrete.
- The calculated column capacities using the three preceding codes are mostly lower than the experimental results which denotes that design of columns strengths are almost on the conservative side. ACI 318-18 formula led to the greatest conservative estimate especially in HSC columns.
Conflict of Interest
The authors declare no conflict of interest.
- D. Le, Q. Wang, L. Galoisy, G. Renaudin, L. Izoret, G. Calas, “Greening effect in slag cement materials,” Cement and Concrete Composites, 84, 93–98, 2017, doi:10.1016/j.cemconcomp.2017.08.017.
- M.C. Bignozzia, “Sustainable cements for green buildings construction,” Procedia Engineering, 21, 915–921, 2011, doi:10.1016/j.proeng.2011.11.2094.
- K.M. Liew, A.O. Sojobi, L.W. Zhang, “Green concrete?: Prospects and challenges,” Construction and Building Materials, 156, 1063–1095, 2017, doi:10.1016/j.conbuildmat.2017.09.008.
- M. Glavind, “Green concrete structures,” Structural Concrete, 12(1), 23–29, 2011, doi:10.1002/suco.201000022.
- J. David, M. Flower, J.G. Sanjayan, “Green House Gas Emissions due to Concrete Manufacture,” Int J LCA, 12(5), 282–288, 2007.
- S. Kubba, Green Building Materials and Products, Elsevier Inc: 227–311, 2012, doi:10.1016/B978-0-12-385128-4.00006-8.
- F. Sanchez, K. Sobolev, “Nanotechnology in concrete – A review,” Construction and Building Materials, 24(11), 2060–2071, 2010, doi:10.1016/j.conbuildmat.2010.03.014.
- K. Sobolev, M.F. Gutierrez, “How Nanotechnology Can Change the Concrete World,” Construction and Manufacturing, 113–116, 2005.
- R. Olar, “Nanomaterials and Nanotechnologies for Civil Engineering,” Technical University of Iasi Construction. Architecture, 4, 109–117, 2011.
- V.K. Ganesh, “Nanotechnology in Civil Engineering,” European Scientific Journal, 8(27), 96–109, 2012.
- B. Birgisson, A.K. Mukhopadhyay, G. Geary, M. Khan, K. Sobolev, Nanotechnology in Concrete Materials, Transportation Research Circular, 2012.
- A.A. Aliabdo, A.M. AbdElmoaty, E.M. Auda, “Re-use of waste marble dust in the production of cement and concrete,” Construction and Building Materials, 50, 28–41, 2014, doi:10.1016/j.conbuildmat.2013.09.005.
- S.I. Zaki, O.A. Hodhod, F.E. Omar, “Comparison Between the Effect of Addition of Nano-Calcium Carbonate and Nano-Kaoline on Developing the Properties of Concrete,” ???????????????? ??????? ? ???????????? (Intelligent Systems in Production), 16(3), 147–159, 2018, doi:10.22213/2410-9304-2018-3-147-159.
- M.A.. Langaroudi, Y. Mohammadi, “Effect of nano-clay on workability , mechanical , and durability properties of self-consolidating concrete containing mineral admixtures,” Construction and Building Materials, 191, 619–634, 2018, doi:10.1016/j.conbuildmat.2018.10.044.
- N. Hamed, M.S. El-feky, M. Kohail, E.A.R. Nasr, “Effect of nano-clay de-agglomeration on mechanical properties of concrete,” Construction and Building Materials, 205, 245–256, 2019, doi:10.1016/j.conbuildmat.2019.02.018.
- S.I. Zaki, H.A. Hodod, M.A. Mahdi, “The effect of using hybrid nano materials on drying shrinkage and strength of cement pastes,” Nanotechnologies in Construction, 8(2), 109–132, 2016, doi:DOI: dx.doi.org/10.15828/2075-8545-2016-8-2-109-134.
- S.I. Zaki, H.A. Hodhod, Y.A. Mosleh, “Assessing the Durability of Blended Concrete with Some Nanomaterials,” in 9th International Conference on Nano Technology in Construction , Sharm El-Sheikh, Egypt, 2017.
- B. Sabir, S. Wild, J. Bai, “Metakaolin and calcined clays as pozzolans for concrete: A review,” Cement and Concrete Composites, 23(6), 441–454, 2001, doi:10.1016/S0958-9465(00)00092-5.
- M.S.M. Norhasri, M.S. Hamidah, A.M. Fadzil, O. Megawati, “Inclusion of nano metakaolin as additive in ultra high performance concrete ( UHPC ),” Construction and Building Materials, 127, 167–175, 2016, doi:10.1016/j.conbuildmat.2016.09.127.
- A.M. Mohamed, “Influence of nano materials on flexural behavior and compressive strength of concrete,” Housing and Building National Research Center, 2015, doi:10.1016/j.hbrcj.2014.11.006.
- A. Hakamy, F.U.A. Shaikh, I.M. Low, “Characteristics of nanoclay and calcined nanoclay-cement nanocomposites,” Composites Part B, 78, 174–184, 2015, doi:10.1016/j.compositesb.2015.03.074.
- P. Hosseini, A. Afshar, B. Vafaei, A. Booshehrian, E.M. Raisi, A. Esrafili, “Effects of nano-clay particles on the short-term properties of self-compacting concrete,” European Journal of Environmental and Civil Engineering, 2015, doi:10.1080/19648189.2015.1096308.
- S. Chandrusha, S.R. Begum, G.M. Basha, “Utilization of Various Waste Materials in Concrete a Literature Review,” International Journal of Engineering Science and Computing, 7(11), 15386–15390, 2017.
- W.H. Khushefati, M.H. Swellam, M.I. Alattar, “Recycling granite and marble sludge as a construction material,” International Journal of Current Research, 7(08), 18982–18987, 2015.
- H. Elyamany, A.M. AbdElmoaty, B. Mohamed, “Effect of filler types on physical , mechanical and microstructure of self compacting concrete and Flow-able concrete,” Alexandria Engineering Journal, 2014, doi:10.1016/j.aej.2014.03.010.
- R. Ciccu, R. Cosentino, C.C. Montani, A. El Kotb, H. Hamdy, “Strategic study on the Egyptian Marble and Granite Sector,” Industrial Modernisation Centre, (August), 2005.
- S. Natarajan, P. Murugesan, “Synergistic Effect of Marble Powder and Green Sand on the Mechanical Properties of Concrete, Metakaolin-cement,” Materials, 12(476), 1–17, 2019, doi:10.3390/ma12030476.
- M.S. Hameed, A.S.S. Sekar, L. Balamurugan, V. Saraswathy, “Self-Compacting Concrete Using Marble Sludge Powder and Crushed Rock Dust,” KSCE Journal of Civil Engineering, 16(6), 980–988, 2012, doi:10.1007/s12205-012-1171-y.
- B. Rai, K. Naushad, A. Kr, T. Rushad, S.. Duggal, “Influence of Marble powder/ granules in Concrete mix,” International Journal of Civil and Structural Engineering, 1(4), 827–834, 2011.
- A. Mashaly, B.. Shalaby, M.. El-Hefnawi, “Characterization of The Marble Sludge of The Shaq El Thoaban Industrial Zone , Egypt and Its Compatibility for Various Recycling Applications,” Australian Journal of Basic and Applied Sciences, 6(3), 153–161, 2012.
- O.M. Omar, G.D. AbdElhameed, M.A. Sherif, H.A. Mohamadien, “Influence of limestone waste as partial replacement material for sand and marble powder in concrete properties,” Housing and Building National Research Center, 8(3), 193–203, 2012, doi:10.1016/j.hbrcj.2012.10.005.
- S. Singh, A. Tiwari, R. Nagar, “Comparative Assessment of Effects of Sand & Cement Replacement in Concrete by Marble Dust & Inturn Deriving An Optimum Design Mix For Concrete Paver Blocks,” in Global Stone Technology Forum (GSTF) December 17-18, Udaipur, 2015.
- Y. Shanmugasundaram, D. Nagarajan, S. Mohankumar, “Behavioural Investigation on the use of Nanosilica as An Additive in Concrete,” ACEE Int. J. on Transportation and Urban Development, 3(1), 2013.
- J. V Silva, R. Ismael, R.N.F. Carmo, C. Lourenço, E. Soldado, H. Costa, E. Júlio, “Influence of nano-SiO2 and nano-Al2O3 additions on the shear strength and the bending moment capacity of RC beams,” Construction and Building Materials, 123, 35–46, 2016, doi:10.1016/j.conbuildmat.2016.06.132.
- E.M. Lotfy, M. Abdelshakor, “Flexural Behavior of Reinforced Concrete Beams With Nano-Metakaolin,” International Journal of Latest Trends in Engineering and Technology, 8(2), 231–240, 2019, doi:DOI: http://dx.doi.org/10.21172/1.82.031.
- M.A. Ahmed, E.M. Lotfy, “Structural Performance of Reinforced Concrete Beams with Nano- Meta-Kaolin in Shear,” IOSR Journal of Mechanical and Civil Engineering (IOSR-JMCE), 14(2), 88–96, 2017, doi:10.9790/1684-1402048896.
- W.A. Salman, I.H. El-kersh, E.M. Lotfy, M.A. Ahmed, “Behavior of reinforced concrete inverted T-section beams containing Nano-silica,” IOSR Journal of Mechanical and Civil Engineering (IOSR-JMCE), 16(5), 13–22, 2019, doi:10.9790/1684-1605041322.
- N. Soliman, “Effect of using Marble Powder in Concrete Mixes on the Behavior and Strength,” International Journal of Current Engineering and Technology, 3(5), 1863–1870, 2013.
- M.A. Mahdi, A.H. Ghallab, S.I. Zaki, A.S. Elmannaey, “Utilization of Nano Clay , Marble Powder and Silica Fume Waste as Hybrid Addition for Enhancing the Properties of Concrete,” International Journal of Engineering Research & Technology (IJERT), 9(12), 277–294, 2020.
- ASTM C150, Standard Specification for Portland Cement, Annual Book of ASTM Standards, doi:10.1520/C0150_C0150M-12.
- ES 262-1, Egyptian Standards – Ferrous Products Committee. Steel for the reinforcement of concrete Part1: – Plain bars; ES 262-1. Cairo (Egypt): Egyptian Organization for Standards and Quality, EOS, 2009.
- ES 262-2, “Egyptian Standards – Ferrous Products Committee. Steel for the reinforcement of concrete Part2: – Ribbed bars; ES 262-2. Cairo (Egypt): Egyptian Organization for Standards and Quality, EOS,” 2009.
- ASTM C1240-03a, Standard Specification for Silica Fume Used in Cementitious Mixtures, 2003.
- BS EN 934-2:2001, “Admixtures for concrete , mortar and grout,” British Standard,.
- BS EN 12390-3, Testing hardened concrete – Part 3?: Compressive strength of test specimens, 2009.
- T. Ichinose, Y. Kanayama, Y. Inoue, J.. Bolander, “Size effect on bond strength of deformed bars,” Construction and Building Materials, 18, 549–558, 2004, doi:10.1016/j.conbuildmat.2004.03.014.
- S. Sener, Z. Bazant, A. Fellow, E. Becq-Giraudon, “Size Effect on Failure of Bond Splices of Steel Bars in Concrete Beams,” Journal of Structural Engineering, 125, 653–660, 1999.
- X. Qian, Z. Li, “The relationships between stress and strain for high-performance concrete with metakaolin,” Cement and Concrete Research, 31, 1607–1611, 2001.
- ACI 318-19, Building Code Requirements for Structural Concrete, 2019.
- Eurocode 2, Manual for the design of concrete building structures to Eurocode 2, (September), 2006.
- ECP 203, Egyptian Code for Design and Construction of Reinforced Concrete Structures, 2018.
WordPress database error: [User 'astesjco_WP0QT' has exceeded the 'max_questions' resource (current value: 1)]SELECT * FROM wp_ayschart_charts WHERE id = '4025'
WordPress database error: [User 'astesjco_WP0QT' has exceeded the 'max_questions' resource (current value: 1)]SELECT option_name, option_value FROM wp_options WHERE option_name IN ('_transient_astesj_rel_d9ce7a610e259cd5d53f2cdc9fc4a21f','_transient_timeout_astesj_rel_d9ce7a610e259cd5d53f2cdc9fc4a21f')
WordPress database error: [User 'astesjco_WP0QT' has exceeded the 'max_questions' resource (current value: 1)]SELECT wp_posts.ID
FROM wp_posts INNER JOIN wp_postmeta ON ( wp_posts.ID = wp_postmeta.post_id )
WHERE 1=1 AND wp_posts.ID NOT IN (32635) AND (
( wp_postmeta.meta_key = 'citation_keywords' AND wp_postmeta.meta_value LIKE '%Nanoparticles%' )
OR
( wp_postmeta.meta_key = 'citation_keywords' AND wp_postmeta.meta_value LIKE '%Nano clay%' )
OR
( wp_postmeta.meta_key = 'citation_keywords' AND wp_postmeta.meta_value LIKE '%Marble powder waste%' )
OR
( wp_postmeta.meta_key = 'citation_keywords' AND wp_postmeta.meta_value LIKE '%RC columns%' )
OR
( wp_postmeta.meta_key = 'citation_keywords' AND wp_postmeta.meta_value LIKE '%Axial loading%' )
OR
( wp_postmeta.meta_key = 'citation_keywords' AND wp_postmeta.meta_value LIKE '%Strain%' )
OR
( wp_postmeta.meta_key = 'citation_keywords' AND wp_postmeta.meta_value LIKE '%Confinement%' )
OR
( wp_postmeta.meta_key = 'citation_keywords' AND wp_postmeta.meta_value LIKE '%Ductility%' )
) AND wp_posts.post_type IN ('elementor-hf', 'elementor_library', 'page', 'post', 'sdm_downloads', 'wpb_gutenberg_param') AND ((wp_posts.post_status = 'publish'))
GROUP BY wp_posts.ID
ORDER BY wp_posts.post_date DESC
LIMIT 0, 100
WordPress database error: [User 'astesjco_WP0QT' has exceeded the 'max_questions' resource (current value: 1)]INSERT INTO `wp_options` (`option_name`, `option_value`, `autoload`) VALUES ('_transient_timeout_astesj_rel_d9ce7a610e259cd5d53f2cdc9fc4a21f', '1784926718', 'off') ON DUPLICATE KEY UPDATE `option_name` = VALUES(`option_name`), `option_value` = VALUES(`option_value`), `autoload` = VALUES(`autoload`)
WordPress database error: [User 'astesjco_WP0QT' has exceeded the 'max_questions' resource (current value: 1)]INSERT INTO `wp_options` (`option_name`, `option_value`, `autoload`) VALUES ('_transient_astesj_rel_d9ce7a610e259cd5d53f2cdc9fc4a21f', '<p>No related articles were found.</p>', 'off') ON DUPLICATE KEY UPDATE `option_name` = VALUES(`option_name`), `option_value` = VALUES(`option_value`), `autoload` = VALUES(`autoload`)
No related articles were found.