A Statistical Description of Students Admitted to Higher Education Institutions, Public and Private, in Albania for the Academic Year 2017-2018

Adv. Sci. Technol. Eng. Syst. J. 6(4), 37–43 (2021);
 DOI: 10.25046/aj060405
This paper makes a statistical analysis of some indicators that characterize the environment of students admitted to public and private Institutions of Higher Education i.e. university level institutions, presenting an overview to the distribution of these students in the key areas of study that these institutions offer such as: Arts, Agriculture, Natural Sciences, Social Sciences, Medical Sciences and Sports. The distribution is studied based on gender, residential area (city or village) and high school average. The study is undertaken to know and better understand the trends related to these indicators in the main areas of study mentioned above. A careful description of the figures from the stidy reveals typical features and explains better the situation. The purpose of the study is to see the impact of these factors on the study programs where these students have been declared winners. In this paper it will be introduced the two-step method (two steps cluster method) and it will be illustrated with an application on a database obtained from the State Matura (Center for Educational Services, Ministry of Education, Sports and Youth). The two-step cluster analysis identifies the clusters by first executing pre-clustering and then applying the hierarchical method until the final p clustering. Because of the ability to use a fast-clustering algorithm in advance, it can handle large data sets. To evaluate the quality of the groups we used the value of silhouette measure of cohesion and separation. The software used to perform the analysis is SPSS, V 25. The criterion used to determine the groups is Schwarz’s Bayesian Criterion (BIC).
1. Introduction
Cluster analysis is an analytical technique used to classify or group data into finite and small number of groups, based on two or more variables. This analysis is a convenient method to identify homogeneous groups of objects or people who share the same characteristics [1]. There are several algorithms for cluster analysis and each of them aims to form groups based on calculating the measure of distance (measured distance) between observed individuals and observation groups. Grouping can be done according to individuals or variables. The data set consists of numeric, categorical or mixed variables, and different types of algorithms are constructed for each type of variable. Categorical data can be obtained from quantitative data or qualitative [2]. Cluster analysis applications appear in various fields. The data collected in the real world often contains both types of data, hence the mix. Traditional CA (Cluster Analysis) methods are difficult to apply directly to these types of data. In this paper we will use a method which can be applied simultaneously to mixed data [3]. Our paper focuses on the application of the two-step method of Cluster Analysis, which was developed in [4] to handle these types of data. The cluster analysis used is a two-step aggregation procedure in SPSS 25.0, which gives the user the ability to determine the appropriate number of groups, and then classify them using a non-hierarchical routine. This procedure is useful in this particular situation due to the sample size and the large number of variables being analyzed. Also, Garson in 2009 encourages the use of the two-step method for large data sets, using continuous and categorical data with three or more levels. The two-step aggregation method offers a particular advantage to leadership educators because of its ability to handle categorical variables such as gender, class level, and level of involvement,[5]. Like the K-means method this procedure can effectively handle databases that contain many records with data. From the name “Two-Step Cluster Analysis” it shows that the algorithm is based on two stages of approximation. The algorithm used in the first step is very similar to that of the K-means method. Based on these results, two-step cluster analysis leads to a hierarchical agglomeration method of CA, which combines objects sequentially to form homogeneous clusters [6]. Specifically, the two-step method of Cluster Analysis involves performing the following steps[7]:
- Preliminary collection
- Data collection in subgroups
Pre-grouping individuals or records into smaller subclusters, this step uses a sequential cluster approximation. In this step the data is scanned one by one and it is decided whether the current record should be merged with the previously formed group or classified into a new group based on the distance criterion [8]. SPSS implements this procedure by constructing a modified Cluster of features a (CF) tree according to (Zhang et al., 1996). This (CF) tree consists of node levels, where each node contains a number of inputs determined by the variable modality. Exactly one of these entries represents the desired sub-cluster [9].
The model assumes that the continuous variables xj (j = 1, 2, . . ., p) are within cluster i independent normal distributed with means µij and variances σ2ij and the categorical variables aj are within cluster i independent multinominal distributed with probabilities πijl, where (jl) is the index for the l-th category (l = 1, 2, . . ., ml) of variable aj (j = 1, 2, . . ., q). Two distance measures are available: Euclidean distance and a log-likelihood distance. The log-likelihood distance can handle mixed type attributes. The log-likelihood distance between two clusters i and s is defined as:
 ξ can be interpreted as a kind of dispersion (variance) within cluster v (v = i, s, . ξ consists of two parts. The first part
measures the dispersion of the continuous variables xj within cluster . If only would be used, d(i, s) would be exactly the decrease in the log-likelihood function after merging cluster i and s. The term is added to avoid the degenerating situation for
?? might be interpreted as a distribution within the group. Similarly, agglomeration methods, hierarchical collection methods as well as clusters with the shortest distance are joined in the same stream. The log-likelihood function for step k is calculated as:
![]() This function ?? might be interpreted as distribution within groups, but not exactly as the log-likelihood function. Where only non-geometric variables are used, ?? becomes entropy within the number k of the groups.
This function ?? might be interpreted as distribution within groups, but not exactly as the log-likelihood function. Where only non-geometric variables are used, ?? becomes entropy within the number k of the groups.
The number of groups is given in advance and at each step of the procedure, this number is evaluated through two criteria which at the end automatically determine their number. Akaike Assessor Information Criterion (AIC) and Bayesian Information Criterion (BIC), which are determined by equations (6) and (7):
???? = −2?? + 2?? (6)
???? = −2?? + ??log? (7)
where ?? represents the number of independent parameters, lk is the distribution within groups, k is the number of intermediate groups and n is the number of individuals [10].
Since the database with which we will work contains both continuous data and categorical data in our study we will use exactly the log-likelihood distance, which assumes that continuous variables have normal distributions and categorical variables have multinomial distributions. All variables are assumed to be independent just as individuals are. Most applications include variables that are somewhat related, so the Two Steps Cluster method is the best approximation to reality [11].
2. Purpose
Since 2006 in Albania with the development of educational reform the admission of students to Higher Education Institutions (IALs) has become more massive and universities, both public and non-public, have opened their doors to a large number of students by implementing thus the constitutional right of every Albanian citizen to be educated. From that year onwards, in addition to the existing fields of study, with the increased demand over time, a number of new fields of study have opened up and gained momentum, which have arisen as a need to the labor market. The purpose of this paper is to provide an overview of students admitted to IAL-s of the Republic of Albania, not only according to the respective densities in each program or university, but deepening further to simultaneously look at other characteristics of these students. One such example is the way they are distributed by gender, origin: by city or rural areas or even by the results achieved during secondary education, which in the database we will use, are reflected through their average for all years of high school. The intention is not only to give numerical data, but also to have a detailed look to see if there is any connection between these indicators or if this distribution is random.
In other words, the purpose is to study if there is any connection between the student’s gender and the program in which he/she is admitted. The secondary aim to this paper can be to help the relevant policy-making bodies, to improve secondary and higher education policies: the first by increasing the quality of curricula and infrastructure and the second by enriching departments with contemporary curricula, in order to meet the requirements of all students. This in turn would be seen as a challenge by students motivating them to see not only academic achievement and school learning, but also their satisfaction, and commitment to lifelong learning. This would also motivate them to open new doors and provide the right resources to achieve unquestionable academic success [12]. At last, this study can help all students studying outside Albania, giving an incentive to come and contribute to their country.
3. Database description
The database used in this study was obtained from the Center for Educational Services, part of Ministry of Education, Sports and Youth. This database contains all students enrolled in the first cycle of studies in 2017, in public and non-public universities of the Republic of Albania. The database consists of 22418 individuals and each individual is described by 4 independent variables, which are: study program, gender, high school average and type of residence, city or village.
The study programs are grouped according to the main fields of study such as: arts, agriculture, medicine, natural, social, sports. This collection is made in order for higher education institutions that offer study programs in each of these fields to be able to improve strategies to attract as many students as possible.
4. Experiment Results
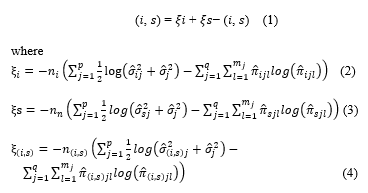
As a start, the two steps method was used to identify the possible groups that are created by combining the modalities of gender, study program, student background (city or village) and the average achieved by them during the years of preuniversity education. The number of groups was given in advance equal to 15 and the Schwarz’Bayesian criterion was used to estimate the number of groups. Table 1 presents the results provided by SPSS
4.1. Auto-Clustering
Table 1: Self-collection table
| Number of Clusters | Schwarz’s Bayesian Criterion (BIC) |
| 1 | 128265.515 |
| 2 | 104392.007 |
| 3 | 84160,103 |
| 4 | 67257.631 |
| 5 | 56414.898 |
| 6 | 47470,884 |
| 7 | 40938.323 |
| 8 | 35713,380 |
| 9 | 31882.708 |
| 10 | 28820.460 |
| 11 | 26626,089 |
| 12 | 24793.313 |
| 13 | 23030.864 |
| 14 | 21421,162 |
| 15 | 19901.124 |
From the table it is noticed that the values obtained by the criterion starting from cluster 1 and then for the second cluster 2 to cluster 10 have a significant difference. Starting from cluster 11 to cluster 15it can be noticed that the difference between the values that this criterion takes passing from group to group is negligible. Based on this criterion, the method itself proposes that the division into 10 clusters is the most appropriate.
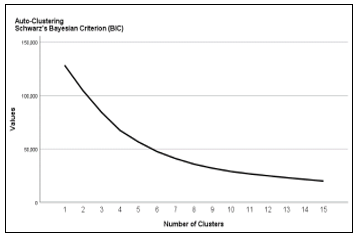 Figure 1: Number of groups based on grouping criteria
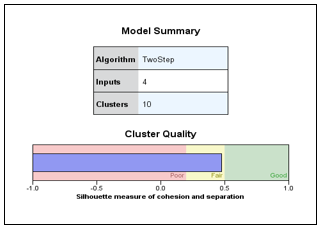 Figure 2: Number of groups based on grouping criteria
Another analysis, screen plot (see figure 1), confirms the above conclusions: the graphical representation of the pairs (number of gropuos – Criterion BIC) is in the same order as in table 1. Usually a suitable r can be found from the points where the gradient of the curve (curve) begins to become “flat” (See the position where this graph starts and becomes “flat”). In figure 1 a full screen can be seen, which graphically represents the variability of BIC values and serves to select the appropriate number of groups. It can be noticed that the best number of groups is equal to 10 because the values of the BIC criteria differ very little per k≥10.
 Figure 3: Group size, pizza graph for relative density of students in groups
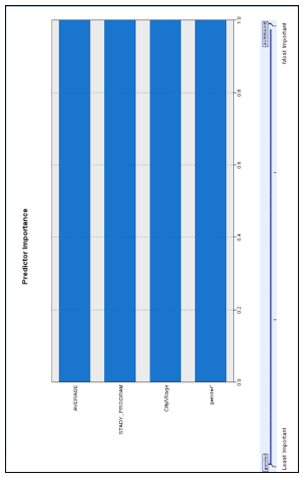 Figure 4: Weight of variables
Using the two-step method resulted in another important graph, figure 2 which shows that the individuals are divided into 10 groups based on 4 factors; gender, program of study, background and grade average. Also, the value of the silhouette indicator (the value of silhouette measure of cohesion and separation) which is less than equal to 0.5, shows that the 10 groups are well distinguishable from each other. The clustering can be called fair if the Silhouette measure of cohesion and separation is between 0.2 and 0.5. So, it can be noticed that the quality of the cluster is good because the mass of the silhouette of cohesion and case separation is close to the coefficient 0.5. It is orderly to emphasize that, if this indicator were less than 0, then this grouping would not make sense. Remember that the silhouette measure of cohesion and separation is an important indicator. Figure 3 shows the distribution of students expressed as a percentage in each group.
From figure 4, it can be noticed that the average grade has influenced more for the formation (difference) of the groups while the other three variables (study program, origin and gender) are ranked lower according to their importance in the writing order.
Using the step method resulted in another important figure, figure 6 which presents some characteristics for the 4 factors that describe the individuals of each group.
Some characteristics for each group are presented as follows:
- cluster 1-consists of 2269 students (or 10.1%), where all students are male. These students have chosen social field study programs and all come from the city with a grade average from high school equal to 7.29.
- cluster 2– consists of 5512 students (or 24.6%), where all students are female. These students have chosen socially oriented study programs and all come from the city with a grade average from high school equal to 7.74.
From this result it can be concluded that most of the female students coming from urban areas are oriented towards fields of study with social profile, and that their results during secondary education are not among the highest.
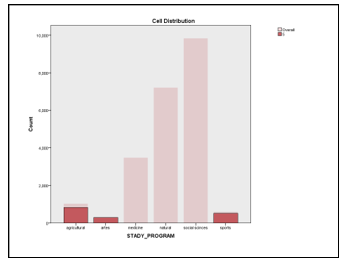 Figure 5: Distribution of variables in cluster 5
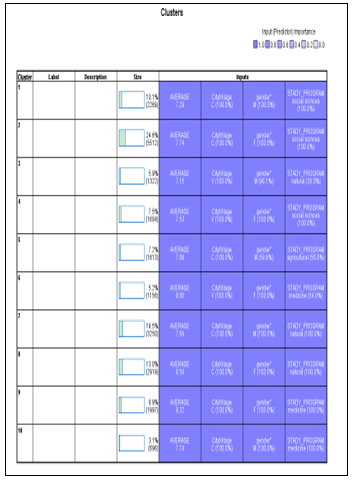 Figure 6: Groups
- cluster 5– it can be seen that the only students who have chosen to study in the fields of study of agriculture are gathered. It turns out that all these students are males from urban areas and it is also worth noting that this is the group with the lowest average. This conclusion is somewhat in contradiction with reality, as it would be more natural for students coming from rural areas to be oriented towards agricultural programs. Furthermore, for the group (cluster 5) as noticed in the cell distribution for the study program variable, they take the graph shown in Figure 5. What can be noticed is that, in this group there are also students who have chosen to study for arts and for sports. One of the reasons that these students are included in this group is that their number is very small and their averages during higher education are generally low (see figure 5).
- Cluster 10– consists of 696 students (or 3.1%) where the largest number are male students. These students have chosen medical-oriented study programs and all come from urban areas with a high school grade point average of 7.74. Naturally the question arises, why is this number so small?
From the results presented in figure 6 there can be distinguished some similarities or differences between the groups formed. It can be seen that cluster 1 and cluster 4, consist of female students who have chosen to study in socially oriented programs. These two groups differ by origin (city / village) and the latter come with a grade average (7.53) higher than those of group 1 (7.29). What is worth noting is the fact that the average during higher education in the fourth group is higher than in the first group. (see box plot, figure 7)
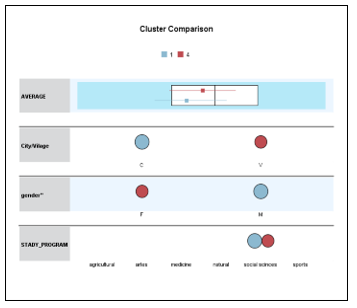 Figure 7: Comparison of clusters 1 and 4
It can be noticed that the females that make up cluster 4 have a higher average grade than the average grade of the males of cluster 1. The average grade of cluster 1 is closer to the overall grade average (7.76). This means that, the fourth group has higher performance than the first group in relation to this variable. Some of the reasons that can lead to this result are: higher accountability and demand from the teachers in urban areas, fictitious grading in rural areas, or simply the personal inclination of these students. Based on this result, it is up to the authorities, to make further studies to see if this fact is influenced or is natural.
In figure 6 it can be seen a cluster, which is cluster 3, where male students are gathered, who have chosen to study in study programs with natural direction and who come from rural areas, but there is not a such group with female students. So, none of the female students coming from rural areas have preferred or succeeded in winning these programs.
There is also cluster 6, where female students who have chosen to study in medical study programs originating from rural areas are gathered. It is worth noting that there is not a such group of male students. So, none of the male students coming from rural areas have preferred or succeeded in winning these programs. Another interesting fact to note is that the number of female students who have chosen to study in socially oriented study programs whether they come from urban or rural areas is significantly higher than the number of male students who have chosen to study in study programs in this regard. To prove this fact, it is enough to compare cluster 2 and cluster 4 with cluster 1 and see that the number of cases that have been collected in groups 2 and 4, the sum of cases is almost three-fold the number of cases collected in group 1. This result is a fact that shows the natural tendency of women towards social sciences.
Let’s remain in figure 6 and cluster 7 with cluster 8 the number of cases included in each group does not change much (respectively 3250 with 2919 cases). In these groups there are gathered male students who have chosen to study in study programs with natural direction, who come from urban areas (cities) and have an average of group 7.69, in cluster 7 and all female students who have chosen to study in study programs with natural direction and coming also from urban areas, but with a group average of 8.58. So, it can be observed that group averages have a significant difference (see figure 8). The same phenomenon is observed if a comparison between cluster 9 with cluster 10 is done (see figure 9).
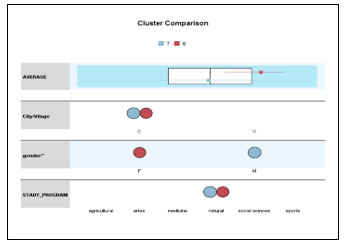 Figure 8: Comparison of clusters 7 and 8
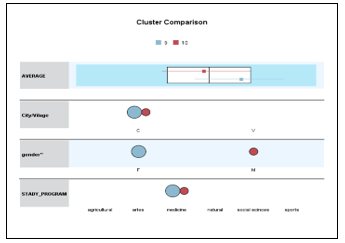 Figure 9: Comparison of clusters 9 and 10
In the first there are gathered female students who have chosen to study medical study programs, coming from urban areas, with an average of 8.32 and in the second there are gathered male students who have also chosen to study in medical study programs, with average 7.74. Again the difference in the means of these two groups is considerable. Can it be concluded that women are more intelligent than men? Based on the database we have taken in the study, this fact can be confirmed. To reach a more grounded conclusion it will be necessary to perform the analysis for several years in a row, and if a similar result is obtained, then the statement that “men are more intelligent than women” would be rejected. In the following, figure 9 and figure 10 graphically give what was just described in words above.
5. Conclusions
As mentioned above, the purpose of this paper is to provide an overview of students admitted to IAL-s of Albania not only according to the respective densities in each program or university, but further deepening to simultaneously see the other characteristics of these students, for example how they are distributed by gender, origin: from the city or from rural areas or even according to the results achieved throughout secondary education
At the end of the analysis, it can be reached to some conclusions which may be interesting:
The most important variable in creating clusters is the average. Female students from urban areas are oriented towards socially oriented study programs. Male students coming from urban areas do not, based on the analysis, prefer medical-oriented study programs. Female students who come from rural areas and have chosen socially oriented study programs have better high school results than same-sex students who have chosen the same major but who come from urban areas. All students who have chosen to study in agricultural study programs are male and come from urban areas. These students make up the group of the least grade average from high school. In natural and medical study programs, female students coming from urban areas have a higher average than male students coming from the same areas. No female students coming from rural areas have chosen or managed to win in natural study programs.
No male students from rural areas have selected or succeeded in earning medical degree programs. Female students coming from both rural and urban areas have chosen to study mostly in socially oriented study programs. Thus, showing the natural inclination of women towards the social sciences. It can be noted that all these results are valid for the database taken in consideration in this study. To see if these results can be generalized or not, the study should continue with the admissions in the IAL-s of the Republic of Albania in different years in other time spans or continuous years. This broader study is also authors’s goal for further work and study.
- C.Matsimbe, A.A. Mmbanze, K. Gelb, J.A. Jonas, and G. Nhapuala ” Use of Two-Steps Cluster Analysis to Understand How Emotions Affects Night Shift Teenagers’ Students, “Journal of Education, Society and Behavioral Science, 24 (3): 1-15, 2018; Article no. JESBS.39264, 2018.
- M. Muça, K. Bani and F. Shakaj, “Combining the hierarchal and non-hierarcal methods for acluster analysis: a case study for classification of students accordin to their results.,” In SPNA, Tirana, 2014.
- M. Shih, J. Jheng and L. Lai, ” A Tw-Step Method for Clustering Mixed Categroical and Numeric Data.,Tamkang Journal of Science and Engineering, 13(1), 2010.
- T. Chiu, D. Fang, J. Chen, Y.Wang, and C. Jeris, “A robust and scalable clustering algorithm for mixed type attributes in large database environment.,” KDD ’01: Proceedings of the seventh ACM SIGKDD international conference on Knoëledge discovery and data mining., p. 263–268, 2001.
- T.M. Facca, S.J. Allen, “Using Cluster Analysis to Segment Students Based on Self-Reported Emotionally Intelligent Leadership,” Journal of Leadership Education,10(2), 2011.
- Online,”https://docplayer.net/12782167-Chapter-9-cluster-analysis.html”.
- D. ?chiopu, “Applying TwoStep Cluster Analysis for Identifying Bank Customers’ Profile,” BULETINUL Universit??ii Petrol – Gaze din Ploie?ti, LXII, 66 – 75, 2010.
- M. Yaghini, “Two-Step Clustering Algorithm,” 2010.
- T. Zhang, R. Ramakrishnan and M. Livny, “BIRCH: an efficient data clustering method for very large databases,” ACM SIGMOD Record, 25, 2, 1996.
- N.D. Moroke, “A TWOSTEP CLUSTERING ALGORITHM AS APPLIED TO CRIME DATA OF SOUTH AFRICA,” Corporate Ownership & Control, 12(2), 2015.
- “https://www.ibm.com/support/pages/how-log-likelihood-distance-method-applied-twostep-cluster-analysis#: ~: text = The% 20log-likelihood% 20distance% 20measure, be% 20independent% 2C% 20as% 20are% 20cases.) “.
- J.M. Marron, D. Cunniff, “What Is An Innovative Educational Leader ?,” CIER, 7(2), 145-150, 2014.