Kamphaeng Saen Beef Cattle Identification Approach using Muzzle Print Image

Adv. Sci. Technol. Eng. Syst. J. 6(4), 110–122 (2021);
 DOI: 10.25046/aj060413
Identification of Kamphaeng Saen beef cattle is important of the registration and traceability purposes. For a traditional identification methods, Hot Branding, Freeze Branding, Paint Branding, and RFID Systems can be replaced by genius human. This paper proposed a Kamphaeng Saen beef cattle identification approach using muzzle print images as an Animal Biometric approach. There are two algorithms used in the system: Scale Invariant Feature Transform (SIFT) for detecting the interesting points and Random Sample Consensus (RANSAC) algorithm used to remove the outlier points and then to achieve more robustness for image matching. The image matching method for Kamphaeng Saen beef cattle identification consists of two phases, enrollment phase and identification phase. Beef cattle identification is determined according to the similarity score. The maximum estimation between input image and one template is affected from two perspectives. The first perspective applied SIFT algorithm in the size of the moving image with the rotating image and applied Gabor filters to enhance the image quality before getting the interesting points. For a robust identification scheme, the second perspective applied the RANSAC algorithm with SIFT output to remove the outlier points to achieve more robustness. Finally, feature matching is accomplished by the Brute-Force Matchers to optimize the image matching results. The system was evaluated based on dataset collected from Kamphaeng Saen (KPS; 47 cattle, 391 images), Nakhon Pathom and Tubkwang (TKW; 39 cattle, 374 images), Saraburi, Thailand. The muzzle print images database was collected between 2017 and 2019, in the total of 765 muzzle print images from 86 different cattles. The experimental result is given 92.25% in terms of accuracy which better than a traditional identification approach. Therefore, muzzle print images can be used to identify a Kamphaeng Saen beef cattle for breeding and marking systems.
1. Introduction
Kamphaeng Saen (KPS) beef cattle breed has been developed from a cross breed of Thai native cattle, Brahman and Charolais. Kamphaeng Saen beef cattle is suitable for tropical environment in Thailand and produce a high quality of meat [1]. The establishment of the breed is the results of the long-term effort of the research and development team of the Department of Animal Science, Faculty of Agriculture, Kasetsart University (KU), which was initially through the research project of the beef cattle by Prof. Chran Chantalakhana since 1969. The composite breed of 25% Thai native (N), 25% Brahman (B) and 50% Charolais (C) showed the superior genetic potential under the local Thai farming environment [2, 3, 4] shown in Figure 1. The native cattle are known to be superior in their high fertility in terms of regular estrous cycle and conception rates. The native cows produce high calving percentage even under sub-optimal feeding. Due to a small size and slow growth rate, the native cattle have not used in commercial fattening system. Hence, crossbreeding between an exotic breed, the Brahman, and Thai native cattle was made to improve size and growth rate in the crossbred. In terms of beef quality, beef from Brahman is less desirable than beef from temperate cattle such as Charolais [5]. Although, Charolais is not well adapted to hot climate, but its growth performance and beef quality are favorable [6]. The breed formed by intersemating of the crossbred followed by selection will be named after the district where it was developed [7].
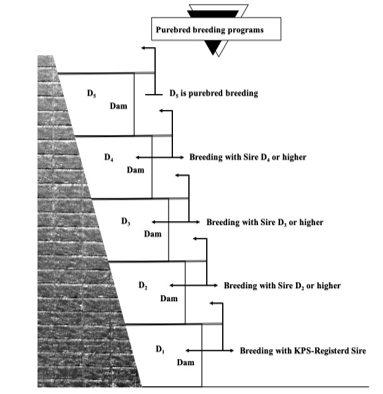 Figure 1: Kamphaeng Saen (KPS) beef cattle purebred breeding programs [7].
Since 1991, Kamphaeng Saen cattle have been distributed to farmers who are members of the KPS Beef Breeders Association. However, the uniformity of color and conformation of Kamphaeng Saen cattle has yet to be improved. In 1992, KPS Beef Breeders Association was founded, with 200 farmer members, registered the breed and the criteria for beef were established as follows:
- Hair color is creamy to light yellow is the best suitable. However, some variation in color is accepted if good pedigree.
- Genotype is 25% native, 25% Brahman, 50% Charolais; slight variation is acceptable.
- Having birth date, farm brand and individual identification.
- Having suspended testicles at six months of age.
- Passing general assessment by association’s officials [8].
Beef cattle identification is the method of recording a beef cattle with birth date, Sir/Dam, production, feeding programs, and health management. The identification system is an important method of livestock production. There are four types of identification:
- Permanent methods: Ear Notches, Tattooing, and Hot/Freeze/Paint Branding.
- Temporary methods: Chalk, Ear Tagging, and Neck Chains.
- Electrical methods: Microchips, RFID Systems, Ruminal Boluses, and Injectable Transponders.
- Biometrics methods: Muzzle Prints, Iris Patterns, Retinal Vascular, and DNA Profiling [9].
However, the main problems of these methodologies are low image quality, infliction of injury on the body of an animal, low-frequency coverage, loss of tags, and duplication respectively [10]. Hence, devising a robust means for cattle identification to mitigate the iterated challenges is a task that involves the state-of-the-art machine learning techniques in animal biometrics. DNA profiling is the process of determining an individual’s DNA characteristics, focusing on short tandem repeat (STRs), nucleotide polymorphism (SNPs), mitochondrial DNA (mtDNA), and sequencing markers of an individual animals [11].
The measurements of biometric authenticate features are seven characteristics as follow:
- Universality: a person has common characteristic.
- Uniqueness: two persons have characteristic with a high of uniqueness.
- Permanence: the characteristic never changed over time with advancing age.
- Collectability: the characteristic easy to acquire can be measures.
- Performance: how well a system factors include recognition accuracy, speed, and error rate.
- Acceptability: how accept the characteristic into a system.
- Circumvention: how easily which a system can be fooled by fraudulent biometric identifier.
A biometric system operates in two modes. First, verification mode: the system validates identity by biometric captured with own biometric template(s) stored in the database system. Second, identification mode: the system searching all template for a matching one-to-many comparison to establish an individual’s identity. The system is designed four main modules: 1) Sensor module: which captures the biometric data of an individual. 2) Feature module: which acquired biometric data processing to extract a set of salient features. 3) Matcher module: which claimed identity is verification and identification based on the matching score and 4) Database module: which store the biometric templates of the registration.
A biometric system can measure from two types of verification errors: 1) False Match: an error from two different persons to be from the same person (False Acceptance Rate (FAR)). False Non-Match: an error from the same person to be from two different persons (False Rejection Rate (FRR)). A trade-off between FAR and FRR is the functions of the decision threshold in template matching for measuring the performance of a system; if it is decreased to make the system more tolerant to input variations and noise, then FMR increases. On the other hand, if it is raised to make the system more secure, then FNMR increases accordingly. The performance at all operating points (thresholds) can be referred to the concept of a Receiver Operation Characteristic (ROC) curve. A ROC curve is a plot of FMR against (1-FNMR) or FNMR for various threshold values [12].
The traditional muzzle printing method in Japan shown in Figure 2. while the basic procedure is started from making dry muzzle by cloth, painting some ink on a muzzle by coverage, then rolling to lift paper print the area between upper lip and the top of the nostril. Then check a pattern of ridges and grooves for a complete pattern [13]. The identification process based on muzzle pattern shown in Figure 3, a ridges and grooves extracted from joint pixels as the features. Every joint pixel from two images is overlaid. Two joint pixels are matched if they are in a range of a pixel region [14].
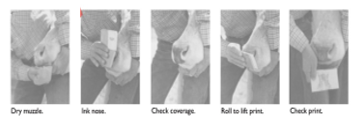 Figure 2: Muzzle printing procedure [13].
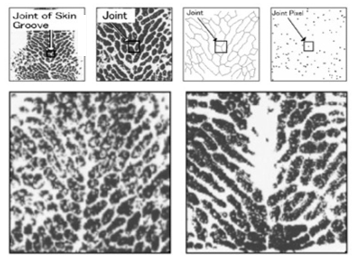 Figure 3: Muzzle pattern [14].
In this paper, a Kamphaeng Saen beef cattle identification approach using muzzle print image is proposed. The proposed applied the image matching method with machine learning techniques such as Scale-invariant feature transform (SIFT), Rectangular Gradients Histogram (R-HOG) which localize and detect the region of interest (ROI) in muzzle print images for the cattle identification and Random Sample Consensus (RANSAC) algorithm which used to remove the outlier points and improve the robustness of SIFT feature matching, RANSAC technique used with the SIFT in order to mitigate noises such a outliers points for better identification.
SIFT is a feature detection algorithm for image processing. It was published by David Lowe in 1999 and 2004. SIFT keypoints of objects are extracted from a reference image. An object in a new image is comparing each feature and finding candidate matching features based on Euclidean distance of their feature vectors. The full match keypoints that agreed up on object location, scale, and orientation are identified to a good match. The consistent clusters are performed by an efficient hash table of the Hough transform algorithm. Each cluster that agrees on object detailed verification and outliers has been discarded. Then, the probability that a set of features indicates is computed for the accuracy of false matches. That all pass object matches can be identified with high confidence.
RANSAC is a predictive algorithm for image processing. It was published by Dr.Martin A Fischler and Robert Bolles in 1981. RANSAC estimates by random sampling of observed data contain both inliers and outliers. Voting scheme implements the data elements for one or multiple models based on noisy features which will not vote for any single model (few outliers) and enough features to agree on a good model (few missing data). The compose of two repeated steps that are iteratively repeated until the consensus set in enough inliers: First, select randomly the minimum number of points to determine the parameters of the model. Second, determine how many points from all points fit with a predefined tolerance. If the number of inliers over the total number of points then re-estimate the model parameters.
The image matching for Kamphaeng Saen beef cattle consists of two phases, enrolment phase and identification phase. The beef cattle identification is determined according to the similarity score. The maximum estimation between input image and one template is affected from two perspectives. The first perspective uses SIFT algorithm in the size of the moving image with the rotating image, and uses Gabor filters for enhancing of image quality before getting the interesting points for a robust identification scheme, the second perspective uses the RANSAC algorithm is used with SIFT output to remove the outlier points and achieve more robustness. Finally, the feature matching is accomplished by using the Brute-Force Matchers for optimizing the image matching results.
The remainder of this paper is organized as follows: Section 2 about the related works, Section 3 explain the methodology, Section 4 is a proposed beef cattle identification approach, Section 5 the experimental scenarios, Section 6 shows the results and discussion. Finally, conclusion and future work is discussed in Section 7.
2. Related Works
The cattle identification using muzzle print image is proposed base on previous work that can be categorized into the image processing technique, machine learning technique and encouraging for a day of livestock management.
In [15], the author proposed a Principal Component Analysis and Euclidean distance classifier to evaluate and performed the muzzle ink prints with the training part from 3 images of 29 different cattle. The results showed that when using 230 eigenvectors (out of 290), the recognition rate was equal 98.85%. This technique as expected reduced the recognition rate when principal component less than 230, while training more images per cattle. In [16], the author using the fusion of texture feature that extracted from Webber Local Descriptor (WLD) and local binary pattern. The result showed that 96.5% in terms of identification accuracy. SURF (speeded-up robust features) and U-SURF (upright version) are the family with SIFT, SUR, it is better than SIFT in rotation and blur transform. SIFT is better than SURF in different scale images and SURF faster than SIFT. Both are good in illumination changes images. In [17], the author proposed SURF technique, the identification accuracy is 93% for 75% of training database. In [18], the author proposed U-SURF with the result of outstanding performance more than the original SURF.
In [19], the author proposed a Local Binary Pattern (LBP) to extract local invariant features from muzzle print images and applied including Nearest Neighbor, Naïve Bayes, SVM and KNN for cattle identification. The results shown that identification accuracy is 99.5%. In [20], the author proposed a multiclass support vector machines (MSVMs) in three phases: preprocessing used the histogram equalization and mathematical morphology filtering, feature extraction used the box-counting algorithm for detecting feature and classifications used the MSVMs. The results shown that 96% classification accuracy.
In [21] the author supported in precision livestock farming which focused on Image-based identification could be a promising non-intrusive method for cattle identification can be approach for deliver quantitative information and complete traceability of livestock in the food chain. In [22], the author shown the experimental results in the feature vector for different image of the same muzzle. It’s highly symmetry and this technique can be applied in registration livestock to monitoring individual cattle management system.
3. Methodology
3.1. SIFT Features
Scale Invariant Feature Transform (SIFT) is a feature extraction method based on the extraction of local information. The features extracted are invariant to image scaling, rotation, and partially invariant to change in illumination and projective distortion. Four major stages to generate a set of features are shown in Figure 4:
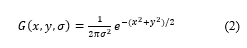
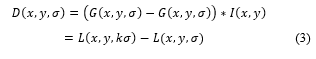
Scale-Space Extrema Detection: the candidate keypoints can be obtained by detecting extrema from Difference of Gaussian (DoG) pyramid which an approximation of Laplace of Gaussian (LoG). The input data is transformed to the space as follows:
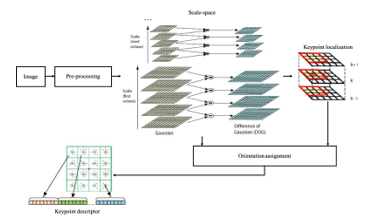 Figure 4: SIFT based on pre-processing [23, 24].
![]() where * corresponds to convolution operator, is the input image and is a Gaussian function with bandwidth .
where * corresponds to convolution operator, is the input image and is a Gaussian function with bandwidth .
 Keypoint Localization: to get stable keypoints, three processes are applied in this step. The first process is to find the accurate location of keypoints using the 3rd order Taylor polynomial; the second process is eliminating low contrast keypoints; and the third process is to eliminate the keypoints in the edge using principal curvature. The interpolation is done using the quadratic Taylor expansion of the Difference-of-Gaussian scale-space function with the candidate keypoint as the origin. This Taylor expansion is given by:
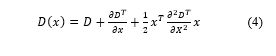 where
where
and its derivatives are evaluated at the candidate keypoint.
is the offset from this point.
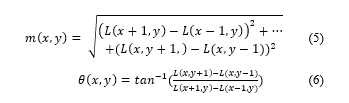
- Orientation Assignment: the orientation of keypoint will be calculated based on the gradient and orientation of a region around the keypoint. A keypoint may have more than one orientation. For an image sample at scale σ, the gradient magnitude, , and orientation, , are processed using differences pixel:
 Keypoint Descriptor: a window with the size of centered, each keypoint is calculated with the orientation and gradient magnitude. The window is then divided into sub regions. An orientation histogram which represented eight cardinal directions are calculated for each sub region based on gradient magnitude. The weight is calculated by a Gaussian window centered in the middle of the window. The keypoint descriptor consists of 128 elements from 16 sub regions where each sub regions consists of 8 features [23, 24].
3.2. Gabor Filters
Gabor filters are formed from two components, sinusoidal and Gaussian, The Gabor function was discovered by Gabor in 1946, where the function is defined in 1-D with stating time and then developed unto 2-D in the spatial domain formulated [25].
3.3. RANSAC Algorithm
The RANSAC procedure is opposite to the conventional smoothing techniques: Rather than using as much of the data as possible to obtain an initial solution and then attempting to eliminate the invalid data points. RANSAC uses as small an initial data set as feasible and enlarges this set with consistent data if possible. For example, given the task of filtering an arc of a circle to a set of two-dimensional points, the RANSAC approach will select a set of three points. Compute the center and radius of the implied circle and count the number of points that are close enough to that circle to suggest their compatibility with it. If there are enough compatible points. RANSAC will employ a smoothing technique such as least squares, to compute an improved estimate for the parameters of the circle [26].
3.4. Brute–Force Marchers
The brute-force descriptor matcher uses brute-force approach for feature matching. It takes the descriptor of one feature in the first image and compares it with descriptors of all features in the second image using some distance calculations. Then the closest one is returned in a resulting pair. The brute-force algorithm sometimes takes more time for highly precise. Its performance can be improved by setting specific parameters [27].
3.5. k–NN Algorithm
The k-Nearest-Neighbors algorithm (k-NN) is a well-known machine learning for pattern recognition method. k-NN is a non-parametric classification method, which is simple but effective in many cases. However, it needs to choose an appropriate value for in order to success a classification model [28].
3.6. FLANN based Matcher
FLANN stands for Fast Library for Approximate Nearest Neighbors. It contains a collection of algorithms optimized for fast nearest neighbor search in large datasets and for high dimensional features. It works more faster than BFMatcher for large datasets. FLANN needs to pass two dictionaries which specifies the algorithm to be used : IndexParams and SearchParams [29].
4. The Proposed Beef Cattle Identification Approach
The proposed scheme for a Kamphaeng Saen beef cattle identification approach using muzzle print image is described from two perspectives, Enrollment phase and Identification phase:
Enrollment phase: to enhance input muzzle print image (template image) by Gabor filters and using SIFT features to extract the keypoint descriptor, then store muzzle template to database.
Identification phase: to enhance input muzzle print image (query image) by Gabor filters and using SIFT features to extract the keypoint descriptor. The query is matched against the templates stored in the database as (1:N) matching. RANSAC algorithm and Brute-Force matchers are applied in the matching process to remove the matching outliers, mismatched SIFT keypoints, data to ensure the robustness of the similarity score. The animal identity is then assigned according to the highest estimated similarity threshold score between the input image and the template one, all details as shown in Figure 5.
4.1. Enrollment Module
Muzzle print image was stored in the database folder. Each muzzle print has been registered with template id (i.e. template_001.jpg); cattle’s info registered Location, Cow Tag, Gender, Type, and Owner. When cattle have been identified, then all about info of this muzzle print can be retrieved.
4.2. Identification Module
The matching modules was created by Python Script using Python 3.7.3, dependencies are required Numpy 1.16.5, SKimage 0.17.2 and OpenCV2 4.4.0. Module integrated with SIFT Features, Gabor Filters, RANSAC Algorithm, Brute-Force Matchers, k-NN Algorithm, and FLANN based Matcher using for experiments in the identification scheme steps as follow:
1. Place 2 muzzle print images that wanted to compare to the database folder.
2. Pass the names of images as arguments in the terminal console.
4.2.1. Matching Process
Start with Input Image, then Get Description from after Image Enhancement includes Ridge Segmentation (normalizing the image and find a ROI); Ridge Orientation (finding orientation of every pixel); Ridge frequency (finding the overall frequency of ridges extended), Frequent (estimate ridge frequency within image block); Ridge Filter is created Gabor filters and do the actual filtering. Then remove a border pixel under the conditions. BFMatcher is matching between descriptors and Calculate Score and compare with threshold. Finally, identification and decision making are done based on Algorithm 1.
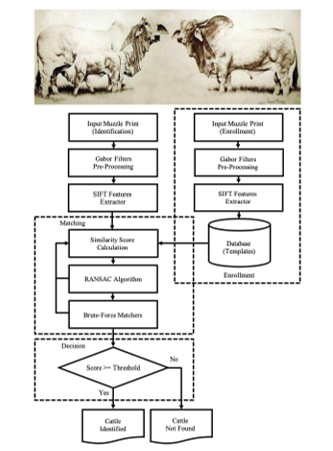 Figure 5: Completed module of a Kamphaeng Saen beef cattle identification approach using muzzle print image.
4.2.2. Decision Process
In this process, a similarity score will be compared with a threshold value to check if it either equal or greater than threshold, the result will be identified as cattle identified otherwise not identified.
Algorithm 1: KPS beef cattle’s muzzle print image features ********matching. |
|
1:2: 3: 4: 5: 6: 7: 8: 9: 10: 11: 12: 13: 14: 15: 16: |
image_name = sys.argv[1]img1 = IMREAD_GRAYSCALE kp1, des1 = get_description(img1) image_name = sys.argv[2]img2 = IMREAD_GRAYSCALE kp2, des2 = get_description(img2) bf = BFMatcher matches = match(des1, des2) score = 0 for match in matches: score += match.distance score_threshold = 33 if score/len(matches) < score_threshold: ‘Muzzle print matches.‘ else: ‘Muzzle print does not matche.‘ |
4. Experimental Scenarios
5.1. Data Collection
The database has been collected Kamphaeng Saen beef cattle between 2017 to 2019. From two locations: Cowboy Land, Nakhon Pathom, Department of Animal Science, Faculty of Agriculture at Kamphaeng Saen, Kasetsart University, Kamphaeng Saen Campus, Nakhon Pathom, Thailand shown in Figure 6a and Tubkwang Reseaerch Center, Saraburi, Department of Animal Science, Faculty of Agriculture at Bangkhen, Kasetsart University, Bangkhen, Bangkok, Thailand shown in Figure 6b.
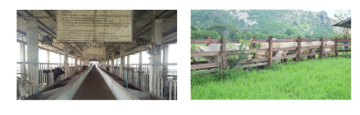 Figure 6:: (a) Cowboy Land, Nakhon Pathom,Thailand and b) Tubkwang Research Center, Saraburi
The lack of an original muzzle print images database was a challenge for this research. Therefore, collecting a muzzle print images database was a crucial decision. The Dataset was collected from Kamphaeng Saen beef cattle with four periods started from May and November 2017, January and June 2018, and March and May 2019, from 2 locations, keep 4 collection per location, in round of 5-11 months period shown in Table 1.
Table 1: Muzzle print images database collected period from 2 locations.
| Period | Cowboy Land,
Nakhon Pathom (KPS) |
Tubkwang Reseaerch Center, Saraburi (TKW) | ||||
| Age (Month) | Month | Year | Age (Month) | Month | Year | |
| 1 | Collect | May | 2017 | Collect | May | 2017 |
| 2 | (+) 8 | January | 2018 | (+) 6 | November | 2017 |
| 3 | (+) 5 | June | 2018 | (+) 7 | June | 2018 |
| 4 | (+) 11 | May | 2019 | (+) 9 | March | 2019 |
47 KPS datasets from 47 cattle with muzzle print images each, include male/female and calf/puberty/breeders. 39 TKW datasets from 39 cattle with muzzle print images each, all female, and all breeders. KU 48/053 KPS and KU 52/23 TKW are dead after first period collected setup symbol is D. Photo takes by FUJIFILM X100T, OPPO Mirror 5 and Worker’s camera with represented setup symbol are F ( , O ( and W , respectively. If images in the period is zero, its mean that cannot take a photo in this period because cattle stay in the stall.
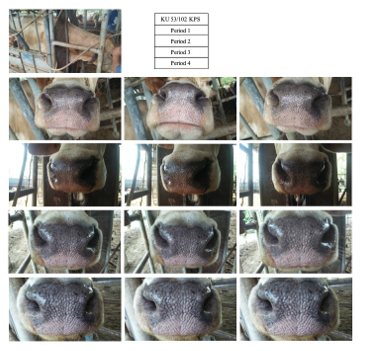 Figure 7: Sample of muzzle print images database from KU 53/102 KPS.
Sample of muzzle print images database from KU 53/102 KPS shown in Figure 7. and KU 53/005 TKW shown in Figure 8. The image shows Cow Tag and location, Individual image cattle show in the top of left. The different testing method has been setup based on the quality of the collected images. Such as covering collected the muzzle print images based on quality level in different deteriorating factors include orientated, blurred, low resolution, and partial. The original muzzle print images have been taken from 4 periods of different cattle for experimental in the identification conditions.
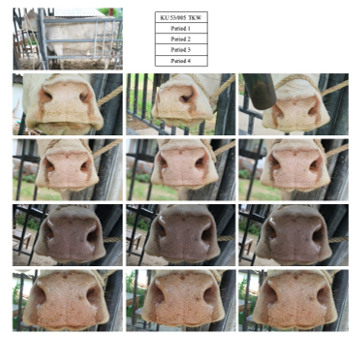 Figure 8: Sample of muzzle print images database from KU 53/005 TKW
5.2. Data Analysis
Dataset of the muzzle images has been standardized in orientation and scale manually. In every muzzle images, a rectangle region centered on the minimum line between the nostrils is taken as the Region of Interest (ROI) may be in different size so that it is re-sized into 200 × 200 pixels. The image has been enhanced using intensity transformation function shown in Figure 9 and beads and ridges in a muzzle photo shown in Figure 10.
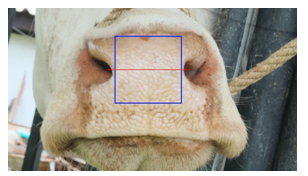 Figure 9: The blue rectangle region is the ROI of the muzzle photo, the red line is a minimum distance between the nostrils.
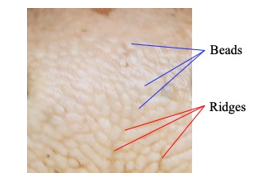 Figure 10: Beads and Ridges in a muzzle photo.
5.2.1. Scenario I
The Scenario I work as follows: 12 images of each cattle have been swapped between the enrollment phase an identification phase, the similarity score between all of images are calculated. Therefore, similarity score matrix with dimension of 200 × 200 pixels have been created. The cattle is correctly identified if the similarity score between the input image and the template image is greater than or equal a specific threshold shown in Figure 11 and Figure 12.
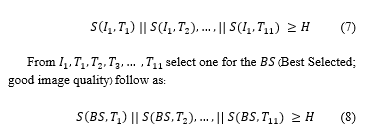
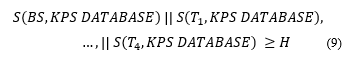
The template of a cattle has been created from 11 images which were marked as . The remaining 1 image has been used as input, and was marked as was a similarity function, and was a similarity score. A correctly identified cattle should strictly follow the next equation as:
 5.2.2. Scenario II
For all 47 KPS datasets from 47 cattle, the template of a cattle has been created from 4 images which were marked as from each period and 1 image, total 5 images. Each from dataset are registered with ordered by name kps_template_001 to kps_template_047. Then 47 muzzle print images in KPS database will be as follow:
5.2.3. Scenario III
For all 39 TKW datasets from 39 cattles, the template of a cattle has been created from 4 images which were marked as from each period and 1 image, total 5 images. Each from dataset are registered to DATABASE by order name tkw_template_001 to tkw_template_039. Then have 39 muzzle print images in TKW database, follow as:
 5.2.4. Scenario IV
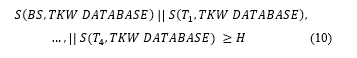
The total 86 datasets from the 47 KPS datasets (47 cattle) and the 39 TKW datasets (39 cattle), the template of a cattle has been created from 1 image which were marked as its nearby and 1 image, total 2 images. Each from dataset are registered to DATABASE by order name template_001 to template_086. Then have 86 muzzle print images in database, follow as the next equation:
![]() 5.2.5. Identification Time
5.2.5. Identification Time
For the evaluation of the identification time, “the number of image comparisons” and “the processing time of a single image comparison” will be considered in addition to “the total identification time”. The total processing time for an identification can be estimated by:
![]() where is the number of comparisons, is the processing time of a single comparison, and is the processing time for a search of the next candidate [30].
where is the number of comparisons, is the processing time of a single comparison, and is the processing time for a search of the next candidate [30].
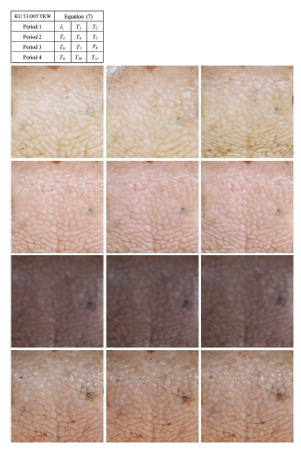 Figure 12: The identification Scenario works as follows *
12 images from KU 53/005 TKW.
5.2.6. Identification Accuracy
The performance metrics by contrast to traditional methods, biometric systems do not provide a cent percent reliable answer, it is quite impossible to obtain such a response. The comparison results between acquired biometric sample and its corresponding stored template is illustrated by a distance score. If the score is lower than the predefined decision threshold, then the system accepts the claimant, otherwise he is rejected. This threshold is defined according to the security level required by the application. Illustrates the theoretical distribution of the genuine and impostor scores. This figure shows that errors depend from the used threshold. Hence, it is important to quantify the performance of biometric systems. The International Organization for standardization ISO/IEC 19795–1 proposes several statistical metrics to characterize the performance of a biometric system [31].
In order to estimate the FMR, FNMR, and EER, suppose one biometric template is denoted by , and one presented sample (input) is denoted by . The similarity score between the template and the input is measured by the function . The hard decision is made according to a similarity threshold .
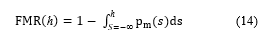
FMR is the rate that at which the decision is made as matches , while in fact and come from two different individuals. This means that the biometrics system accepts what should be rejected:
![]() where is the non-match distribution between two samples as a function of .
where is the non-match distribution between two samples as a function of .
FNMR is the rate which the decision made as does not match , while in fact and originated from the same individual. This means that the biometrics system rejects which should be accepted:
 where is the match distribution between two samples as a function of .
The Equal Error Rate (EER) is defined as the value of FMR and FNMR at the point of the threshold where the two error rates are identical :
![]() The similarity threshold should be chosen carefully in the system design phase according to the security level and the system’s sensitivity. The similarity threshold should achieve a trade-off between FMR and FNMR errors. FMR and FNMR are not objective measurements because they are influenced by the selected threshold emerging from the system’s application. However, FMR and FNMR are still possible to be used to measure performances of specific systems. The value of ERR can be used as a good indicator for measuring the system’s performance, and can be selected though the Receiver Operating Curve (ROC) [32].
The similarity threshold should be chosen carefully in the system design phase according to the security level and the system’s sensitivity. The similarity threshold should achieve a trade-off between FMR and FNMR errors. FMR and FNMR are not objective measurements because they are influenced by the selected threshold emerging from the system’s application. However, FMR and FNMR are still possible to be used to measure performances of specific systems. The value of ERR can be used as a good indicator for measuring the system’s performance, and can be selected though the Receiver Operating Curve (ROC) [32].
5. Results and Discussion
All scenarios is defined setup the best matcher method parameters that directed the number of keypoints with the follow best processing time in three matcher method include ORB, Ratio test, and FLANN as shown in Table 2. The analysis result of three matcher methods when running analysis shown the console left side from KU 53/102 KPS and right side from KU 53/005 TKW. Result display to separate from three matcher methods name and the last one display a identification result. All methods show the Query, Template, Descriptors (Des.1, Des.2), Keypoints (Key.1, Key.2), Matches (number of matches between Key.1 and Key.2), Extraction Time(s), Matching Time(s), Score, Threshold, and Muzzle print (Matches or Not Matches). In Ratio Test method show the Ratio test, and Good matches. In FLANN method show the Ratio test, and Matches mask.
The results in this paper have been running using a MacBook Pro macOS Catalina, 2.3 GHz Dual-Core Intel Core i5, 16 GB 2133 MHz LPDDR3, Intel Iris Plus Graphics 640 1536 MB.
Table 2: Parameter setup of three matcher method.
| Matcher method | Parameter setup | |
| ORB | ||
| Ratio test | ||
| FLANN |
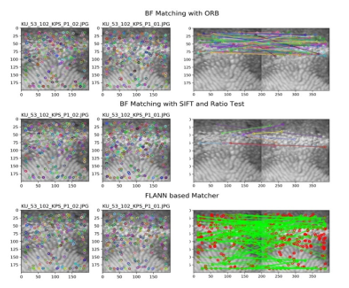 Figure 13: Image result with three matcher methods from KU 53/102 KPS.
Here, will see a result on how to match feature between two images. Then will try to find the query in template using feature matching. Using SIFT descriptors to match features with three matcher method are ORB, Ratio test, and FLANN shown in Figure 13 and Figure 14.
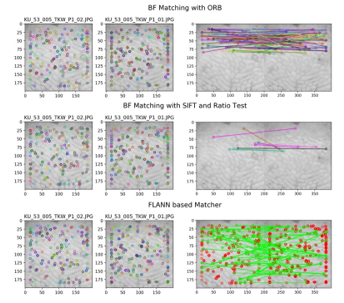 Figure 14: Image result with three matcher methods from KU 53/005 TKW.
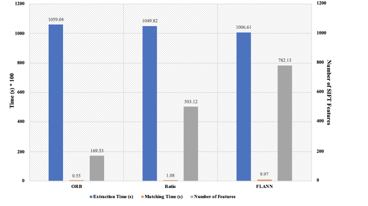 Figure 15: SIFT threshold with first collected template.
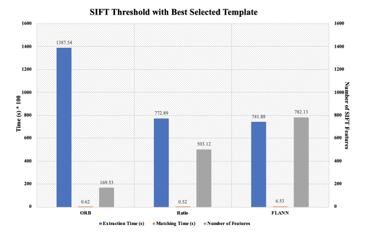 Figure 16: SIFT threshold with best selected template.
Figure 15 shown the result of Scenario I and Figure 16 shown is the SIFT threshold compared between the first collected template (period 1, ) and the best selected template (best of all periods, BS). BS was selected from clearer image with good light condition and shape. The number of SIFT features is matched keypoints between query and template. The time based on second multiply 100 (s * 100). All values are average from number of queries, number of cattle, and number of two locations. In ORB method, the first collected template given extraction time and matching time better than the best selected template. So, the best selected template is given the reduced time of extraction time and matching time in Ratio Test and FLANN methods. The number of the features is equal compare because a list of queries was not changes, but a template has been changed.
Scenario II result in Figure 17 and Scenario III result in Figure 18 show the score threshold to compare between two locations is KPS and TKW, respectively. All values are average from number of queries, and number of cattle. Then, the score threshold with KPS give ORB = 30, Ratio test = 120, and FLANN = 294. The score threshold with TKW in our method give ORB = 32, Ratio test = 127, and FLANN = 306. Some average from number of two locations in ORB = 31, Ratio test = 123.5, and FLANN = 300. So can be estimated setup the score threshold in ORB = 38, Ratio test = 32, and FLANN = 170 in Scenario IV for find candidate and identify cattle.
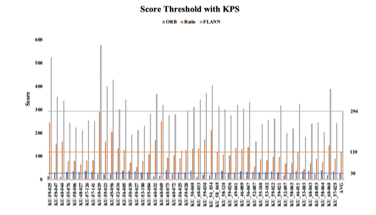 Figure 17: Score threshold with KPS.
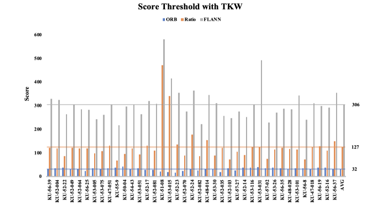 Figure 18: Score threshold with TKW.
Scenario IV result shows the characterization of the linear search. “Number of Comparisons” is the number of image comparisons conducted until the algorithm terminated, “Time for a Comparison” is the processing time required to conduct a single image comparison which includes feature extracting by SIFT, and “Time for a Search” is the processing time required to find the best template for the next comparison in the algorithm. The processing time for a single image comparison was computed separately same process in the linear search. The other values are computed from the results on the threshold of the optimum error rate.
In real time identification, one image of each individual cattle has been processed and enrolled in the database, the total images in the database were (1 86 = 86), and one image has been used as input to simulate the identification operation. According to Equation 11, in ORB method give 86 cattle out of 86 have been correctly identified which achieves equivalent identification accuracy value as 100%. It is worth notice that the average consumed feature extraction time is and the average individual matching time is , in Ratio test method give 72 cattle out of 86 have been correctly identified which achieves equivalent identification accuracy value as 83.72%. It is worth notice that the average consumed feature extraction time is and the average individual matching time is , in FLANN method give 80 cattle out of 86 have been correctly identified which achieves equivalent identification accuracy value as 93.02%. It is worth notice that the average consumed feature extraction time is and the average individual matching time is , including RANSAC optimization, which are consistent with Figure 15 and Figure 16.
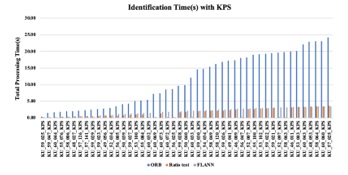 Figure 19: Identification Time(s) with KPS.
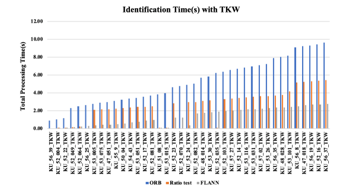 Figure 20: Identification Time(s) with TKW.
However, feature extraction time and matching time are considered very short in single point of feature extraction and matching operation. The identification time of each query cattle is shown in Figure 19 shows the identification time(s) with KPS, in ORB method give the total identification time still long, around , in Ratio test method give the total identification time still long, around , in FLANN method give the total identification time still long, around , at maximum. Figure 20 shows the identification time(s) with TKW, in ORB method give the total identification time still long, around 10 , in Ratio test method give the total identification time still long, around , in FLANN method give the total identification time still long, around . Such a linear database search has been used identification time is based on the index of the template in the database. The template is matches by similarity score with score threshold to candidate list. Finally, identified is determined according to the best score and confirmation by Cow Tag.
For identification status, an image naming scheme works as template_XXX, whereas XXX is the image order (1 to 86) by enrolled with Cow Tag. The identified status with ORB shows that great identified of 86 cattle all correctness. The identified status with Ratio test shows that identified of 14 cattle false with Cow Tag {Query:
[6] KU_56_25_TKW, [16] KU_51_08_TKW,
[17] KU_53_015_TKW, [19] KU_52_070_TKW,
[24] KU_52_035_TKW, [42] KU_60_044_KPS,
[57] KU_60_032_KPS, [58] KU_60_069_KPS,
[60] KU_60_072_KPS, [61] KU_56_025_KPS,
[64] KU_60_033_KPS, [72] KU_56_047_KPS,
[78] KU_52_097_KPS, [79] KU_58_063_KPS}.
The identified status with FLANN shows that identified of 6 cattle false with Cow Tag {Query:
[16] KU_51_08_TKW, [17] KU_53_015_TKW,
[20] KU_52_24_TKW, [48] KU_59_029_KPS,
[58] KU_60_069_KPS, [61] KU_56_025_KPS}.
The identification status shows incorrect identified because the similarity score is less than the defined score threshold.
High performance evaluation in ORB is 100% identified, the incorrect identified cattle is considered as false matched or false accepted input because the match occurred with a template that does not correspond to the query image. The FAR in this case is Ratio test = 16.28%, FLANN = 6.98%, and it equal to the identification ER. The relation between FAR, FRR, and ERR are determined according to the similarity threshold. Figure 21 shows the FAR of Ratio test versus FRR related to the similarity threshold, the ERR is shown as the cross point between FAR and ERR. ERR is 0.18 with threshold is 35.0. Figure 22 shows the FAR of FLANN versus FRR related to the similarity threshold, the ERR is shown as the cross point between FAR and ERR. ERR is 0.007 with threshold is 183.0.
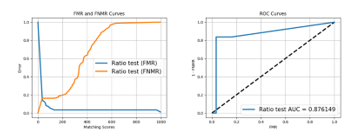 Figure 21: (a) FMR and FNMR curves and (b) ROC curves of Ratio test.
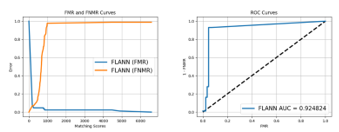 Figure 22: (a) FMR and FNMR curves and (b) ROC curves of FLANN.
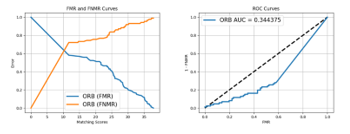 Figure 23: (a) FMR and FNMR curves and (b) ROC curves of ORB with Nearby BS.
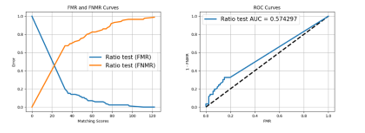 Figure 24: (a) FMR and FNMR curves and (b) ROC curves of Ratio test with Nearby BS.
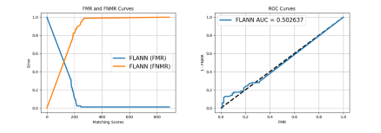 Figure 25: (a) FMR and FNMR curves and (b) ROC curves of FLANN with Nearby BS.
Nearby BS image results, Figure 23 shows the FAR of ORB versus FRR related to the similarity threshold, the ERR is shown as the cross point between FAR and ERR. ERR is 0.63 with threshold is 11.0. Figure 24 shows the FAR of Ratio test versus FRR related to the similarity threshold, the ERR is shown as the cross point between FAR and ERR. ERR is 0.44 with threshold is 23.0. Figure 25 shows the FAR of FLANN versus FRR related to the similarity threshold, the ERR is shown as the cross point between FAR and ERR. ERR is 0.52 with threshold is 120.0, because some of image from cattle not clearer.
Table 3 show ORB method is the best performance over Ratio test and FLANN method in term of performance evaluation.
Table 3. Comparison of three matcher methods.
| Process | Methods | ||
| ORB | Ratio test | FLANN | |
| Extraction Time | Normal | Good | Best |
| Matching Time | Best | Good | Normal |
| Number of Features | Low | Normal | High |
| Threshold | Low | Normal | High |
| Identification Time | Normal | Good | Best |
| Performance Evaluation | Best | Normal | Good |
6. Conclusion
Kamphaeng Saen Beef Cattle Identification Approach using Muzzle Print Image was developed with SIFT feature extraction and matching. The identification scenarios considered a dimension of 200 × 200 pixels, which collected 765 images from 86 cattle (KPS; 47 cattle, 391 images and TKW; 39 cattle, 374 images). The muzzle print images of each cattle were swapped between the enrolment and the identification phase. The ORB method shown the best performance over Ratio test and FLANN method in term of performance evaluation. In order to evaluate the robustness of the scheme, the collected images cover different deteriorating factors. The superiority of the presented scheme comes from the coupling of SIFT with RANSAC as a robust outlier removal algorithm. The achieved identification accuracy is given 92.25%. Therefore, the proposed of muzzle print images can be applied to register the Kamphaeng Saen beef cattle for breeding and marking systems. In the future work, some machine learning techniques should be developed for Sire and Dam of Kamphaeng Saen beef cattle identification in Thailand. Additionally, the real time identification by using is smartphone also challenging.
Acknowledgment
This research was funded by College of Industrial Technology, King Mongkut’s University of Technology North Bangkok (Grant No. Res-CIT0246/2020). We would like to thank the National Science and Technology Development Agency, Pathum Thani. Cowboy Land and KUBeef, Nakhon Pathom, Department of Animal Science, Faculty of Agriculture, Kasetsart University, Kamphaeng Saen Campus, Nakhon Pathom, Department of Animal Science, Faculty of Agriculture, Kasetsart University, Bangkhen, Bangkok and Tubkwang Research Center Saraburi, Thailand for supporting data.
- P. Nilchuen, S. Rattanatabtimtong, S. Chomchai, “Superrovulation with Different Doses of Follicle Stimulating Hormone in Kamphaeng Saen Beef Cattle,” Songklanakarin Journal of Science and Technology, 33(6), 679-683, 2011, doi: 10.3923/javaa.2012.676.680.
- C. Chantalakhana, B. Rengsirikul, P. Prucsasri, “A report on performance of thai indigenous cattle and their crossbred from American Brahman and Charolais sires,” Department of Animal Science, Faculty of Agriculture, Kasetsart University, Bangkok, Thailand, 11(4), 287-295, 1978, https://agris.fao.org/agris-search/search.do?recordID=TH19800531313. [Accessed 3 June 2020].
- S. Tumwasorn, K. Markvichite, P. Innurak, P. Prucsasri, C. Chantalakhana, S. Yimmongkol, P. Chitprasan, “Heterosis and additive breed effects on growth traits from crossing among Thai local, Charolais and American Brahman under Thai conditions,” Department of Animal Science, Faculty of Agriculture, Kasetsart University, Bangkok, Thailand, 28(1), 245-255, 1993, https://agris.fao.org/agris-search/search.do?recordID=TH1998000100. [Accessed 3 June 2020].
- P. Boonsaen, N. W. Soe, W. Maitreejet, S. Majarune, T. Reungprim, S. Sawanon, “Effects of protein levels and energy sources in total mixed ration on feedlot performance and carcass quality of Kamphaeng Saen steers,” Agriculture and Natural Resources, 51(1), 57-61, 2017, https://doi.org/ 10.1016/j.anres.2017.02.003.
- P. Prucsasri. “Kamphaengsaen Beef Cattle,” 3rd Edition, (in Thai) Kamphaengsaen Beef Breeders Association, Nakhon Pathom, Thailand, 57, 1977.
- P. Bunyavejchewin, S. Sangdid, K. Hansanet, “Potential of beef production in tropical Asia,” Proceedings of the 8th AAAP Animal Science Congress, Tokyo, Japan, Japan Society of Zootechnical Science, 1, 404-403, 1996.
- P.Prucsasri, “Kamphaengsaen Beef Cattle,” Neon Book Media, (in Thai), Nonthaburi, Thailand, 2015.
- P. Innurak, S. Yimmongkol, P. Skunmun, “Kamphaeng Saen synthetic Thai beef cattle breed: Its development, characteristics and prospects,” Proceedings of the 11th AAAP Animal Science Congress, Kuala Lumpur, Malaysia, 2, 51-53, 2004, https://agris.fao.org/agris-search/search.do? recordID=MY2014001336 [Accessed 10 July 2020].
- M. Neary and A. Yager. “Methods of Livestock Identification,” Farm Animal Management@Purdue, Department of Animal Sciences, Purdue University, 1-9, 2002, https://www.extension.purdue.edu/extmedia/as/as-556-w.pdf. [Accessed 15 July 2020]
- R.W. Bello, A. Z. H. Talib and A. S. A. B. Mohamed. “Deep Belief Network Approach for Recognition of Cow using Cow Nose Image Pattern,” Walailak Jounal of Science and Technology (WJST), 18 (5), 2021, doi: https://doi.org/10.48048/wjst.2021.8984.
- R. W. Bello, D. A. Olubummo, Z. Seiyaboh, O. C. Enuma, A. Z. Talib, A. S. A. Mohamed, “Cattle Identification: The History of Nose Prints Approach in Brief,” The 6th International Conference on Agricultural and Biological Sciences, Conference Series: Earth and Environmental Science, 594, 1-8, 2020, doi:10.1088/1755-1315/594/1/012026.
- A. K. Jain, A. Ross, S. Prabhakar, “An Introduction to Biometric Recognition,” IEEE Transaction on Circuits and Systems for Video Technology. 14 (1), 4-20, 2004, doi:10.1109/TCSVT.2003.818349.
- B. Ebert. “Identification of Beef Animals,” Alaba A&M and Aubum Universities, 1-8, 2006, https://ssl.acesag.auburn.edu/pubs/docs/Y/YANR-0170/YANR-0170-archive.pdf. [Accessed 17 July 2020]
- H. Minagawa, T. Fujimura, M. Ichiyanagi, K. Tanaka, M. Fang-quan, “Identification of Beef Cattle by Analyzing Images of their Muzzle Patterns Lifted on Paper,” Proceeding of the Third Asian Conference for Information Technology in Agriculture, Asian Agricultural Information Technology & Management, Beijing, China, 28(7), 596–600, 2002, https:// eurekamag.com/research/003/801/003801309.php. [Accessed 24 July 2020]
- B. Barry, U. A. Gonzales-Barron, K. McDonnell, F. Butler, S. Ward, “Using Muzzle Pattern Recognition as a Biometric Approach for Cattle Identification,” Transactions of the American Society of Agricultural and Biological Engineers, 50(3), 1073-1080, 2007, doi: 10.13031/2013.23121.
- C. Sian, W. Jiye, Z. Ru, Z. Lizhi, “Cattle Identification using Muzzle Print Images based on Feature Fusion,” The 6th International Conference on Electrical Engineering, Control and Robotics, Xiamen, China, IOP Conference Series: Materials Science and Engineering, 853, 1-7, 2020, doi:10.1088/1757-899X/853/1/012051.
- A. I. Awad, M. Hassaballah, “Bag-of-Visual-Words for Cattle Identification from Muzzle Print Images,” Applied Sciences, 9 (22), 1-12, 2019, doi:10.3390/app9224914.
- A. Noviyanto, A. M. Arymurthy, “Automatic Cattle Identification Based on Muzzle Photo Using Speed-Up Robust Features Approach,” Recent Advances in Information Science, 110–114, 2012, http://www.wseas.us/e-library/conferences/2012/Paris/ECCS/ECCS-17.pdf. [Accessed 4 August 2020]
- A. Tharwat, T. Gaber, “Cattle Identification using Muzzle Print Images based on Texture Features Approach,” the 5th International Conference on Innovations in Bio-Inspired Computing and Applications IBICA, Advances in Intelligent Systems and Computing, 303, 217-227, 2014, doi:10.13140 /2.1.3685.1202.
- H. A. Mahmoud, H. M. R. E. Hadad, “Automatic Cattle Muzzle Print Classification System Using Multiclass Support Vector Machine,” International Journal of Image Mining, 1(1), 126-140, 2015, doi:10.1504/ IJIM.2015.070022.
- T. M. Gaber, “Precision Livestock Farming: Cattle Identification Based on Biometric Data,” Faculty of Computers and Informatics Suez Canal University, Faculty of Agriculture, Ismailia, Egypt, 1-17, 2014, https://www.slideshare.net/Tarekgaber/precision-livestock-farming-cattle-identification-based-on-biometric-data-tarek-gaber-40692911.[Accessed 10 September 2020].
- H. M. El-Bakry, I. El-Hennawy, H. E. Hadad, “Bovines Muzzle Identification Using Box-Counting,” International Journal of Computer Science and Information Security, 12(5), 29-34, 2014, https://www. researchgate.net/publication/303960881_Bovines_Muzzle_Identification_Using_Box-Counting/stats. [Accessed 15 September 2020]
- D. G. Lowe, “Object Recognition from Local Scale-Invariant Features,” the 7th IEEE International Conference on Computer Vision, Kerkyra, Corfu, Greece, 1150–1157, 1999, doi:10.1109/ICCV.1999.790410.
- D. G. Lowe, “Distinctive Image Features from Scale-Invariant Keypoints,” International Journal of Computer Vision, 60(2), 91–110, 2004, doi:10.1023/B:VISI.0000029664.99615.94.
- E. Erwin, N. N. Br. Karo, A. Y. Sasi, N. Aziza, H. K. Putra, “The Enhancement of Fingerprint Images using Gabor Filter,” Journal of Physics Conference Series, 1196(1), 2019, doi:10.1088 /1742-6596/1196/1/012045.
- M. A. Fischler, R. C. Bolles, “Random Sample Consensus: A Paradigm for Model Fitting with Applications to Image Analysis and Automated Cartography,” Communications of ACM, 24(6), 381– 395, 1981, doi:https:// doi.org/10.1145/358669.358692.
- A. Jakubovi?, J. Velagi?, “Image Feature Matching and Object Detection using Brute-Force Matchers,” International Symposium ELMAR, Zadar, 83-86, 2018, doi: 10.23919/ ELMAR. 2018. 8534 641.
- G. Guo, H. Wang, D. A. Bell, Y. Bi, K. Greer, “KNN Model-Based Approach in Classification,” On The Move to Meaningful Internet Systems 2003: CoopIS, DOA, and ODBASE. OTM 2003. Lecture Notes in Computer Science, 2888, 986-996, 2003, doi:10.1007/978-3-540-39964-3_62.
- M. Muja, D.G. Lowe, “Fast Approximate Nearest Neighbors with Automatic Algorithm Configuration,” Proceedings of the 4th International Conference on Computer Vision Theory and Applications, Lisboa, Portugale, 1, 331-340, 2009, doi:10.5220/00 01787803310340.
- A. I. Awad, K. Baba, “Evaluation of a Fingerprint Identification Algorithm with SIFT Features,” Proceedings of the 3rd International Conference on Advanced Applied Informatics, Fukuoka, Japan,129–132, 2012, doi: 10.1109/IIAI-AAI.2012.34.
- D. Maltoni, D. Maio, A. K. Jain, S. Prabhakar, “Handbook of Fingerprint Recognition, Second Edition,” Springer-Verlag, 1-494, 2009.
- R. Giot, M. El-Abed, C. Rosenberger, “Fast Computation of the Performance Evaluation of Biometric Systems: Application to Multibiometrics,” Future Generation Computer Systems, Special Section: Recent Developments in High Performance Computing and Security, 29(3), 788–799, 2013, https://doi.org/10.1016/ j.future. 2012.02.003