Business Intelligence Budget Implementation in Ministry of Finance (As Chief Operating Officer)

Adv. Sci. Technol. Eng. Syst. J. 6(4), 123–129 (2021);
 DOI: 10.25046/aj060414
The Ministry of Finance is the state ministry in charge of state financial affairs which has two functions, namely the Chief Financial Officer (CFO) as the State General Treasurer and the Chief Operating Officer (COO) as a Budget User. As COO, the Ministry of Finance is expected to be able to provide information related to budget implementation to leaders quickly and accurately. The problem that occurs is the implementation information is still done manually, so it takes time to process. In addition, there is no information regarding budget predictions for the next semester or year. This study uses Business Intelligence (BI) as a technique in the process of building budget execution information. The Business Intelligence Roadmap is a methodology used to produce budget implementation information in the form of a dashboard. To see the prediction of the realization of the budget for the next semester or year using the forecasting method with the neural network model. the Results is budget implementation information can be accessed easily and has accurate data and can provide information to the leaders as supporting material in making decisions at the Ministry of Finance.
1. Introduction
Ministry of Finance is public sectors that in charge of financial affairs and state wealth. Ministry of Finance has a dual role in terms of the power of managing state finances, first as Chief Financial Officer (CFO) who has the duty of the State General Treasurer (BUN). Second, the Chief Operating Officer (COO) who has a duty as a Budget User. Ministry of Finance as the COO has twelve echelon I unit that have responsibility to formulating ministry strategies, preparing work plans and budgets, using resources efficiently and effectively, reporting on the performance and use of available resources, and evaluating performance results.
Based on the above responsibilities, the Ministry of Finance as COO is expected to be able to provide information on budget implementation in a transparently to the leaders. Figure 1 is the process of how to present data to the leaders. Based on Figure 1, the problem occurs is, it takes a long time and process to produce budget implementation information
Besides that, there is no accurate data available as supporting material for the leaders to makes the policies. The length of a process in data processing because it i is worked manually using Microsoft Excel. The downloaded data then filtered according to the needs to be presented. The data that has been processed then presented on each sheet, so to see the results, it must be clicked one by one on the available sheets. This job can reduce the speed of time in providing information and difficulty of processing data if there are employee mutations.
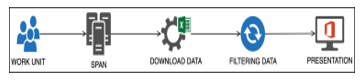 Figure 1: Process of Presenting Data
The right solutions for processing, analysis and presenting data is using Business Intelligence (BI). BI is a tools, technologies and solutions to extracting business information from a set of data [1]. Ministry of Finance has data that can be used to run BI, where the data is sourced from another system. The system is an integrated system of all processes related to the management. Recently the term “Business Intelligence” is referred to as “Business Analytics” [2]. Business Intelligence also provides stages and steps within a generate useful information for an organization.
This paper aims to produce budget implementation information using business intelligence which will be presented in the form of a dashboard and provide a data visualization of future prediction budget implementation trends.
2. Related Works
The role of Business Intelligence is constantly changing from what was previously only seen as an analytical application, now it is considered very important for organizational strategy. BI tools are considered a technology which results in efficient business operations by adding value to the company [3]. BI can help managers monitor and analysis quickly and efficiently [4]. BI is also the process an organizations or company take advantage of virtual and digital technology to collect, manage and then analysis data [5]. In another definition, BI is an applications and technologies for gathering, storing, cleanse, analysis, and providing access to data to help managers or leaders make sound business decisions on sound time [6].
According to [7], the most regularly used analysis are cross selling and up selling, customer segmentation and profiling, parameters of interest, survival time, customer loyalty and customer switching, credit assessment, fraud detection, logistics optimization, business process forecasts, service performance appraisals internet and internet content analysis.
BI projects are organized according to the same six stages common to every engineering project. Within each engineering stage, certain steps are carried out to see the engineering project through to its completion. Business intelligence roadmap describes sixteen development steps within six stages such as Justification Stage, Planning Stage, Business Analysis Stage, Design Stage, Construction Stage and Deployment Stage as in Figure 2 [8].
Data warehouse has a role as a data source in developing Business Intelligence. According [9], Data warehouse is a collection of data based on subject-oriented, integrated, not easy to change and datasets consist of varying times in support of management decisions. In a data warehouse schema, it usually consists of one fact table and several dimension tables, where the dimension table contains a more detailed description of the fact table [10]. In [11], the author said, some of the benefits provided by the data warehouse directly, that is users can perform extensive data analysis in various ways, consolidated data presentation, timely and better information, improved system performance results, and simplified data access. Extract, transform, loading (ETL) is a data integration framework that involves extracting data from data management systems and then cleaning it, transforming it according to business needs, and finally loading it into a database [12].
Data mining is a technology that is very useful in extracting helpful knowledge within hidden data collections [13]. In [14] the author state that data mining can be showed as a result of the natural evolution of information technology. Argue of [15] , said that data mining combined statistical analysis, machine learning techniques and database management in extracting forms from large databases. Other than that, data mining requires intensive computation for comparative data analysis [16].
Classification data mining is divided into two categories, that is predictive and descriptive [17]. In [18], the author states that predictive analysis is used to determine the future outcome of an event or possible situation, but it can also be used to automatically analysis large amounts of data with different variables. While the descriptive is presented in a short / summary form of data points and the main character is the data set [19].
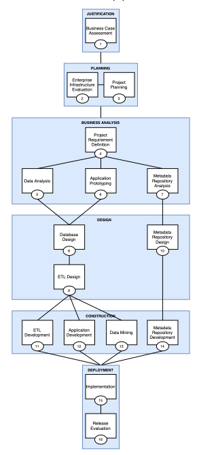 Figure 2: Business Intelligence Roadmap
One of the data mining techniques in conducting predictive analysis is Time Series Forecasting. Time Series Forecasting is a process that uses a model to predict future events based on known time [20]. This model is used because it develops a mathematical explanation that is similar to the biological processes of neurons [21]. Neural Network also has the ability to select all possibilities between variables and this technique is one of the best prediction methods [22]. The advantages of a Neural Network among others (1) has high accuracy for complex non-linear mapping approximations, (2) very flexible with noisy data, (3) not making priori assumptions about the distribution of the data (4) easy to update with new data and dynamic environment, (5) can be implemented in parallel hardware, (6) if there is a failure, it can proceed without problems due to its parallel nature.
The neural network can make an effective forecast for the financial market and the data can be taken directly from the Internet to provide real-time and off-line data processing and analysis [23].
3. Research Methodology
This research stage consists of thirteen steps. These stages have been simplified previously according to the business intelligence roadmap method. Figure 3 is a simplification step to produce business intelligence to be more effective and efficient. These steps are explained as follows.
3.1. Justification
Identify business needs. Determine business requirements, assessment decision-making solutions, competitor software that uses business intelligence, determine business intelligence application objectives, provide business intelligence solutions, perform risk measurement.
3.2. Planning
Plan the development of the project that will be completed and deployed. Determine technical specifications required for BI development, the source of data to be obtained, determine level of Critical success factor (CSF) and the project management level.
3.3. Business Analysis
Business analysis can help to formulating problems that will be developed of BI, with determining what results are desired from business analysis, such as the subject area, time, stage stages, detailed data and even what external data is needed to answer these business questions. Then [24] also argues that the business analysis approach is used as a quick decision making, where all stakeholders are involved through open discussions.
3.4. Design
Understand solutions to business problems or enables the business opportunity. Activities performed that is design BI database, monitoring and tuning database and query designs, design ETL process flow, set up the staging area.
3.5. Construction
Develop the product, which should provide a return on investment within a predefined time frame. Activities performed that is build and testing ETL process, build and testing the application program, datamining such as determine topology and activation function, perform initialization.
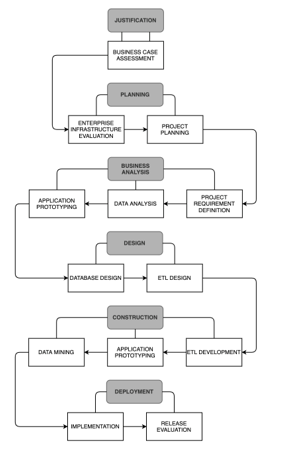 Figure 3: Research Steps
3.6. Deployment
Implement and finished the product, and then measure its effectiveness to determine whether the solution satisfy, exceeds, or fails within the expected return of investment. Activities performed that is planning for implementation, load the production database, set up the supporting, preparing a post implementation reviews, follow-up of meeting result after implementation.
4. Analysis and Result
Figure 4 is constellation schema because there is allocation and spending fact which correlated to dimension of register, fund, time, central, branch and region. A data warehouse is identified as a constellation, if the fact tables are linked [25]. In other words, constellations are schemes that have two or more facts connected to other dimensions. The source of the database is from the data warehouse which is backed up every day and then performs the process of extract, transform, and load (ETL). The data is stored in the BI database, namely DWDashboardBI. Figure 5 describes the ETL design flow from the source data (database source) to the destination database (database target).
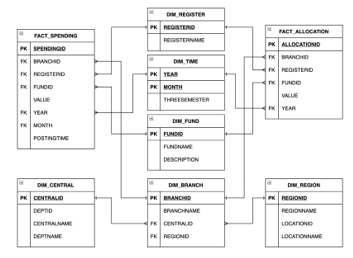 Figure 4: Constellation Schema
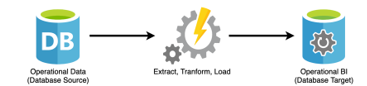 Figure 5: ETL Design
In data warehouse, several activities performed in the ETL process such as extracting, cleaning, conforming tables from and loading them into data warehouse [26]. The ETL process can be seen in Figure 6-13 and the software used to create ETL is Microsoft Visual Studio.
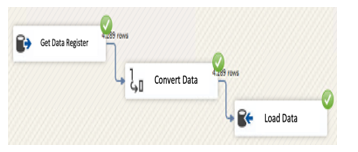 Figure 6: ETL Register Dimension
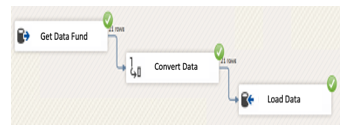 Figure 7: ETL Fund Dimension
Figure 6 describes the process of getting data from the M_Register table and then saving the data to the Dim_Register table.
Figure 7 describes the process of getting data from the M_Fund table and then saving the data to the Dim_Fund table.
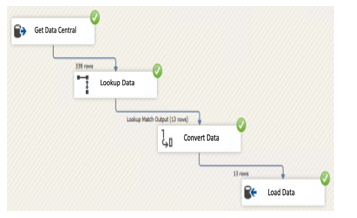 Figure 8: ETL Central Dimension
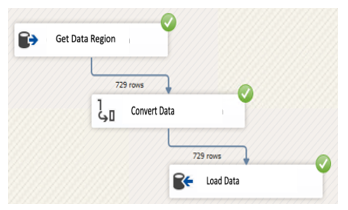 Figure 9: ETL Region Dimension
Figure 8 describes the process of getting data from the M_Central table and then saving the data to the Dim_Central table.
Figure 9 describes the process of getting data from the M_Region table and then saving the data to the Dim_Region table.
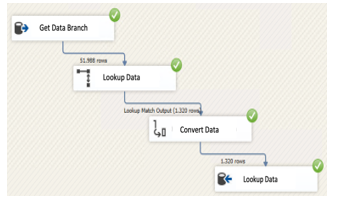 Figure 10: ETL Branch Dimension
Figure 10 describes the process of getting data from the M_Branch table and then saving the data to the Dim_Branch table.
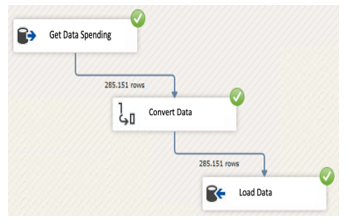 Figure 11: ETL Spending Fact
Figure 11 describes the process of getting data from the T_Spending table and then saving the data to the Fact_Spending table.
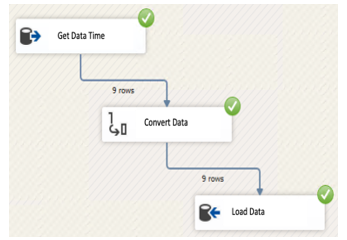 Figure 12: ETL Time Dimension
Figure 12 describes the process of getting data from the M_Time table and then saving the data to the Dim_Time table.
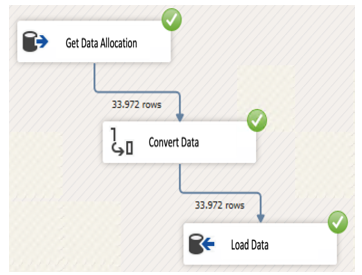 Figure 13: ETL Allocation Fact
Figure 13 describes the process of getting data from the T_Allocation table and then saving the data to the Fact_Allocation table.
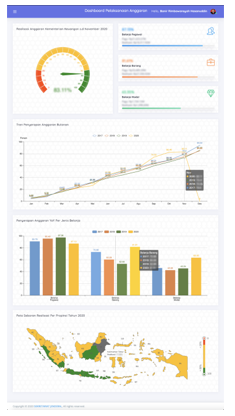 Figure 14: Dashboard BI Report
After ETL process is executed, the user can see the report from existing data in data warehouse. This report can help the leaders to analysis data about budget implementation in current years. Figure 14 is dashboard BI report which can be used as an overview in decision making. There are five headlines, such as Budget Implementation until now which is shown with speedometer chart, realization of budget implementation by expenditure, Trend of spending monthly in year on year, budget implementation year on year by expenditure and spending budget by region in map chart. This dashboard was made using PHP with CodeIgniter framework, jQuery and CSS.
The use of the php programming language with the CodeIgniter framework, CSS and jQuery makes it easy to build a dashboard because it is a programming language that is easy to learn, open source, has a large community, easy to maintain and develop rapidly.
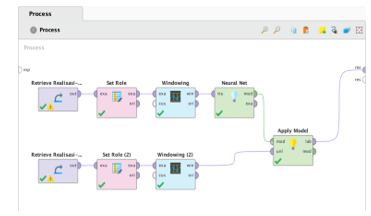 Figure 15: Figure Time Series with Neural Network Model
The Forecasting method is a method used to produce predictions of budget implementation values for the following semester and RapidMiner is a tool for performing this forecasting method. This method is used because the data contains time series information. While the algorithm model used is Neural Network as in Figure 15. Figure 16 shows the results of the prediction table which is divided into 4 columns according to the windowing parameters that have been set.
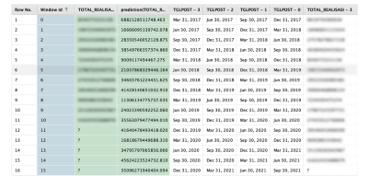 Figure 16: Result of Prediction Table
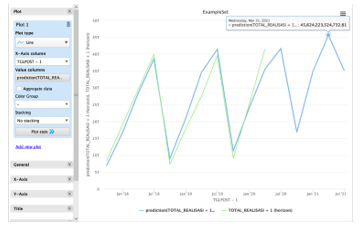 Figure 17: Chart of Spending and Allocation Prediction
In Figure 17 is a graph of its expenditure and prediction. The graph was shown in the form of a line graph by juxtaposing data on total expenditure and predicted of total expenditure. The green line represents the total expenditure data and the blue one is the prediction result. When we see in plain view, the result of predictions are close to with actual of total expenditure.
5. Conclusion
Based on the results of the data analysis which has been done, the following concluded:
- The Business Intelligence dashboard which was developed at the Ministry of Finance as COO, it can be known the trend of total budget implementation, per type of expenditure, and by region or province in Indonesia.
- The Business Intelligence dashboard can also provide predictions about the budget implementation that will happen for the following years, so that can help the leaders to analysis data descriptively within decision making appropriately.
- The Business Intelligence dashboard can speed-up the process of presenting data quickly and can be accessed anywhere.
The recommendation to the next developments of BI dashboard are:
- Can provide insight to the leaders about prediction of the budget ceiling by unit of echelon 1 with include the value of inflation that happened in Indonesia.
- Linked Business Intelligence with performance data for unit of echelon 1, so that can see the relationship between the result of performance values with the amount of budget received.
Conflict of Interest
The authors declare that there is no conflict of interests on this paper.
Acknowledgment
I am especially grateful for Dr. Sani Muhammad Isa for his advice in making this paper and I also wish to express my deep thanks to Department of Computer Science Bina Nusantara University for their kindness and helps to my studies.
- B. Moçka, G. Beqiraj, D. Leka, “Evaluation of Business Intelligence Maturity Level in Albania Banking Systems,” International Journal of Advanced Technology and Engineering Exploration ISSN, (7), 2394–5443, 2015.
- D. Delen, G. Moscato, I.L. Toma, “2018 International Conference on Information Management and Processing, ICIMP 2018,” 2018 International Conference on Information Management and Processing, ICIMP 2018, 2018-Janua, 49–53, 2018.
- J. Ranjan, “Business Intelilgence: Concepts, components, techniques and benefits,” Journal of Theorical and Applied Information Technology, 9(1), 60–70, 2009.
- V. Khatibi, A. Keramati, G.A. Montazer, “A Business Intelligence Approach to Monitoring and Trend Analysis of National R&D Indicators,” EMJ – Engineering Management Journal, 29(4), 244–257, 2017, doi:10.1080/10429247.2017.1380578.
- S. Rouhani, M. Ghazanfari, M. Jafari, “Evaluation model of business intelligence for enterprise systems using fuzzy TOPSIS,” Expert Systems with Applications, 39(3), 3764–3771, 2012, doi:10.1016/j.eswa.2011.09.074.
- M.M. Nazier, D.A. Khedr, A.P.M. Haggag, “Business Intelligence and its role to enhance Corporate Performance Management,” International Journal of Management & Information Technology, 3(3), 08–15, 2013, doi:10.24297/ijmit.v3i3.1745.
- C.M. Olszak, “Toward Better Understanding and Use of Business Intelligence in Organizations,” Information Systems Management, 33(2), 105–123, 2016, doi:10.1080/10580530.2016.1155946.
- L.T. Moss, S. Atre, Business intelligence roadmap: the complete project lifecycle for decision-support applications, Addison-Wesley Professional, 2003.
- W.H. Inmon, Building the Data Warehouse,3rd Edition, 2002.
- A.S. Girsang, S.M. Isa, A.L. Haris, Arwan, K. Mandagie, L.R. Ariana, V. Ardinda, “Business Intelligence for Product Defect Analysis,” IOP Conference Series: Materials Science and Engineering, 598(1), 2019, doi:10.1088/1757-899X/598/1/012117.
- R. Sharda, D. Delen, E. Turban, “Business Intelligence: A Managerial Perspective on Analytics,” 4(1), 386, 2013.
- M. Madhikerrni, K. Främling, “Data discovery method for Extract- Transform-Load,” 2019 IEEE 10th International Conference on Mechanical and Intelligent Manufacturing Technologies, ICMIMT 2019, (Icmimt), 174–181, 2019, doi:10.1109/ICMIMT.2019.8712027.
- S. Hajian, J. Domingo-Ferrer, “A methodology for direct and indirect discrimination prevention in data mining,” IEEE Transactions on Knowledge and Data Engineering, 25(7), 1445–1459, 2013, doi:10.1109/TKDE.2012.72.
- J. Han, J. Pei, M. Kamber, Data Mining: Concepts and Techniques, Elsevier, 2011.
- M.P. Bach, A. ?eljo, J. Zoroja, “Technology Acceptance Model for Business Intelligence Systems: Preliminary Research,” Procedia Computer Science, 100, 995–1001, 2016, doi:10.1016/j.procs.2016.09.270.
- R. Sowmya, K.R. Suneetha, “Data Mining with Big Data,” Proceedings of 2017 11th International Conference on Intelligent Systems and Control, ISCO 2017, 26(1), 246–250, 2017, doi:10.1109/ISCO.2017.7855990.
- S. Umadevi, K.S.J. Marseline, “A survey on data mining classification algorithms,” Proceedings of IEEE International Conference on Signal Processing and Communication, ICSPC 2017, 2018-Janua(July), 264–268, 2018, doi:10.1109/CSPC.2017.8305851.
- N. Mishra, S. Silakari, “Predictive Analytics?: A Survey , Trends , Applications ,” International Journal of Computer Science and Information Technologies, 3(3), 4434–4438, 2012.
- N. Jain, “Data Mining Techniques:a Survey Paper,” International Journal of Research in Engineering and Technology, 02(11), 116–119, 2013, doi:10.15623/ijret.2013.0211019.
- S. Saigal, D. Mehrotra, “Performance Comparison of Time Series Data Using Predictive Data Mining Techniques,” Advances in Information Mining, 4(1), 57–66, 2012.
- V. Kotu, B. Deshpande, Predictive Analytics and Data Mining: Concepts and Practice with RapidMiner, Morgan Kaufmann, 2014.
- A.M. Shahiri, W. Husain, N.A. Rashid, “A Review on Predicting Student’s Performance Using Data Mining Techniques,” Procedia Computer Science, 72, 414–422, 2015, doi:10.1016/j.procs.2015.12.157.
- X. Pang, Y. Zhou, P. Wang, W. Lin, V. Chang, “An innovative neural network approach for stock market prediction,” Journal of Supercomputing, 76(3), 2098–2118, 2020, doi:10.1007/s11227-017-2228-y.
- T. ur Rehman, M.N.A. Khan, N. Riaz, “Analysis of Requirement Engineering Processes, Tools/Techniques and Methodologies,” International Journal of Information Technology and Computer Science, 5(3), 40–48, 2013, doi:10.5815/ijitcs.2013.03.05.
- S. Sen, “Integrating Related XML Data into Multiple Data Warehouse Schemas,” Computer Science Conference Proceedings, 4(April), 357–367, 2012, doi:10.5121/csit.2012.2133.