Estimation of the Population Mean for Incomplete Data by using Information of Simple Linear Relationship Model in Data Set

Adv. Sci. Technol. Eng. Syst. J. 6(4), 161–169 (2021);
 DOI: 10.25046/aj060419
The objective of this research is to propose the estimator of the population mean for incomplete data by using information of simple linear relationship model in the data set. In addition, the factorization of the likelihood function is created to derive the maximum likelihood estimator for the population mean. The simulation study was conducted for 630 situations to compare the efficiency of the proposed estimator with the two population mean estimators, namely pairwise deletion and Anderson estimators. In this study, two criteria—bias and mean square error—of the performances for estimators are examined. It is found that all percentage levels of missing data, the mean square error of the proposed estimator tends to be lower than those of pairwise deletion and Anderson estimators for the large correlation levels between two variables in the data set whatever the sample sizes will be, especially for the large percentage level of missing data. However, for the small correlation between two variables in the data set, the three estimators tend to have the same performances in terms of both two criteria for all sample sizes and all percentage levels of missing data.
1. Introduction
Missing data are frequently found in many fields of research [1,2]. For example, some individuals may refuse to express any attitude for some sensitive questions in an opinion survey. In an experimental research, the experimental units may be leave or die before the experiment is completed. In longitudinal study, the monotone missing data pattern usually occurs. These missing data problems lead to increase an inaccuracy of the inference about the parameters in the population if the researchers ignore about the missing value in the data set. In estimation of the population mean for incomplete data set, imputation technique [3,4] is one of the familiar methods that researchers used it to replace the missing values with substituted values before estimate the population mean by using standard methods. However, the variance of estimator for this technique is underestimated and lead to the wrong inference about the population mean [5–7]. Available cases analysis is another technique that sample mean is used for estimation about the population mean and sometimes this is called pairwise deletion method. Moreover, this method will not suitable for the large amount of missing values because it will give the biased estimator and its standard error will increase [5, 8]. Ignoring missing values from the data set for inferential statistical analysis will affect the reliability of the conclusion about parameter in the population as the studied of [9–13]. Therefore, there are several researchers proposed about the estimators of the population mean for incomplete data set by considering only available cases analysis as follows: the maximum likelihood estimators of parameters for a bivariate normal distribution and case of some observations are missing for one variable were studied by [14]. That is, the factorization of likelihood function approach that proposed by [14] has been mostly used to derive the estimators of parameters for incomplete data set such as the studied of [15] and the research of [16]. Furthermore, these studies were found that the estimators derived by using likelihood function approach have a good performance, especially for a small sample size. Therefore, the proposed estimator of the population mean for incomplete dataset was derived based on a factorization of the likelihood function and using information of a simple linear relationship model in the data set. Moreover, a simulation study was conducted 630 situations to compare the efficiency of the proposed estimator with the two estimators, namely pairwise deletion estimator and Anderson estimator. In this study, the efficiency comparison criteria are bias and mean square error (MSE).
2. Materials and Methods
In this paper, the estimation methods of a population mean for incomplete data set are studied for efficiency comparison as follows:
2.1. Anderson Estimator
In 1957, the maximum likelihood estimators of the parameters of a bivariate normal distribution for incomplete data set with one variable was proposed by [14]. Suppose random variables and have the bivariate normal distribution with mean vector and covariance matrix . Suppose r observations of and are bivariate normally distributed with mean vector and covariance matrix . In addition, n– r observations of are normally distributed with mean and variance . The data are shown in Figure 1.
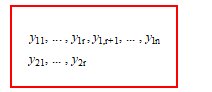 Figure 1: Missing data pattern of the bivariate normal distribution
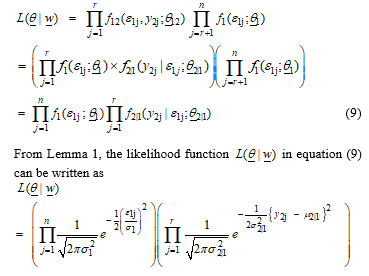
From data pattern in Figure 1, the likelihood function of vector parameter can be written in the formula of equation (1).
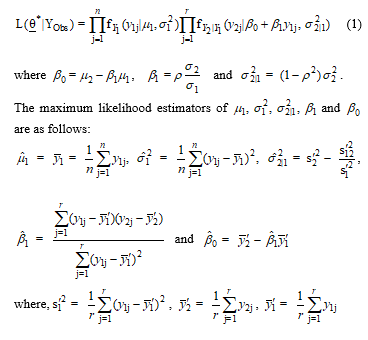
and . Moreover, the maximum likelihood estimators of and are given by and , respectively.
2.2. Pairwise Deletion Estimator
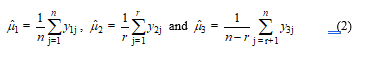
In this study, pairwise deletion estimator is the estimation of the population mean for incomplete data set based on complete data or available-cases analysis [5], even if the values for the same individual on other variables are missing. Suppose three variables and are trivariate normally distributed in the population and n observations of are completely observed for all individuals, but and are not completely observed for all individuals or they have missing data occurrence. That is, r observations of are observed whereas n– r observations of are observed. Available cases analysis for the population means and can be written in the forms of equation (2).
 Under MCAR [5] of the missing data mechanism, pairwise deletion method will yield consistent and unbiased estimators in a large sample size [5].
2.3. The Proposed Estimator of the Population Mean for Incomplete Data Set
In this section, the estimator of the population mean for incomplete data set is proposed. This proposed estimator is derived using the factorization of the likelihood function [5,14] and a procedure of finding the usual maximum likelihood estimator is applied. Suppose dependent variable is assumed to have the linear relationship with independent variable and its relationship model is given by equation (3).
![]() where and are unknown parameters, and are random errors that have the normal distribution with mean 0 and variance . Then the mean and variance of can be written as and , respectively. Further, can be written in the form of equation (4).
where and are unknown parameters, and are random errors that have the normal distribution with mean 0 and variance . Then the mean and variance of can be written as and , respectively. Further, can be written in the form of equation (4).
![]() Let be a random variable is normally distributed with mean and variance . In addition, r observations of and are assumed to be the bivariate normal distribution with mean vector and covariance matrix . The n– r observations of are normally distributed with mean and variance . The study data pattern is shown in Figure 2.
Let be a random variable is normally distributed with mean and variance . In addition, r observations of and are assumed to be the bivariate normal distribution with mean vector and covariance matrix . The n– r observations of are normally distributed with mean and variance . The study data pattern is shown in Figure 2.
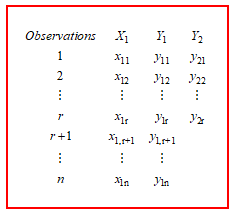 Figure 2: Missing data pattern of the proposed study
Let be a random variable that have the relationship of and in the form of . Then two random variables and are bivariate normally distributed with mean vector and covariance matrix Additionally, the missing data pattern of and are shown in Figure 3.
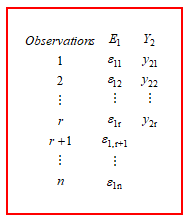 Figure 3: Random error and missing data pattern of
Lemma 1 Let , and be the random variables where are unknown parameters and be independent variable. Suppose and are bivariate normally distributed with mean vector and covariance matrix . Then, is normally distributed with mean and variance where , and .
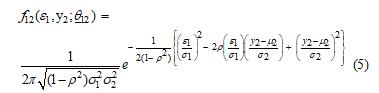 Proof Let and be bivariate normally distributed with mean vector and covariance matrix . Then, the joint probability density function of and is given by equation (5).
where , and . Moreover, the probability density function of is given by equation (6).
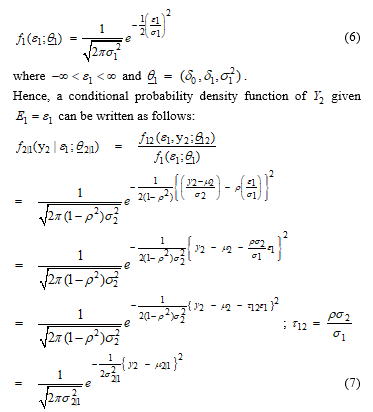
From Equation (7), this is the probability density function of a normal distribution with mean and variance . Therefore, a random variable is normally distributed with mean and variance where and
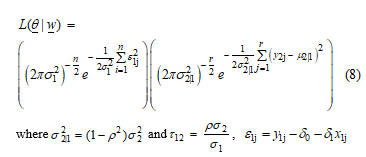
Lemma 2 For the two random variables and are assumed to have the bivariate normal distribution with a mean vector and covariance matrix . For the random variable is assumed to have a normal distribution with a mean 0 and variance where ; and are unknown parameters and be independent variable. Let be a random vector. Then, the likelihood function of parameter vector is denoted by equation (8).
 Proof For the two random variables and are assumed to have a bivariate normal distribution with mean vector and covariance matrix For the random variable is assumed to have a normal distribution with a mean 0 and variance .
Let be a vector of value for the random vector Then, the likelihood function of can be written as follows:
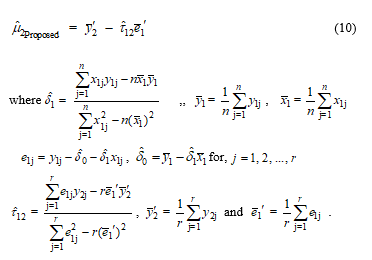
 Theorem 1 For the two random variables and are assumed to have a bivariate normal distribution with mean vector and covariance matrix . For the random variable is assumed to have a normal distribution with mean 0 and variance where ; and are unknown parameters and be independent variable. Let be a random vector. Then, the factorization maximum likelihood estimator of is given in equation (10).
 Proof Let be a random vector. From Lemma 2, we known that the likelihood function of is denoted by equation (8). Then, the log-likelihood function can be written in the form of equation (11).
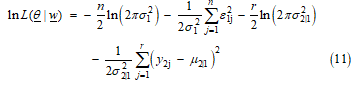 From Lemma 1, the random variable is normally distributed with mean and variance where and Then, the log-likelihood function as shown in equation (11) need to maximize and achieve the maximum likelihood estimators of , , and are as follows:
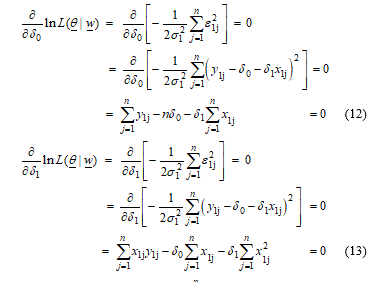 Equation (12) is multiplied by , then it will give the form in equation (14).
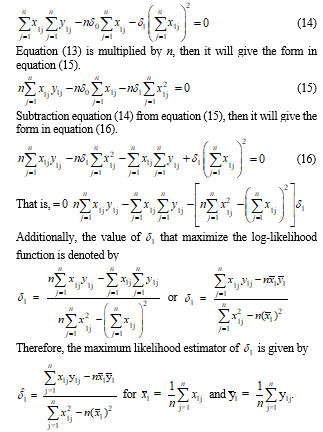
From equation (12), the form of this equation can be written as or . Then, the maximum likelihood estimator of is given by .
From Lemma 1, we know that then the maximum likelihood estimator of parameter can be derived as follows:
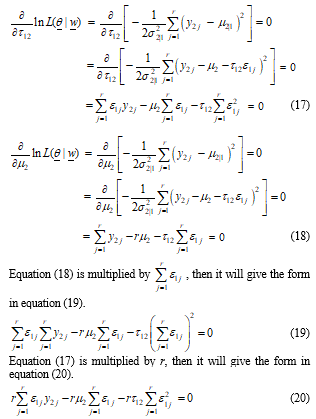 Subtraction equation (19) from equation (20), then it will give the form in equation (21).
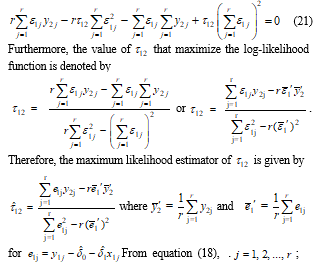 where and for ; . From equation (18), or Therefore, the maximum likelihood estimator of parameter is given by .
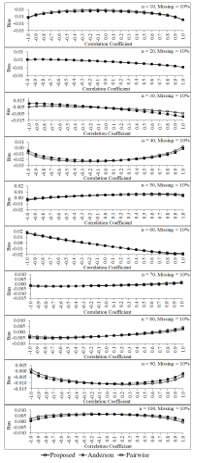 Figure 4: Biases of the three estimators for percentage of missing data equals 10 of each sample size
3. Results of a Simulation Study
The efficiency investigation of the proposed estimator and comparison of its efficiency with the two estimators—Anderson and pairwise deletion estimators—are studied via the simulation data. Moreover, these data are generated 630 situations and repeated 50,000 times for each situation. In this section, the criteria in terms of bias and mean square error are used for efficiency comparison. The population data of random variables and are generated in the form of bivariate normal distribution with mean vector and covariance matrix .
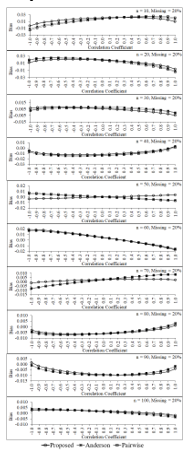 Figure 5: Biases of the three estimators for percentage of missing data equals 20 of each sample size
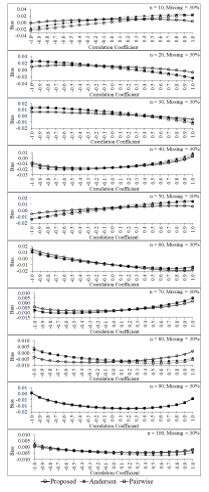 Figure 6: Biases of the three estimators for percentage of missing data equals 30 of each sample size
In this study, the values of parameters are defined as follows: and the correlations between and are given by . Then, the samples of size n = 10, 20, 30, …, 100 are randomly taken from these populations. Missing data mechanism in the form of MCAR [5] for three levels—10%, 20% and 30%—are constructed from each sample. The simulation results are shown in Figure 4 to Figure 9. Figure 4 to Figure 6 show that when percentages of missing data equal 10, 20 and 30 of each sample size, bias of the proposed estimator tends to be no difference from those of pairwise deletion and Anderson estimators for almost all sample sizes and all levels of the correlation between two variables in the data set. Moreover, some situations (e.g., n = 20, 30 and percentage of missing data in the data set equals 30) and negative high correlation between two variables, its bias tends to be smaller than the bias of pairwise deletion and Anderson estimators.
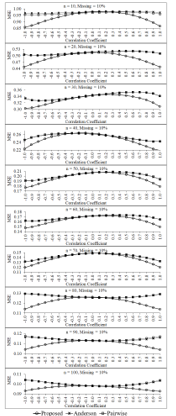 Figure 7: Mean square errors of the three estimators for percentage of missing data equals 10 of each sample size
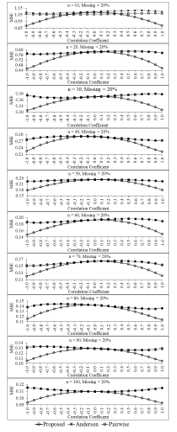 Figure 8: Mean square errors of the three estimators for percentage of missing data equals 20 of each sample size
When considering the performance of the proposed estimator in term of mean square error in Figure 7, it is found that the mean square error of the proposed estimator tends to be lower than those of pairwise deletion and Anderson estimators for the large correlation levels between two variables in the data set and all sample sizes when the data have 10 % of missing data.
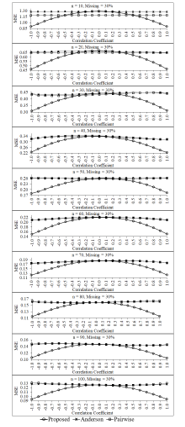 Figure 9: Mean square errors of the three estimators for percentage of missing data equals 30 of each sample size
For higher percentages of missing data of each sample sizes as show in Figure 8 and Figure 9, the performance of the proposed estimator in term of mean square error are similar to the case of the small percentages of missing data as mention above. Additionally, the mean square error of the proposed estimator tends to be obviously lower than those of pairwise deletion and Anderson estimators for the large correlation levels between two variables in the data set whatever the sample sizes will be. However, for the small correlation levels between two variables in the data set, the three estimators tend to have the same performances in terms of both two criteria—bias and mean square error—for all sample sizes and all percentage levels of missing data. This simulation study is found that the mean square errors of three estimators tend to be decrease when the sample size increases for all levels of the correlations between two variables in the data set and all levels of the percentages of missing data. In addition, the mean square error of the proposed estimator tends to be lower than those of the two estimators—pairwise deletion and Anderson estimators—for the small sample sizes (e.g., n = 10, 20, 30) and high correlations (e.g., r = -0.1, -0.9, -0.8, 0.8, 0.9, 1.0) between two variables in the data set, especially the percentage of missing data is equal to 30. However, the mean square errors of three estimators tend to have a similar performances for the low correlations between two variables in the data set and all levels of the percentages of missing data.
4. Discussion
In this study, the simulation results show that pairwise deletion estimator tends to be a biased estimator for the small sample sizes as mention by [5,9]. Moreover, the maximum likelihood estimator of the population average for incomplete data set is derived by using factorization of the likelihood function approach [14] tends to have a good performance for the large correlation levels between two variables in the data set and small sample sizes. This conforms to the studies of [14,16]. In addition, the maximum likelihood estimation of the population mean for incomplete data set tends to have a good efficiency for small sample sizes as the study of [7]. This discovery of the proposed estimator will benefit for some applications in the real life data, especially nowadays it is the era of big data analysis which has the large number of variables in data set. Therefore, we should find the relationships of some attributes in data set before estimating the average of the interested variables for incomplete data analysis. Further, this proposed estimator will lead to correct estimate as possible.
5. Conclusion
The proposed estimator of the population mean for incomplete dataset was derived by using the linear relationship between some variables in the data set and the factorization of likelihood function [14] was created to derive the proposed maximum likelihood estimator. Additionally, the investigation of this proposed estimator was studied via the simulation data for 630 situations to compare the efficiency in terms of bias and mean square error with two estimators, namely pairwise deletion and Anderson estimators. It is found that the efficiency of the proposed estimator tends to be better than those of two above mention estimators, especially for case of the high percentages of missing data and the strong linear correlation between two variables (e.g., the degree of r close to -1 or 1) whatever the sample size will be. However, for the small correlation between two variables (e.g., the degree of r close to zero), the three estimators tend to have the similar efficiencies for all sample sizes and all percentage levels of missing data.
Acknowledgment
The authors would like to express our special thanks of gratitude to head of Kasetsart University Research and Development Institute (KURDI) for financial support of this research.
- S. Gaucher, O. Klopp, G. Robin, “Outlier detection in networks with missing links,” Computational Statistics & Data Analysis, 164, 107308, 2021, doi:10.1016/j.csda.2021.107308.
- L.A. Vale-Silva, K. Rohr, “Long-term cancer survival prediction using multimodal deep learning,” Scientific Reports, 11(1), 1–12, 2021, doi:10.1038/s41598-021-92799-4.
- J.A. Smith, J.H. Morgan, J. Moody, “Network sampling coverage III: Imputation of missing network data under different network and missing data conditions,” Social Networks, 68(June 2021), 148–178, 2022, doi:10.1016/j.socnet.2021.05.002.
- N. Kumar, M.A. Hoque, M. Sugimoto, “Kernel weighted least square approach for imputing missing values of metabolomics data,” Scientific Reports, 11(1), 1–12, 2021, doi:10.1038/s41598-021-90654-0.
- R.J.A. Little, D.B. Rubin, Statistical Analysis with Missing Data, John Wiley&Son, 2002.
- M.N. Norazian, Y.A. Shukri, R.N. Azam, A.M.M. Al Bakri, “Estimation of missing values in air pollution data using single imputation techniques,” ScienceAsia, 34(3), 341–345, 2008, doi:10.2306/scienceasia1513-1874.2008.34.341.
- P.T. Von Hippel, “The Bias and Efficiency of Incomplete-Data Estimators in Small Univariate Normal Samples,” Sociological Methods and Research, 42(4), 531–558, 2013, doi:10.1177/0049124113494582.
- A.F. C.R. Rao, H. Toutenburg, Linear models: least squares and alternatives, 2nd ed., Springer Verlag, 1999.
- A.C. Acock, “Working With Missing Values,” Journal of Marriage and Family, 67(November), 1012–1028, 2005.
- D.W. A. Rotnitzky, “A Note on the biased of estimators with missing data,” Biometrics, 50, 1163–1170, 1994.
- M.H. Gorelick, “Bias arising from missing data in predictive models,” Journal of Clinical Epidemiology, 59(10), 1115–1123, 2006, doi:10.1016/j.jclinepi.2004.11.029.
- P.L. Roth, J.E. Campion, S.D. Jones, “The impact of four missing data techniques on validity estimates in Human Resource Management,” Journal of Business and Psychology, 11(1), 101–112, 1996, doi:10.1007/BF02278259.
- G. Fitzmaurice, “Missing data: implications for analysis,” Nutrition, 24, 200–202, 2008.
- T.W. Anderson, “Maximum likelihood estimates for the multivariate normal distribution when some observations are missing,” Journal of the American Statistical Association, 52, 200–203, 1957.
- A.M. C. Gourieroux, “On the problem of missing data in linear models,” Review of Economic Studies, 48(4), 579–586, 1981.
- J. Sinsomboonthong, “Jackknife maximum likelihood estimates for a bivariate normal distribution with missing data,” Journal of Thai Statistical Association, 9(2), 151–169, 2011, doi:10.1214/aos/1176345020.