An Efficient Combinatorial Input Output-Based Using Adaptive Firefly Algorithm with Elitism Relations Testing
 , Rozmie Razif Othman 1, Yasmin Mohd Yacob 1, Haitham Saleh Ali Ben Abdelmula 2
Adv. Sci. Technol. Eng. Syst. J. 6(4), 223–232 (2021);
 DOI: 10.25046/aj060426
Combinatorial software testing is regarded as a crucial part when it comes to the software development life cycle. However, it would be impractical to exhaustive test highly configurable software due to limited time as well as resources. Moreover, a combinatorial testing strategy would be to employ input-output-based relations (IORs) due to its benefits versus other forms of testing as it concentrates on program output as well as interactions amongst certain input value parameters. However, there are few studies focused on IOR strategies. Although the IOR strategy has been demonstrated to minimize test suite size because of its inherent properties, size could be decreased by appropriately choosing the “don’t care value” pertaining to the test cases. To achieve a result, this paper demonstrates a unified strategy by considering the new meta-heuristic algorithm known as the adaptive firefly algorithm (AFA) in order to design an IOR strategy. In contrast to the existing work, the adaptive firefly algorithm represents a novel approach to integrate between test cases pertaining to t-way test suite generation by deploying elitism operator in classical firefly algorithm. The optimization algorithm method has been put forward to be adopted along with this strategy. Because of this, AFA is expected to deliver promising results when employing the IOR strategy. As per the experimental results backed by non-parametric statistical analysis, AFA demonstrated to offer competitive performance versus its counterparts. In particular, AFA has been found to achieve and match 68% with regards to the best sizes based on the published benchmark results including 32% new known best sizes. This finding could aid in the area of software testing by reducing the number of test cases pertaining to test execution.
1. Introduction
Software failure is deemed as a dreadful outcome because it could impact the costs associated with software growth. Software testers usually employ dynamic testing to identify if there are any errors in the system under test. Determination of a number of test cases is done to execute a testing activity. Within the path pertaining to the testing activity, a comparison of the real behavior pertaining to the system is done with the expected behavior [1]. All the values pertaining to each of the parameters have to be tested one time at least. It would be inefficient to test the values individually. It also results in an exhaustive parameter-value combination testing [2]. We need more time for exhaustive testing, also we need to run various test cases. As an alternative, combinatorial testing could be used[1-3]. Most of the current methods do not detect errors caused by a set of multi-input parameters like interfaces that involve greater than two parameters [4], [5]. Recently, t-way testing (t denotes an interaction strength), is being widely employed to overcome the issue T-way testing consists of three forms: variable strength, uniform strength, and relations according to input-output. T-way strategies could be employed by either pure computational, algebraic, or optimization algorithm. Much of the study focused on optimization algorithm; however, it covers only strength less than three, variable strength, input/output based interaction, constraints, seeding, and sequence [6]. A major concern of meta-tests by using optimization is including an interaction test suite with the fewest test cases [7]. Even though the majority of current T-strategies are considered essential and very useful, there is no specific strategy or optimization algorithm method that suits the needs of input-output relationships [6], [8], [9]. Several optimization methods have employed nature-inspired strategies like Genetic Algorithm, Simulated Annealing, Particle Swarm Optimization, Firefly Algorithm, and Ant Colony Optimization. These strategies were designed to obtain optimal, yet efficient results. However, the NP-hard problem is deriving the best test cases. Therefore, not one strategy could be considered the best [6], [9]. These strategies have a proven track record when they can generate optimized test suites pertaining to variable and uniform strength interaction. This method has not yet been explored by the IOR. There is a need for additional investigation on this method in order to reinforce the input-output based relations [10]. For this research, the nature-inspired strategy was used to produce a test suite in IOR as it allowed achieving optimum results. It has been known that this strategy yields encouraging results in terms of variable and uniform strength [10], [11]. A meta-heuristic algorithm named Firefly Algorithm (FA) has been employed in numerous applications as well as industries as it can address combinatorial optimization problems [12], [13]. Certain researchers who are involved in the field of software testing select the algorithm without change regarded to be efficient in producing test data pertaining to structural testing. FA yields competitive results versus Simulated Annealing and Genetic Algorithm with regards to an effective level, average coverage, and average convergence Components [14].
The IOR strategy has been introduced in this paper by combining it with the AFA algorithm, in order to achieve the optimum test suite size. A smaller test suite size is produced by IOR itself versus combinatorial testing. Also, the test suite size could be minimized by choosing the best don’t care values. AFA has been put forward to be combined with the IOR strategy because it could have chosen a test case with better weightage, from the start of the random firefly.
The research is organized in the following sequence: In the second part, the relationships based on inputs and outputs are elucidated comprehensively. The Firefly algorithm is explained in more detail in the third part. In part four, the recommended approach is outlined, and part five provides the summary.
Schroeder P.J. et al. put forward IOR [15]. To manage multiple outputs and input. It is not the same strategy when we compare it to a unified and variable strength. The main variation is we should consider a software tester as the relationship based on input and output of the values of the interaction parameters. It is also considered that the IOR application covers uniform and variable strength [16].
Generally, the tested system parameters are distinguished from one another. Indirectly, the associated input parameters possess various values. Tester assumption was used to apply variable or uniform strength interaction testing instead of actual interaction [17].
This could result in the exclusion of fundamental interactions as well as having irrelevant test cases. It is regarded that IOR can solve this issue. This kind of interaction takes into account just interaction pertaining to input parameter values that may influence the output. This happens since just some of the input interact amongst each other or there is a variation of strength pertaining to each interaction [18]. Even though a combination of every input is not needed in this strategy and possesses a smaller number of combinatorial test, there is an enhancement in the ability to identify any error while also reducing the redundancy of the test suite [18], [19] There are currently several IOR-supporting t-way approaches that use pure computational e.g. Greedy, Union, and Integrated t-Way test Data Generator (ITTDG), Test Vector Generator, Aura, ReqOrder and Para Order. Each strategy possesses its own weakness and strength. With regards to the two experiments carried out by [9], [10] it could be said that the ultimate optimum test suite size is produced by ITTDG and Density while the least favorable result is yielded by Union. A research study in [10], [15] discovered that IOR can decrease the size of the test suite by almost fifty percent. There is a decrease in size since the testing is executed according to program1 output. There is less interaction required to be run versus full combinatorial testing. The other key reason is due to only one interaction that could encompass many matching values pertaining to input parameters.
For a detailed explanation for the IOR strategy, Program 1 has been employed as a simple. The program1 has been demonstrated in Figure 1. It includes four inputs, A, B, C, and D. Three outputs are yielded by the program: V, W, and X [15]. The output of the function pertaining to V includes inputs A and C, while function output pertaining to W is usually an interaction amongst inputs B, C, and D. The function output pertaining to X covers a combination of input A and D. The general IOR program could be expressed as:
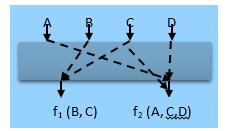 Figure 1: IOR for program 1
CA IOR test suite symbole is expressed in Equation (1), which is taken from [3].
![]() In the equation,
In the equation,
- TS = test suite,
- MCA = mixed covering array,
- N = the final test suite size,
- t = the interaction strength,
- v = the value of parameters,
- r = number of parameters,
- n = the nth parameter or value.
In this case, if we know the input-output relationships (for example through experimentation), then a generation of input-output-based relations t-way test suite could be done accordingly. To demonstrate, let us consider (f1 and f2) which are system outputs that conform to the following relationships.
- f (1) is a function of the output of parameters, B and C, that is, f1 =f (B, C).
- f (2) is a function of the output of parameters A, C, and D, that is, f2=f (A, C. D).
Table 1: Input Parameter Values for Program 1
| Parameters of Input | A | B | C | D |
| Values | a1 | b1 | c1 | d1 |
| a2 | b2 | c2 | d2 |
Figure 2 (i.e. the shaded input parameter-value) shows the tuples (i.e. parameter-value interaction elements) generated by these two input-output relations. The un-shaded parameters could be regarded as don’t care in which any valid value could be employed.
To form a comprehensive input-output-based relation test suite, all tuples need to be tested at least once. One such approach would be to convert all tuples into a test case by allocating any valid value to all who don’t care. An input-output-based relation test suite can be defined as a collection of all form test cases (i.e. without duplication of any test case) as presented in Figure 2.
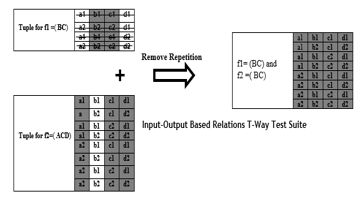 Figure 2: IOR interaction test cases for program 1
Figure 2 shows the IOR interaction derived from the proposal of the College Consultation System program1. The interactions provide only Function output f (1) until f (2). Only function outputs-based interactions are handled while different not linked input interactions or parameters are ignored. Just 8 test cases are needed to be performed out of 16 test cases.
To produce test cases according to on IOR strategy; generation of combinatorial test cases pertaining to the outputs F1 and F2 of the program is done independently. After this, all two sets pertaining to the test cases are compounded, while eliminating redundant test cases. At the end; only thirteen cases are produced for Program 1, as shown in Fig. 3. It denotes a decrease of forty-five percent.
Based on the last test cases generated, it was observed that certain parameters are don’t care values. They can be defined as any value that has been randomly selected. If we select the don’t care value appropriately; the number of test cases could be decreased. The best test suite size could be produced by carefully choosing the don’t care value. In this paper work, they don’t care values were wisely chosen by integrating the AFA algorithm into the approach.
2. Mathematical of Fireflies Algorithm (FA)
In [20], the author developed FA which is an optimization-based algorithm, and was based on the Firefly characteristics. There are more than 2000 Firefly species in the world, which show a unique flashing configuration. The Firefly flashing was based on a bioluminescence technique. The Firefly flashes light for attracting a mating partner, warning of the predators, or as a form of communication. As the fireflies are unisexual, any fly gets attracted to light. Furthermore, distance and light intensity are inversely proportional, which indicates that the light absorption decreases with the distance increase between the fireflies. Thus, the real function is optimized for determining the Firefly light intensity. These functions were combined for deriving a novel solution. FA is regulated using 3 parameters, i.e., randomization absorption coefficient, c; attractiveness, b; and parameter, a; as described in Figure. 1 [14–17]. FA has been recently developed as a swarm intelligence technique, which was developed in 2008 by Yang. This was a nature-inspired, stochastic, meta-heuristic algorithm, which could be used for solving some difficult optimization problems (or NP-hard problems). As it is a stochastic algorithm, it uses a type of randomization process which searches for a solution set. This algorithm was based on the flashing lights of the fireflies. A heuristic is defined as `to find’ or `to derive solutions by trial and error’. Thus, there was no assurance that an optimal solution could be derived within a reasonable time period. Also, meta-heuristic indicates a ‘higher level’, wherein the search process applied in the algorithms was based on the trade-off between the local search and randomization. In a FA process, the `lower level’ (heuristic) was based on the development of novel solutions in a specific search space and selects the optimal solution for survival. Furthermore, randomization helps the search process avoid all solutions that were trapped in the local optima. This local search also improves the candidate solutions till better improvements were noted. The FA was developed in 2007 by Yang and was a result of the light flashing pattern and attitude of the fireflies. Thus, FA was based on the 3 rules below:
As the fireflies are unisexual, any fly gets attracted to the light, irrespective of its sex.
There is a direct proportional between the attractiveness of a Firefly and the light intensity, which decreases with an increasing distance. Hence, for any flashing fireflies, the one with a lesser light intensity moves in the direction of the brighter Firefly. If there is no brighter Firefly compared to the Firefly, it moves randomly. Firefly flashing brightness is influenced by the nature of the actual function [21], [22].
For an exaggerating problem, the brightness can be directly proportional to the objective function value. As a firefly’s attractiveness is directly proportional to the intensity seen light by neighboring fireflies; the variation of attractiveness β can be now be defined with the distance r by [23]
![]() Where; was the attractiveness at r = 0; whereas the attractiveness, which simulated the movement of a Firefly (i), in the direction of a brighter Firefly (j), is defined as:
Where; was the attractiveness at r = 0; whereas the attractiveness, which simulated the movement of a Firefly (i), in the direction of a brighter Firefly (j), is defined as:
![]() The part is because of attraction, while the part was a randomization term, wherein αt was a randomization factor, and ϵit was a vector of some arbitrary numbers derived from the Gaussian distribution or the regular distribution at the time, t. If = 0, it is considered a simple random move. Otherwise, if γ = 0, it decreases to a different of particle swarm optimization [24]. The secondary phase of the proposed technique includes to the Adaption with Elitism (AE) as can be seen in Figure 3, which is also employed as a development algorithm[8]. The preferred result obtained by using the FA to assessed the population is accepted to the AE algorithm to give a neighbor solution. If the new solution is better than the existing one, it is approved. If the new solution is not as good as the previous one, the possibility rule is proved, and the new solution is approved if it showed the possibility rule as in Equation 3. Then, the superior solution is gone the FA to give a new population according to the best candidate. During this procedure, the search for the best solution is continuous.
The part is because of attraction, while the part was a randomization term, wherein αt was a randomization factor, and ϵit was a vector of some arbitrary numbers derived from the Gaussian distribution or the regular distribution at the time, t. If = 0, it is considered a simple random move. Otherwise, if γ = 0, it decreases to a different of particle swarm optimization [24]. The secondary phase of the proposed technique includes to the Adaption with Elitism (AE) as can be seen in Figure 3, which is also employed as a development algorithm[8]. The preferred result obtained by using the FA to assessed the population is accepted to the AE algorithm to give a neighbor solution. If the new solution is better than the existing one, it is approved. If the new solution is not as good as the previous one, the possibility rule is proved, and the new solution is approved if it showed the possibility rule as in Equation 3. Then, the superior solution is gone the FA to give a new population according to the best candidate. During this procedure, the search for the best solution is continuous.
For minimizing the test cases and improving the results, the researchers implemented the FA with the test suite generator.
A random list of some test cases is generated, called the fireflies. Thereafter, all test cases are evaluated for deriving the weightage. Another condition is present wherein the generated test case is added according to all combination pairs coverage in the combination list. It was seen that if a test case covered one combination pair from every combination list, it was believed to include a maximum coverage (i.e., weightage). Thereafter, it is added to the final test suite. On the other hand, if it did not include the maximum coverage, it is added to the memory of the fireflies, wherein their memory (population) is filled with the candidate fireflies (i.e., test cases). These test cases undergo an improvisation process, for deriving a better value of the intensity, which indicates the test case weightage. It was seen that if these improvised selected test cases showed a better weightage value, the primary test case is replaced by the improvised test case. Furthermore, when this process reached a maximal generation, the test case showing the maximal weightage amongst the fireflies was added to the test suite.
3. The Proposal Approach
For archiving, the performance Input-Output Based on Relations using adaptive firefly algorithm this paper is proposed adaptive firefly to minimum test cast.
3.1. Implementation of Test Case Generation
For minimizing the test cases and improving the results, the researchers implemented the FA with the test suite generator.
A random list of some test cases is generated, called the fireflies. Thereafter, all test cases are evaluated for deriving the weightage. Another condition is present wherein the generated test case is added according to all combination pairs coverage in the combination list. It was seen that if a test case covered one combination pair from every combination list, it was believed to include a maximum coverage (i.e., weightage). Thereafter, it is added to the final test suite. On the other hand, if it did not include the maximum coverage, it is added to the memory of the fireflies, wherein their memory (population) is filled with the candidate fireflies (i.e., test cases). These test cases undergo an improvisation process, for deriving a better value of the intensity, which indicates the test case weightage. It was seen that if these improvised selected test cases showed a better weightage value, the primary test case is replaced by the improvised test case. Furthermore, when this process reached a maximal generation, the test case showing the maximal weightage amongst the fireflies was added to the test suite.
The test of the T-way interaction deals with optimal test suite size as well as takes a lesser time to produce the test suite. Investigators have made efforts to deal with the problem by concentrating on either of these [19]. This study concentrates on the IOR strategy to get an ideal test suite size. As stated previously, although IOR could yield lesser sized test cases, this study involves the most optimal test suite size. A lesser test suite size signifies minimal time and costs to apply the testing activity.
3.2. Adapt Firefly Algorithm Process
In this research study, we have used the AFA algorithm due to its ability to choose the best test case with better weightage from the start of the tour. However, there are certain changes required to outfit this subject. In such a case, the input/output based relations become the subject matter, while the algorithm is adjusted to variable strength interaction. This is due to the fact that IOR includes a range of strengths. The algorithm can be employed even if the strength is alike for each function output. The key priority here is that IOR needs to support the limitations. The interaction amongst the values pertaining to the input parameters also has an impact on the program output. Thus, the put forward strategy overlooks the unrelated values.
For the IOR strategy, Section II needs to be revisited. The strategy only stresses on the interactions amongst input that generate the function output. All of the interaction input, as well as its function output, is categorized under SUT’s requirements and not merely as the assumption of the tester. Processing of the produced function outputs is done to acquire interaction test cases by accounting for the IOR strategy.
A flow chart that represents how the AFA technique is employed in the scheme, is displayed in Figure 3. The IOR interaction test cases list is required to be produced. This list includes the test cases which are uncovered. It functions as the input for the AFA module. The AFA module begins with the initialization of the pheromone trail.
A constant value for the pheromone and a heuristic value is set. After that, every ant begins formulating solutions by exploiting or exploring the edges of every factor. The edges represent every parameter’s value. The ant revises its local pheromone corresponding to the selected edge. This procedure goes on until all the fireflies finish the shifting of the parameters. Here, a fitness function is employed to search for the most optimal test. Only the most optimal test case which has a better weightage
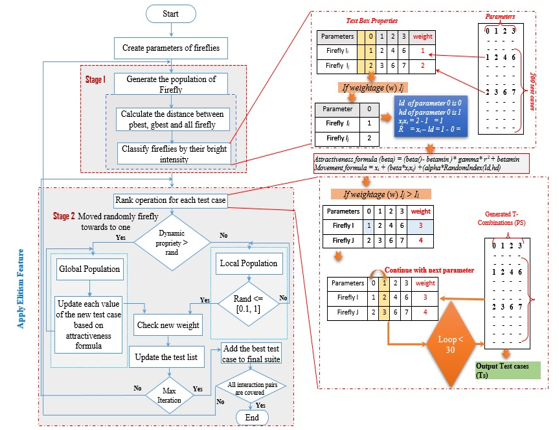 Figure 3: Input-Output Based on Relations using adaptive firefly algorithm
than others can update the value of the global pheromone. The most optimal test is put in the final test set and is discarded from the uncovered IOR interactions list. These activities are continued until the entire set is finished.
Some concerns to be regarded in the implementation of the IOR scheme combined with AFA are Combinatorial interaction – that the interaction of the input factor values of SUT is set. The one who is testing must take into account each of the function outputs as well as their corresponding input parameter value interaction.
Heuristic value – this heuristic value is needed to help in searching for a good quality solution in the metaheuristic technique and can become accustomed to any situation of the optimization.
In the AFA technique, a constant value of the pheromone and the heuristic value is computed during Pheromone Trail Initialization. In this recommended scheme, a heuristic is crucial to ensure that the ants start their exploitation or exploration with consistent information instead of random preliminary values which can possibly end up causing a bad edge selection. The value may perhaps help in decreasing the duration of time required in producing the test cases.
The heuristic value represents the number of interactions from one node (i) to the next node (j) over the interactions summation involved by node i. The formula for the heuristic value given in [11] can be applied with an adjustment to be appropriate for the IOR scheme. The formula is:
![]() IORi.j (t) is a summation of IOR interactions between parameters i and j. G is the set of parameters and its edges.
IORi.j (t) is a summation of IOR interactions between parameters i and j. G is the set of parameters and its edges.
Fitness function – it represents the amount of interactions which are covered by the current and not by the previous test.
In the case of the IOR scheme, the highest fitness function is the amount of the programmer outputs of the SUT. The formula that follows is employed to compute the amount of the fitness functions, f(t):
![]() Where (WP) represents the IOR interactions that are remain uncovered by the previous test but gets covered by the test .
Where (WP) represents the IOR interactions that are remain uncovered by the previous test but gets covered by the test .
AFA summary is represented by the shaded box in Figure 3: The technique adds the most optimum test case into the last test set, and after that, the covered interaction components are discarded from the list of the interactions. Further, the interaction components are examined. Once each of the interaction components is covered (that is, the list of the interactions is empty), the end of the iteration; otherwise, there is a repetition of the search procedure. The firefly procedure for the t-way examination is explained in more detail as follows:
- Every test case is one firefly; every test case contains a list of the uncovered tuples (light intensity).
- Compute the weight in every test case (list of uncovered tuples) using the value of the interaction components.
- Apply the Firefly scheme randomly at the in-depth test set, beginning with an arbitrary position to compute the fitness function (value). If the existing firefly value is higher, then the preceding firefly does not move and keeps its current position (value), and moves with the other fireflies.
- Generate the population of firefly: A random list of some test cases is generated, called the fireflies.
- Move firefly to brighter one: These test cases undergo an improvisation process, for deriving a better value of the intensity, which indicates the test case weightage. It was seen that if these improvised selected test cases showed a better weightage value, the primary test case is replaced by the improvised test case.
- Calculate the attractiveness and distance for each firefly: if a test case covered one combination pair from every combination list, it was believed to include a maximum coverage (i.e., weightage).
- To improvisation-based dynamic elitism.
- Adaptive elitism with dynamic property selection based on the local population and global population to obtain the best values for every test cases.
- If the dynamic property is greater than the random it will get the global population and check for the length of FA by iteration for the new Wight (gbest). It will put the best test cases inside the memory else it will get the local population.
- Carry out the operation of elitism for enhancing the local and universal population by using the steps given below:
- If the random is less than or equal to the probability [0,1] to find several elite flies.
- Then it will do iteration for maximum to check the new weight. As it gets the best weight for (test cases).
- Added the memory for the final test suit until stop the iteration. In the proposed self-adaptive Firefly with elitism test list generation strategy, the poor solutions will be replaced by the new solutions based on local population or global population dynamically.
The integration of the FA technique with an Elitism technique is done to achieve a balance between exploitation and exploration to make sure that there is an effective convergence as well as an ideal solution.
It is used as a development technique as well because of the best outcome by using FA after the optimum solution is calculated. They adopted the Elitism to create a nearby solution, and in case the new solution is improved in comparison to the existing solution, then it is agreed.
4. Benchmarking and Discussion
Two experiments published in [10],[25] are conducted to evaluate the performance of AFA in IOR. The capability of the size of the T-way IOR generation optimal test set inspires the experts to investigate further in this field. Several schemes that are in support of IOR are proposed in the literature, as cited in the “related work” part of section 2. In this part, we standardize the results with nine other schemes, i.e. Union [7], Greedy [10], the Generator of Test Vector, ITTDG (Integrated T-Way Test Data Generator) [13], Para Order and, ReqOrder [18], AURA [26], Density [14], TVG (Test Vector Generator) [27], CTJ (Jaya algorithm) [25].
Nonetheless, these approaches use the computational search method, and the metaheuristic search method was not used. This study implements AFA on the sizes of the IOR test set. Moreover, two experiments published in [10] are conducted to evaluate the performance of AFA in IOR.
Furthermore, the input-output relationship (R) in the tests begins with the first 10 requested interactions, and then the subsequent 10 interactions are added every time until there are 100 interactions.
where R= [{1, 2, 7, 8}, {0, 1, 2, 9}, {4, 5, 7, 8}, {0, 1, 3, 9}, {0, 3, 8}, {6, 7, 8}, {4, 9}, {1, 3, 4}, {0, 2, 6, 7}, {4, 6}, {2, 3, 4, 8}, {2, 3, 5}, {5, 6}, {0, 6, 8}, {8, 9}, {0, 5}, {1, 3, 5, 9}, {1, 6, 7, 9}, {0, 4}, {0, 2, 3}, {1, 3, 6, 9}, {2, 4, 7, 8}, {0, 2, 6, 9}, {0, 1, 7, 8}, {0, 3, 7, 9}, {3, 4, 7, 8}, {1, 5, 7, 9}, {1, 3, 6, 8}, {1, 2, 5}, {3, 4, 5, 7}, {0, 2, 7, 9}, {1, 2, 3}, {1, 2, 6}, {2, 5, 9}, {3, 6, 7}, {1, 2, 4, 7}, {2, 5,8}, {0, 1, 6, 7}, {3, 5, 8}, {0, 1, 2, 8}, {2, 3, 9}, {1, 5, 8}, {1, 3, 5, 7}, {0, 1, 2, 7}, {2, 4, 5, 7}, {1, 4, 5}, {0, 1, 7, 9}, {0, 1, 3, 6}, {1, 4, 8}, {3, 5, 7, 9}, {0, 6, 7, 9}, {2, 6, 7, 9}, {2, 6, 8}, {2, 3, 6}, {1, 3, 7, 9}, {2, 3, 7}, {0, 2, 7, 8}, {0,1, 6, 9}, {1, 3, 7, 8}, {0, 1, 3, 7}, {1,4}, {0,9,3}, {3,7,9}, {0,6,8,4}, {3,5}, {1,2,8,9}, {0,6}, {0,3,7}, {2,4}, {7,8,9}, {3,7,6}, {3,8,9}, {2,5,6,9}, {4,7,9}, {5,8}, {4,6,7,9}), {6, 9}, {6,7}, {3,4,7}, {4,8}, {0,9}, {0,2,6}, {1,4,8,9}, {7,8}, {5,8,9}, {3,6,7,9}, {4,8,9}, {2,4,6,9}, {4,8,9}, {3,5,9}, {0,4,9}, {0,6,8,9}, {4,5,8}, {2,5}, {3,5,6,8}, {2,4,7}, {4,5,6,7}, {5,7,9}, {3,5,8,9}, {2,9})].
The results of test size are listed in tables 2 and 3. The proposed AFA Results are compared with the results of previous IOR based strategies. It is worth to mention that the previous studies are implemented with R values from 10 to 60 except the ITTG which is executed up to 100. In this work, the AFA is implemented from R = 10 to 100. The shaded cells refer to the minimum values of the test suite size of the different strategies and configurations.
Comparison between the test suite size results of the proposed AFA and previous strategies at different IOR (N, , R).
As it is shown in Table 2, the AFA performed better than the other methods in obtaining the optimal solutions. The AFA obtained optimal solution in the nine strategies instance: Density, Tvg, Reqoreder Union Greedy, ITTDG, Aura, CTJ in addition to obtaining over 95% accuracy in the remaining instance.
Comparison between the test suite size results of the proposed AFA and previous strategies at different IOR (N, , R).
Table 2: Comparison of Size Generated by Different Strategies for IOR (N, , Rel)
| Computational | Metaheuristic | |||||||||
| R | Density | TVG | Req Order | Para Order | Union | Greedy | ITTDG | AURA | CTJ | AFA |
| 10 | 86 | 86 | 153 | 105 | 503 | 104 | 81 | 89 | 88 | 83 |
| 20 | 95 | 105 | 148 | 103 | 858 | 110 | 94 | 99 | 100 | 90 |
| 30 | 116 | 125 | 151 | 117 | 1599 | 122 | 114 | 132 | 118 | 106 |
| 40 | 126 | 135 | 160 | 120 | 2057 | 134 | 122 | 139 | 128 | 114 |
| 50 | 135 | 139 | 169 | 148 | 2635 | 138 | 131 | 147 | 134 | 122 |
| 60 | 144 | 150 | 176 | 142 | 3257 | 143 | 141 | 158 | 145 | 131 |
| 70 | NA | NA | NA | NA | NA | NA | 139 | NA | NA | 133 |
| 80 | NA | NA | NA | NA | NA | NA | 140 | NA | NA | 137 |
| 90 | NA | NA | NA | NA | NA | NA | 110 | NA | NA | 83 |
| 100 | NA | NA | NA | NA | NA | NA | 101 | NA | NA | 90 |
Table 3: Comparison of Size Generated by Different Strategies for IOR (N, 23334351, Rel).
| Computational | Metaheuristic | ||||||||||
|
R |
Density |
TVG |
Req Order |
Para Order |
Union |
Greedy |
ITTDG |
AURA |
CTJ |
AFA |
|
| 10 | 144 | 144 | 154 | 144 | 505 | 137 | 144 | 144 | 144 | 144 | |
| 20 | 160 | 161 | 187 | 161 | 929 | 158 | 160 | 182 | 165 | 160 | |
| 30 | 165 | 179 | 207 | 179 | 1861 | 181 | 169 | 200 | 170 | 160 | |
| 40 | 165 | 181 | 203 | 183 | 2244 | 183 | 173 | 207 | 173 | 161 | |
| 50 | 182 | 194 | 251 | 200 | 2820 | 198 | 183 | 222 | 191 | 180 | |
| 60 | 197 | 209 | 250 | 204 | 3587 | 207 | 199 | 230 | 209 | 187 | |
| 70 | NA | NA | NA | NA | NA | NA | 190 | NA | NA | 187 | |
| 80 | NA | NA | NA | NA | NA | NA | 249 | NA | NA | 242 | |
| 90 | NA | NA | NA | NA | NA | NA | 268 | NA | NA | 264 | |
| 100 | NA | NA | NA | NA | NA | NA | 260 | NA | NA | 254 | |
The proposed AFA method gives the most optimal size of the test set among all schemes with the exception of R=10, for which the optimum size of the test set is given by ITTDG. In this case, nonetheless, AFA still provides the second-best optimal size of the test set.
Table-2 displays that the worst working is of the Union scheme for all the cases.
In view of the outcomes given in Table 3, the recommended AFA scheme gives the best size of the test set among all the schemes excepting of R=10, where, out of 9, 6 schemes produce an equivalent optimum size of the test set. Apart from AFA, the other schemes are TVG, AURA, ParaOrder, ITTDG and Density. Moreover, the optimum size of the test set is generated by ITTDG, and AFA at R=20. The Union scheme, among all the schemes, has the worst working in all the cases, same as that given in Table 2.
5. T-way Result Statically Analysis
The statistical analysis is performed using the Friedman [28], and Wilcoxon [29] signed-rank test with Bonferroni-holm correction ( at 95% confident level (i,e, . In this section, the statistical analysis is divided into two subsections. The First sub sections consider the result of the t- way strength benchmarking while the second subsections consider the results of the mixed-strength benchmarking. The strategies with N/A and N/S results are considered incomplete and ignore samples as there is no available result for the specified test configuration.
The statistics for Friedman test and Post-hoc Wilcoxon signed-rank test is used between AFA and each strategy and it is presented in Tables 4-5, through 2 and tables 6-7 through 3 with the confidence of 95% level (i.e. α =0.05). As the tables show the Post-hoc Wilcoxon Rank-Sum Tests give negative ranks (i.e. a number of cases that AFA unable to outperform another strategy), and positive ranks (i.e. number of cases that AFA is better than another strategy), along with ties. The column is labeled Asymp. Sig. (2-tailed) shows p-value probability: if p-value less than 0.005, as recommended in [30]. For the statistical significance, all the AFA (Size) results are based on 10 executions. The test is performed using an SPSS software tool.
Table 4: Friedman Test for Table 2
| Friedman | Conclusion |
| Degree of freedom = 9, 0.05
Friedman statistic (p-vale) = 0.000 Chi-square vale ( ) = 45.255 |
0.00 <0.05 ( i.e p-value < ).
Therefore, reject and proceed to the post-hoc test.
|
Table 5: Wilcoxon Ranks Tets of Table 2
| Categories | Pair comparison | Ranks | ||||
| Negative Ranks | Positive Ranks | Total | Asymp. Sig.(2-tailed) | Conclusion | ||
|
Meta-heuristic-based strategies
|
Density -AFA | 0 | 6 | 6 | 0.027 | Reject the mull hypothesis |
| TVG – AFA | 0 | 6 | 6 | 0.027 | Reject the mull hypothesis | |
| Req Order – AFA | 0 | 6 | 6 | 0.027 | Reject the mull hypothesis | |
| Para Order – AFA | 0 | 6 | 6 | 0.027 | Reject the mull hypothesis | |
| Union – AFA | 0 | 6 | 6 | 0.028 | Reject the mull hypothesis | |
| Greedy – AFA | 0 | 6 | 6 | 0.027 | Reject the mull hypothesis | |
| ITTDG – AFA | 1 | 5 | 6 | 0.046 | Reject the mull hypothesis | |
| AURA- AFA | 0 | 6 | 6 | 0.027 | Reject the mull hypothesis | |
| CTJ – AFA | 0 | 5 | 6 | 0.042 | Reject the mull hypothesis | |
(courtesy: IBM SPSS version 26)
Table 6: Friedman Test for Table 3
| Friedman | Conclusion |
| Degree of freedom = 9 , 0.05
Friedman statistic (p-vale) = 0.000 Chi-square vale ( ) = 50.074 |
0.000 <0.05 ( i.e p-value < ).
Thus, reject and proceed to the post-hoc test.
|
Table 7: Wilcoxon Signed-Rank (post-hoc) Tets for Table3
| Categories | Pair comparison | Ranks | Asymp. Sig.(2-tailed) | Conclusion | |||
| Negative Ranks | Positive Ranks | Total | Mean Rank | ||||
| Meta-heuristic-based strategies
|
Density -AFA | 0 | 5 | 7 | 3.00 | 0.043 | Reject the mull hypothesis |
| TVG – AFA | 0 | 6 | 7 | 3.50 | 0.028 | Reject the mull hypothesis | |
| ReqOrder – AFA | 0 | 7 | 7 | 4.00 | 0.018 | Reject the mull hypothesis | |
| ParaOrder – AFA | 0 | 6 | 7 | 3.50 | 0.027 | Reject the mull hypothesis | |
| Union – AFA | 0 | 7 | 7 | 4.00 | 0.018 | Reject the mull hypothesis | |
| Greedy – AFA | 2 | 5 | 7 | 5.00 | 0.063 | Reject the mull hypothesis | |
| ITTDG – AFA | 1 | 4 | 7 | 3.50 | 0.078 | Reject the mull hypothesis | |
| AURA – AFA | 0 | 6 | 7 | 3.50 | 0.028 | Reject the mull hypothesis | |
| CTJ – AFA | 0 | 6 | 7 | 3.50 | 0.027 | Reject the mull hypothesis | |
6. Conclusion
The Input-Output Relation strategy is an excellent strategy for interaction testing. It is due to the fact that it is capable of dealing with the original input as well as programmer output causing the reduction in the size of the test set because of ignoring any interaction with the separate parameters of the input value. Thus, the recommended AFA is used to optimize IOR strategy to obtain an optimum size of the test set. Few elements are required to be examined so that they can match with the IOR and AFA schemes. The components are heuristic value, the number of a firefly, combinatorial interactions, and fitness functions. The strategy is assessed and compared with other strategies for optimization. Moreover, the statistical examination shows 49% statistical importance according to the compression of the pier of Wilcoxon signed-rank (as shown in Tables 5-7). Thus, this research summary that AFA is a helpful strategy for producing a t-way test set. The results demonstrated that the AFA scheme is an improvement over the traditional algorithm (FA) and other similar algorithms due to the enhancement of the diversity of its population by the elitism operatives. In the view of AFA’s promising performance, it is proposed that other limitations of FA, like the weak examinations in high-dimensional.
Acknowledgment
The author would like to acknowledge the support from the Fundamental Research Grant Scheme (FRGS) under a grant number of FRGS/1/2018/ICT01/UNIMAP/02/1 from the Ministry of Education Malaysia.
- R. N. Kacker, D. R. Kuhn, Y. Lei, and J. F. Lawrence, “Combinatorial testing for software: An adaptation of design of experiments,” Measurement, 46(9) 3745–3752, 2013, doi.org/10.1016/j.measurement.2013.02.021.
- R. C. Bryce, Y. Lei, D. R. Kuhn, and R. Kacker, “Combinatorial testing,” in Handbook of Research on Software Engineering and Productivity Technologies: Implications of Globalization, IGI Global, 2010, 196–208, doi: 10.4018/978-1-60566-731-7.ch014.
- R. R. Othman and K. Z. Zamli, “T-Way Strategies and Its Applications for Combinatorial Testing,” Int. J. New Comput. Archit. their Appl., 1(2) 459–473, 2011, doi: 10.1109/PRDC.2007.55.
- R. Kuhn, Y. Lei, and R. Kacker, “Practical combinatorial testing: Beyond pairwise,” It Prof., 10(3) 19–23, 2008, doi: 10.1109/MITP.2008.54.
- N. Ramli, R. R. Othman, Z. I. A. Khalib, and M. Jusoh, “A Review on Recent T-way Combinatorial Testing Strategy,” in 2017 MATEC Web of Conferences, 2017, doi.org/10.1051/matecconf/201714001016
- A. A. Al-Sewari and K. Z. Zamli, “An orchestrated survey on t-way test case generation strategies based on optimization algorithms,” in 2014 The 8th International Conference on Robotic, Vision, Signal Processing & Power Applications, 2014, 255–263, doi.org/10.1007/978-981-4585-42-2_30.
- C. A. Floudas et al., “Handbook of test problems in local and global optimization. 1999.” Kluwer Academic Publishers, Dordrecht.
- A. S. M. Ali, R. R. Othman, Y. M. Yacob, “APPLICATION OF ADAPTIVE ELITISM OPERATOR IN FIREFLY ALGORITHM FOR OPTIMIZATION OF LOCAL,” 99(3), 569–582, 2021.
- O. H. Yeh and K. Z. Zamli, “Development of a non-deterministic input-output based relationship test data set minimization strategy,” in 2011 IEEE Symposium on Computers & Informatics, 2011, 800–805, doi:10.1109/ISCI.2011.5959020.
- A. A. Alsewari, N. M. Tairan, and K. Z. Zamli, “Survey on Input Output Relation based Combination Test Data Generation Strategies,” ARPN J. Eng. Appl. Sci., 10(18) 8427–8430, 2015.
- A. A. Alsewari, L. M. Xuan, and K. Z. Zamli, “Firefly Combinatorial Testing Strategy,” in Science and Information Conference, 2018, 936–944.
- K. Z. Alsewari, AbdulRahman A. Xuan, Lin Mee Zamli, “Firefly Combinatorial Testing Strategy,” in Intelligent Computing, 2019.
- A. S. M. Ali, R. R. Othman, Y. M. Yacob, and J. M. Alkanaani, “ParametersTuning of Adaptive Firefly Algorithm based Strategy for t-way Testing.” International Journal of Innovative Technology and Exploring Engineering, 9, 4185–4191, doi: 10.35940/ijitee.A6111.119119.
- A. Pandey and S. Banerjee, “Test Suite Optimization Using Chaotic Firefly Algorithm in Software Testing,” Int. J. Appl. Metaheuristic Comput., 8(4) 41–57, 2017, doi: 10.4018/978-1-7998-3016-0.ch032.
- P. J. Schroeder and B. Korel, Black-box test reduction using input-output analysis, 25(5, 173–177, 2000, doi:org/10.1145/347636.349042.
- N. Ramli, R. R. Othman, and M. S. A. R. Ali, “Optimizing combinatorial input-output based relations testing using Ant Colony algorithm,” in 2016 3rd International Conference on Electronic Design (ICED), 2016, 586–590, doi: 10.1109/ICED.2016.7804713.
- A. B. Nasser and K. Z. Zamli, “A new variable strength T-way strategy based on the cuckoo search algorithm,” in Intelligent and Interactive Computing, Springer, 193–203, 2019, doi: 10.1109/ICED.2016.7804713.
- W. Ziyuan, N. Changhai, and X. Baowen, “Generating combinatorial test suite for interaction relationship,” in 2007 Fourth international workshop on Software quality assurance: in conjunction with the 6th ESEC/FSE joint meeting, 2007, 55–61, doi.org/10.1145/1295074.1295085.
- P. J. Schroeder, P. Faherty, and B. Korel, “Generating expected results for automated black-box testing,” in 2002 Proceedings 17th IEEE International Conference on Automated Software Engineering, 2002, 139–148, 2002, doi:10.1109/ASE.2002.1115005.
- X.-S. Yang, “Othman & Zamli,” Nature-inspired metaheuristic algorithms, 20, 79–90, 2008.
- A. H. Gandomi, X. Yang, S. Talatahari, and A. H. Alavi, “Commun Nonlinear Sci Numer Simulat Firefly algorithm with chaos,” Commun. Nonlinear Sci. Numer. Simul., 18(1) 89–98, 2013, doi:org/10.1016/j.cnsns.2012.06.009
- X. Yang, “Firefly Algorithm , L ´ evy Flights and Global Optimization arXiv?: 1003 . 1464v1 [ math . OC ] 7 Mar 2010,” 1–10, 2010.
- X.-S. Yang, Nature-Inspried Metaheuristic Algorithms, Second Edition.(July 2010.
- X. Yang, “Firefly Algorithm?: Recent Advances and Applications,” 1(1), 36–50, doi:org/10.1504/IJSI.2013.055801.
- M. I. Younis, A. R. A. Alsewari, N. Y. Khang, and K. Z. Zamli, “CTJ: Input-Output Based Relation Combinatorial Testing Strategy Using Jaya Algorithm,” Baghdad Sci. J., 17(3), 1002-1009, 2020, doi: org/10.21123/bsj.2020.17.3(Suppl.).1002.
- H. Y. Ong and K. Z. Zamli, “Development of interaction test suite generation strategy with input-output mapping supports,” Sci. Res. Essays, 6(16) 3418–3430, 2011, doi: 10.5897/SRE11.427.
- S. Esfandyari and V. Rafe, “GALP: a hybrid artificial intelligence algorithm for generating covering array,” Soft Comput., 25(11) 7673–7689, 2021, doi.org/10.1007/s00500-021-05788-0.
- L. Statistics, “Wilcoxon Signed Rank Test in SPSS Statistics-Procedure, Output and Interpretation of Output Using a Relevant Example.” 2017.
- D. C. Montgomery and G. C. Runger, Applied statistics and probability for engineers. John Wiley and Sons, 2014.
- D. C. Montgomery and G. C. Runger, Applied statistics and probability for engineers. John Wiley and Sons, 2014.