Combustion Flame Temperature Considering Fuel and Air Species and Optimization Process

Adv. Sci. Technol. Eng. Syst. J. 6(4), 252–258 (2021);
 DOI: 10.25046/aj060429
Estimation of optimal Air or oxygen is important for the combustion process to be efficient and produce more energy. This is to be based on each component of the fuel and the air, considering their respective pressure and density. At first, this research investigates the role of , , present in combination with , and the air on the flame temperature; using simulation with Cantera 2.4. Results have been compared and calibrated with field data from KivuWatt company. It then demonstrates the way to achieve optimum Air Fuel Ratio (AFR) for the various species of the fuel. The results estimated the flame temperature by means of the percentages of all species of the fuel and the air, as well as various conditions of pressure and temperature. Finally, it combines all to show different values of optimum AFR at various species percentages; and uses a python program to create an AFR calculator available online through the link provided.
1. Introduction
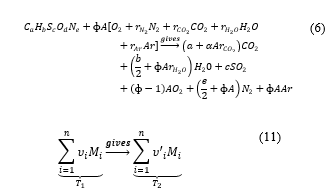
The combustion within the boiler burns fuel to create heat energy. The burning of fuel is the reaction of fuel with oxygen present in the air. The amount of fuel that can be burnt is limited by the oxygen present [1]. When all the fuel is not burnt, a part of it stays in the boiler and the other quantity goes to the atmosphere. This is the loss that reduces efficiency, and tends to pollute our environment [2]. Most of the fuels used in the boiler are hydrocarbons which release hydrogen and carbon as residuals, along with heat and pressure when burnt [3].
The quantity of these residuals and their temperatures impact the performance of the plant including the [4]. The quantity of the exhaust depends both on the composition of the fuel, the composition of the air, and the effectiveness of the combustion [5]. In general, the global reaction of combustion is like
Let us see the combustion by taking into account the residuals within the fuel and the air.
1.1. Consideration of fuel and its impurities of the field and application
The general fuel formula is given by its composition of carbon, hydrogen, sulfur, oxygen, and nitrogen. So it is [6]
Combustion equation is
![]() From this composition, the mass of the fuel can be computed as
From this composition, the mass of the fuel can be computed as
![]() To achieve effective combustion, each element needs a determined quantity of oxygen as follows [7]:
To achieve effective combustion, each element needs a determined quantity of oxygen as follows [7]:
- moles of are required to change to
- moles of are required to change to
- moles of are required to change to
- The quantity of oxygen present in the fuel is subtracted from the quantity of oxygen required for complete combustion. That is, moles of oxygen are subtracted.
- Nitrogen is present in the fuel however it doesn’t undergo the combustion process (except at very high temperatures when some of it is converted to nitrogen oxides); hence it is not considered.
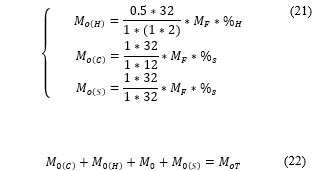
Therefore, the stoichiometric value of oxygen ( ) is
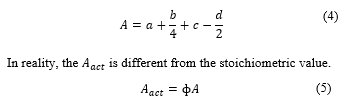 Now let’s consider air instead, If all elements of the air are involved in the combustion process equation (2) becomes,
1.2. Combustion with all species of the air
Let us define all the proportion ( ) of each element compared with oxygen as , stands for any element. This gives , .
1.3. Brief on Cantera models
Cantera 2.4 is an open-source simulation software embedded in Matlab and Python used to solving dynamic chemical reactions [8]. In this paper the researchers used Python.
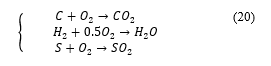
In the current work, the authors assume that all metallic impurities are omitted from the fuel. So, as to use Cantera simulation-based model summarized in equations (7), (8) and (9), taking methane as case. At stoichiometry, the equation is as follows:
![]() At rich combustion (when oxygen is lower), there is the formation of carbon monoxide as follows
At rich combustion (when oxygen is lower), there is the formation of carbon monoxide as follows
 At lean combustion (when oxygen is higher), there is formation of oxygen in the product as follows.
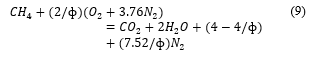 For both equations (8) and (9) above, if , they give (7). These models are connected with the AFR by:
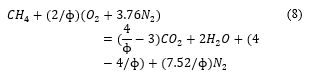
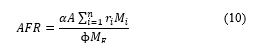 where . At stoichiometry . Equation (10) shows that the equivalence ratio is higher when the air lessens, oppositely for the air fuel ratio, and there is an impact of the other species of the fuel and the air on the value of the . The study has been done using the equivalence value instead of the . By definition, the equivalence ratio is the ratio of actual fuel/ai ( ) to the stoichiometric fuel/air [9]. The stoichiometric value occurs only when all elements and respective quantities are considered in computation [10].
Cantera uses those combustion principles and conservation of enthalpy in the combustion equation at constant pressure [11] to find the value of the final temperature. That is, the enthalpy of the reactant is equal to the enthalpy of the product. Writing the described global combustion equation in the way that allows quantifying masses the reactant is at the temperature and the product at .
 Now the conservation principle gives
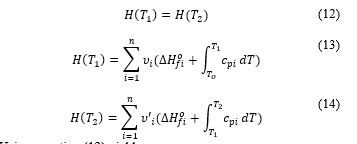 Using equation (12) yields
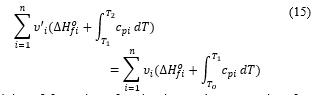 Enthalpies of formation of molecular products are taken from thermodynamic table present in [12], so is the only unknown of equation (15). With Cantera, computation to deduce the value of is performed for all (16), and (8) cases, at different values of .
The enthalpy is calculated by [13], [14]
![]() [15] generated by NASA at standard pressure; which indicates that to have higher flame is important in view of yielding more energy.
[15] generated by NASA at standard pressure; which indicates that to have higher flame is important in view of yielding more energy.
1.4. Algorithm for optimum AFR
The current section shows the algorithm for realizing optimum AFR based on the results from chapters 3 and 4 taking into account the fact that each species present in the fuel is to undergo complete combustion by a specified quantity of air.
The composition of the species in a hydrocarbon is provided in Table 1 considering most present composition species [16], [17]
Table 1: Species composition
| Species | Composition range( ) [18] |
| C | : [48, 68] |
| H | : [25, 47] |
| S | : [0, 8] |
| O | :[8, 18] |
![]() For complete combustion, the stoichiometric value ( ) is computed following (11) by
For complete combustion, the stoichiometric value ( ) is computed following (11) by
[19].
![]() The value of the mass of oxygen to make combustion of each species will be
The value of the mass of oxygen to make combustion of each species will be
![]() is the percentage of species . In practice, the carbon present in the fuel is the source of carbon dioxide; hydrogen is the source of water, sulphur the source of sulphur dioxide [20].
is the percentage of species . In practice, the carbon present in the fuel is the source of carbon dioxide; hydrogen is the source of water, sulphur the source of sulphur dioxide [20].
 Using (18) and (19) gives the total mass of oxygen required to burn each element
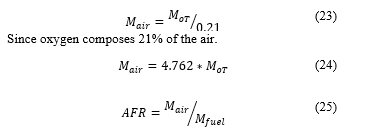
 Because oxygen is 21% of the air, the mass of air ( ) is computed by (23).
 The algorithm of the air-fuel ratio and mass of the air is simply represented by Figure 1
This work deals with the estimation of the flame temperature at different compositions of the fuel and the air for various values of the air-fuel ratio and equivalence ratio. It also presents the method of reaching the optimum value of the air-fuel ratio and the mass of the air, taking into account initial pressure and temperature.
It has four sections: Section 1 is the introduction; section 2 for methodology, section 3 presents the result and its interpretation and finally concludes in section 4.
2. Methodology and process
Referring to models described above, numerical simulation is done with Cantera codes present in python following the equations (7) to (9) and (15) then the results are compared with KivuWatt field data. KivuWatt: Is a thermal power plant built in Rwanda/Karongi district. This is part of Contour Global plc, is producing 26 MW since 2010, and is using Methane gas from lake Kivu [21] [22].
The value of the nitrogen/air ratio, carbon/air ratio, Nitrogen/fuel ratio, and Oxygen/fuel ratio is varied from zero to one at specified constants equivalence ratio under standard temperature and pressure. The value of the enthalpy is estimated by using formula (16), where the final/flame temperature used is of result from the simulation. The value of the enthalpy of formation used is [23], and the heat capacity is at 300K [24].
The algorithm is based on the results of recent publications, explaining the role of the pressure, temperature, and density on the AFR has been demonstrated. Putting this together with results from Cantera simulation gives the procedure summarized by Figure 1 to come up with calculation and online calculator.
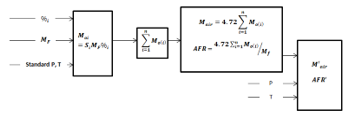 Figure 1: Summary of optimum AFR process
The variation concerning the density has been analyzed from the results of pressure and temperature using the state equation since the is for pressure and temperature are very high [25].
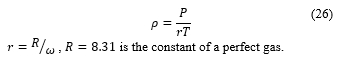 , is the constant of a perfect gas.
3. Results and Discussion
3.1. Simulation and its comparison with field data
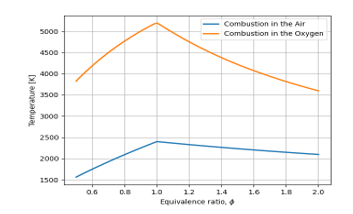 Figure 2: Comparison of Flame temperature for Oxygen and Air
Figure 2 indicates that combustion is much more efficient when it is done with oxygen.
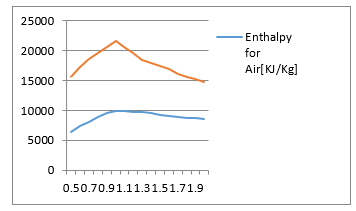 Figure 3: Comparison of Combustion enthalpies for oxygen and air
Figure 3 estimates the value of the enthalpy, computed by using the result of Figure 2 for both cases of combustion in oxygen and air at different values of the equivalence ratio.
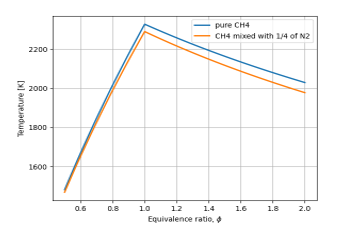 Figure 4: Role of the presence of nitrogen in the fuel
Figure 4 quantifies the resulting flame temperature in a case where a quarter of the fuel is nitrogen. It is visible that the temperature is lowered when the fuel contains nitrogen as an impurity.
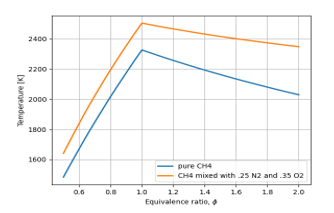 Figure 5: Role of oxygen and nitrogen in the fuel
Figure 5 shows how much flame temperature is affected by the presence of oxygen and nitrogen in the fuel. They lower the temperature and comparing with Figure 4, oxygen itself does not negative effect.
 Figure 6: Influence of portion of nitrogen
Figure 6 is the results from the analysis of field data. It shows that as nitrogen in the fuel goes up, the flame temperature comes down. Maximum flame temperature is achieved for a case where there is no nitrogen ( ).
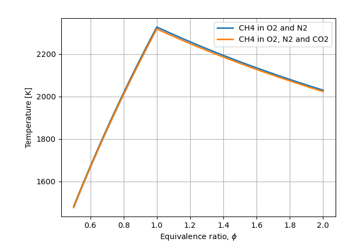 Figure 7: Role of the presence of carbon dioxide
Figure 7 analyses the impact of carbon dioxide present in the air. This shows that carbon dioxide has a very small negative impact on the flame temperature.
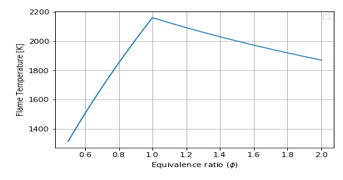 Figure 8: Equivalence Ratio vs Flame Temperature for Air-Fuel combustion, T in:
Figure 8 indicates the values of flame temperature when is very small ( ). The comparison with Figure 2 (graph in blue), shows that inlet temperature is to be increased to have more flame temperature.
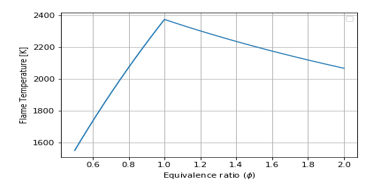 Figure 9: Equivalence Ratio vs Flame Temperature for Air-Fuel combustion, :
Comparison of Figure 2 (graph in blue), Figure 8, and Figure 9 show the increase of from 100K to 293K then to 400K, but the flame temperature has increased from 2150K to 2400K, then to 2350K, respectively, at tells that inlet temperature would be improved, but when it becomes higher the flame temperature becomes very low.
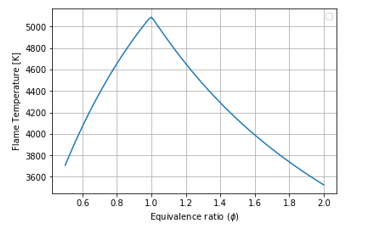 Figure 10: Equivalence Ratio vs Flame Temperature for O2 and CO2-Fuel combustion, Tin: 300K
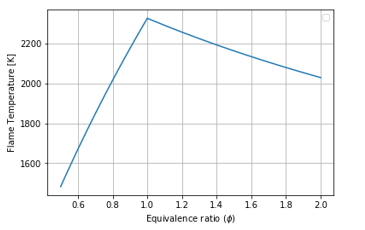 Figure 11: Equivalence Ratio vs Flame Temperature for O2 and N2-Fuel combustion, Tin: 300K
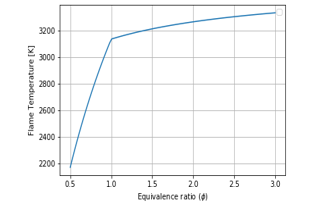 Figure 12: the flame temperature for O2 present in the fuel
Comparison of Figure 10 with Figure 10 emphasizes what has previously been demonstrated in Figure 7 at a bit increase of inlet temperature from ambient (293K) to 300K.
In Figure 12, the flame temperature is higher when . So, it informs that when there is oxygen in the fuel, the air would be reduced, thus the AFR is to be smaller than the stoichiometric value.
 Figure 13: Calibration of flame temperature [0C]
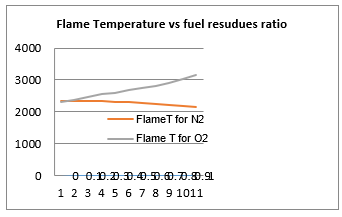 Figure 14: Flame Temperature vs fuel residues
Figure 14, resulting from the analysis of field data, emphasizes the results in Figure 12. It indicates that the presence of oxygen in the fuel is positive but nitrogen is negative.
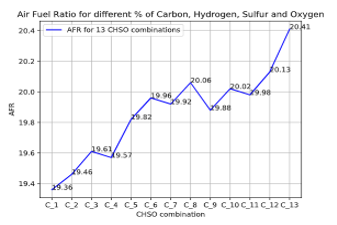 Figure 15: AFR for different species percentages at standard condition of pressure and temperature
3.2. Algorithm results
For different combinations of the fuel species percentages at the standard condition of pressure and temperature, specific values of the AFR are plotted in Figure 15. It shows that changes in species percentages (from to ) correspond to different values of AFR at constant pressure, temperature, and density (standard condition).
Various values of AFR for different values of pressure, temperature and density are for fixed species percentages of the fuel plotted in Figure 16.
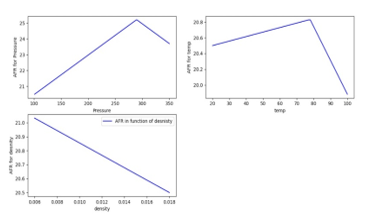 Figure 16: Variation of AFR with Pressure [KPa], Temperature [ ] and Density [kg/m^3]
Variation of both species’ percentages and pressure-temperature states are considered in the program to get specific values. The method to compute the AFR producing optimum flame temperature is built following the algorithm and accessible online through the link;
4. Conclusion
This research quantified the flame temperature at specific values of the fuel and air species. Analysis also showcases that it is feasible to employ a measured quantity of air for combustion efficiency. Again, it contains the method to calculate and model-based calculator to compute the AFR and mass of the air to be used for optimum power output and reduce exhausts. Practical feasibility requires a method to measure percentages of all chemical species within the fuel and the air, and the controller of the boiler combustion process, this will be the next research. A built calculator is hosted online for accessibility. The study has shown that presence of oxygen in the fuel is positive in this case the air is to be reduced proportionally. The combustion within the oxygen has a more remarkable positive impact than in the air. It is better to separate oxygen from the air before combustion which is not easy. Preheating the fuel is also an advantage, however, this should be done only up to a point where a good viscosity and density are reached, since uncontrolled preheating reduces the output temperature and requires some time and cost.
- R. Pradhan, P. Ramkumar, and M. Sreenivasan, “Air-Fuel Ratio ( Afr ) Calculations In An Internal Combustion Engine Based On The Cylinder Pressure Measurements,” Int. J. Eng. Res. Apllication, 2(6), 1378–1385, 2012.
- B. Abbas Al-Himyari, A. Yasin, and H. Gitano, “Review of Air-Fuel Ratio Prediction and Control Methods,” Asian J. Appl. Sci., 2(4), 471–478, 2014, [Online]. Available: www.ajouronline.com.
- A. Marjanovi, “Control of Thermal Power Plant Combustion Distribution Using Extremum Seeking,” in IEEE Transactions on Control Systems Technology, 2017, 25(5), 1670–1682.
- T. K. Ibrahim, M. M. Rahman, and A. N. Abdalla, “Optimum gas turbine configuration for improving the performance of combined cycle power plant,” Procedia Eng., 15(September 2015), 4216–4223, 2011, doi: 10.1016/j.proeng.2011.08.791.
- N. Stuban and A. Torok, “Utilization of exhaust gas thermal energy – theoretical investigation,” June 2010, 2014, doi: 10.1109/ISSE.2010.5547301.
- K. O. Povarov, “Distribution of impurities and gases between steam and water phases of the geothermal fluid in the low pressure zone,” Sci. Train. Res. Cent. Geotherm. Energy, 14(5), 1–12, 1996.
- J. Colannino, “Introduction to Combustion Analysis,” Model. Combust. Syst., 2(13), 101–189, 2006, doi: 10.1201/9781420005035.ch2.
- A. Felden, “Cantera Tutorials – A series of tutorials to get started with the python interface of cantera.,” Cerfacs(November 2015, [Online]. Available: https://www.cerfacs.fr/cantera/docs/tutorials/CANTERA_HandsOn.pdf.
- R. T. Vedula, R. Song, T. Stuecken, G. G. Zhu, and H. Schock, “Thermal efficiency of a dual-mode turbulent jet ignition engine under lean and near-stoichiometric operation,” Int. J. Engine Res., 18(10), 1055–1066, 2017, doi: 10.1177/1468087417699979.
- P. K. R. B. W. K. G. Wise, “Exploring Engineering,” Elsevier, 5(3), 1–656, 2020.
- S. Londerville, J. Colannino, and C. E. Baukal, “Combustion fundamentals,” John Zink Hamworthy Combust. Handbook, Second Ed. 1 – Fundam.), 79–124, 2012, doi: 10.1201/b11619.
- M. J. Simpson, Two Studies in Gas-Phase Ion Spectroscopy, 53(9. Springer Verlag Berlin Heidelberg, 2013.
- B. Mcbride, S. Gordon, and M. Reno, “Coefficients for Calculating Thermodynamic and Transport Properties of Individual Species,” Nasa Tech. Memo., 4513(NASA-TM-4513, 98, 1993, [Online]. Available: http://ntrs.nasa.gov/archive/nasa/casi.ntrs.nasa.gov/19940013151_1994013151.pdf.
- B. Franzelli, E. Riber, M. Sanjosé, and T. Poinsot, “A two-step chemical scheme for kerosene-air premixed flames,” Combust. Flame, 157(7), 1364–1373, 2010, doi: 10.1016/j.combustflame.2010.03.014.
- H. Pitsch, “Thermodynamics , Flame Temperature and Equilibrium,” 2018. https://cefrc.princeton.edu/sites/cefrc/files/2018_pitsch_lecture2.pdf (accessed Apr. 30, 2021).
- M. Bajus, “Sulfur Compounds in Hydrocarbon Pyrolysis,” Sulfur reports, 9(1), 25–66, 1989, doi: 10.1080/01961778908047982.
- D. Wu, W. Pisula, M. C. Haberecht, X. Feng, and K. Müllen, “Oxygen- and sulfur-containing positively charged polycyclic aromatic hydrocarbons,” Org. Lett., 11(24), 5686–5689, 2009, doi: 10.1021/ol902366y.
- A. M. Dadile, O. A. Sotannde, B. D. Zira, M. Garba, and I. Yakubu, “Evaluation of Elemental and Chemical Compositions of Some Fuelwood Species for Energy Value,” Int. J. For. Res., 2020(6), 1–8, 2020, doi: 10.1155/2020/3457396.
- D. V. Thierry Poinsot, “Theoretical and Numerical Combustion, Second Edition,” Decis. Support Syst., 38(4), 557–573, 2005.
- W. H. Green, “Combustion Chemistry,” Princeton-CEFRC Summer Sch. Combust.(June, 1–110, 2014.
- E. Plant, “KivuWatt Project,” Power Technology, 2021. https://www.power-technology.com/projects/kivuwatt-project-lake-kivu-kibuye/ (accessed Feb. 14, 2021).
- S. Nagarajan et al., “PROJECT?: KIVUWATT POWER PLANT,” Kigali, 2006.
- B. Atakan, “Compression – Expansion Processes for Chemical Energy Storage?: Thermodynamic Optimization for,” Energies, 5(11), 1–21, 2019, [Online]. Available: http://dx.doi.org/10.3390/en12173332.
- P. J. Linstrom and W. G. Mallard, “Gas Phase Thermochemistry Data,” NIST Chemistry WebBook, NIST Standard Reference Database Number 69, 2010. http://webbook.nist.gov (accessed Apr. 25, 2021).
- G. De Montricher and J. M. Stuchly, “Equation of state,” PSIG Annu. Meet. PSIG 1985, 5(4), 1–17, 1985, doi: 10.1201/9781351034227-3.
No related articles were found.