Real Time RSSI Compensation for Precise Distance Calculation using Sensor Fusion for Smart Wearables

Adv. Sci. Technol. Eng. Syst. J. 6(4), 327–333 (2021);
 DOI: 10.25046/aj060436
To effectively implement the social distancing or digital contact tracing in epidemic using an RSSI-based localization approach through Bluetooth beacon is one of the most widely used technologies, but simply using RSSI measurement is not more relevant because the RF signal is affected by several factors and the environment of usage. Traditional distance or positioning algorithms have large-ranging errors when applied for moving objects because they do not account for the device orientation and use fixed path loss models. Hence, the distance between the nodes cannot be obtained accurately by RSSI measurement in a dynamic environment. In this paper, we propose a solution to compensate for the RSSI loss in real-time by filtering out the noise and then accounting for the antenna orientation using a Beacon Packet. Antenna Orientation is determined using 9DoF (9 Degrees of freedom ) IMU (Inertial Measurement Unit). The nodes simultaneously advertise their presence and scan for the presence of other similar beacons in their range. These nodes also deploy Low Power techniques during periods of inactivity to conserve battery power. Advertising is performed on three Bluetooth channels and no connection or response packet is required between the devices during advertising and scanning activities (ADV_NONCONN_IND). The addition of the Motion Sensor could also be used to optimize the battery life of the device.
1. Introduction
This paper is an extension of work originally presented in ICCCS Patna 2020 [1]. Smart Contact tracing with social distancing is one of the efficient ways to avoid the spread of contagious pandemics, such as COVID-19 and future pandemics. In such cases, it is an advantage to alert people to maintain a safe distance. Additionally, it is advantageous to record their physical contact wherever they are at work, in public places, or at a relative’s home, etc. RSSI (Received Signal Strength Indicator) based distance calculation between two BLE (Bluetooth® Low Energy) based movable devices (nodes) are widely used technologies. However, RSSI measurements give lower accuracy due to variable attenuation (path loss) and fading effects with high variance [2]. Another factor that affects the RSSI is the antenna orientation and thus can affect the calculated distance between two transceivers. In an ideal scenario, the RSSI of the received signal does not very much. However, in a practical scenario the RSSI is affected by different factors: e.g., physical distance, reflections of objects, environmental parameters, movement of objects or change in the environment, antenna position and polarization etc.
In this paper, we describe the algorithm and later experimentally verified how effectively distance calculation can be done by real-time compensation of the RSSI loss using nested mathematical filters and by accounting for the relative antenna orientation between transmitter and receiver for digital contact tracing or social distancing related applications.
The solution developed is based on ST BlueNRG-2 SoC (Bluetooth Low Energy (BLE) system-on-chip), LSM6DSO and LIS2MDL (9DoF IMU Motion Sensor) for estimating device orientation. The assumption is being taken that orientation of the device is the orientation of antenna embedded in device from a fixed plane. Bluetooth® Low Energy technology is used due to several advantages like wide deployments in wearables and Low-Power consumption. etc. It can communicate with a smartphone which can configure device parameters from the app. This solution will also help to avoid huge dependency on smartphone(s) even for pausing/ resuming the logging of the beacon.
Antenna radiation pattern changes in a different orientation and this impact the RSSI of the signal, impacting parameters like distance based on RSSI. In most of the known solutions or papers, orientation of antenna in RF devices are static, and relative antenna direction is not accounted.
2. Design Architecture
The concept has been proven using a system solution using the STEVAL-BCN002V1B development kit based on BlueNRG-2 SoC [3] [4]. This development kit hosts multiple sensor which includes gyroscope, magnetometer, accelerometer, Time-of-Flight, humidity, pressure, and microphone sensors. It can be powered by a common CR2032 coin cell. The development kit communicates with a Bluetooth® Low Energy enabled smartphone running the ST BLE Sensor app [5], available on iTunes and Google Play and stores. Following are major components in STEVAL-BCN002V1 as shown in Figure 1:
- BlueNRG-2: Programmable Bluetooth® LE 5.2 Wireless SoC
- LSM6DSO: 3D gyroscope and 3D accelerometer [6]
- LIS2MDL: high-performance, ultra-low power, 3-axis digital magnetic sensor [7]
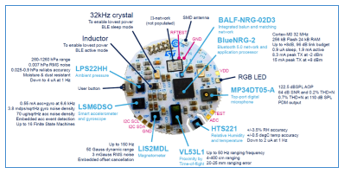 Figure 1: STEVAL-BCN002V1 known as BlueNRG-Tile
The MEMS sensor section of the STEVAL-BCN002V1 sensor node includes inertial and environmental MEMS sensors connected with the BlueNRG-2 via an I2C bus operating at 400 kHz. All sensors can generate interrupts, but only the interrupts from the LIS2MDL magnetometer and the LSM6DSO accelerometer and gyroscope are connected with the BlueNRG-2 through dedicated and independent lines.
BlueNRG-2 integrates a Bluetooth Low Energy radio (BLE), an ARM® Cortex®-M0 core, 24 kB of static RAM memory, 256 kB of Flash memory, SPI (max 1 MHz in slave and 8 MHz in master mode), two I2Cs (standard 100 kHz or fast 400 kHz), UART interfaces; two multi-function timers (MFT), a DMA controller, RTC and watchdog, and an ADC with PDM stream processor.
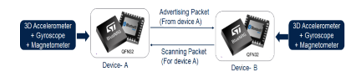 Figure 2: Sequential Advertising and Scanning by Transceiver
Once the BLE stack is initialized in STEVAL-BCN002V1 node, it will advertise non-connectable undirected beacon (ADV_NONCONN_IND) packets and sequentially scans packets from neighbor wearables as shown in Figure 2. RSSI approximation for the relative distance between two or more BLE devices/Nodes can be improved using sensor fusion of Accelerometer, Gyroscope and Magnetometer. The solution is useful in several applications especially in social distancing or digital contact tracing applications.
The impact of the RSSI variation by rotating antenna on same plane can be compensated by sending the Euler angle (Roll, Pitch, Yaw) of antenna obtained from sensor fusion through advertising packet as shown in Figure 3. In the proposed solution, only Yaw axis data (direction of the antenna) is broadcasted.
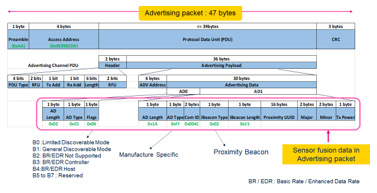 Figure 3: Advertising packet format with sensor fusion data
It is important to know that the radiation pattern is not only a function of the antenna itself, but it depends also on the overall system including PCB layout, ground plane size, space and mechanical surroundings. The Radiation pattern of the antenna as shown in Figure 4 is taken as a reference to observe the change in RSSI with different Euler angle, which is taken on X and Y plane keeping Z axis constant with reference to IMU.
The solution will overcome the drawback in which RSSI variations are huge even if the node is at same position but in a different direction or orientation. The radio frequency section of the STEVAL-BCN002V1 includes the following elements:
- BALF-NRG-02D3 ultra-miniature balun which integrates matching network and harmonics filter.
- A Pi-network which allows additional filtering and provides access points for testing. Note: This network is not populated, as the integrated balun provides the necessary matching.
- An SMD 2.4 GHz (ANT016008LCS2442MA1) antenna, which requires a certain clearance area on the PCB and specific passives for precise tuning.
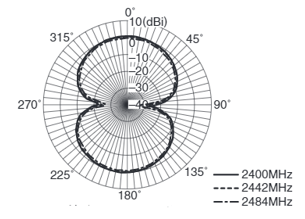 Figure 4: Antenna Radiation Pattern
3. Proximity Sensing and RSSI Compensation Algorithm using Sensor Fusion
Following paragraph explains in detail about the algorithm that is developed for calculating the proximity of two Bluetooth/RF Nodes using RSSI Measurement and compensating RSSI loss in real-time by embedding the dynamic node orientation in advertising packet. Node orientation will be calculated using 9DoF IMU Motion sensor
- Initially sensor fusion with 9 axis (3 axis each for accelerometer, gyroscope and magnetometer) is initialized, and sensor orientation is set, default orientation is ENU (East: X, North : Y, UP : Z)
- The output data rate for gyroscope and accelerometer should be equal to or greater than 100Hz, the magnetometer can be 40Hz
- Magnetometer and Gyroscope calibration is done as shown in Figure-5, Accelerometer calibration is not necessary for sensor fusion except for applications demanding very high orientation precision. Calibration image is captured from ST BLE Sensor App
 Figure 5: Node rotation pattern for Calibration
- Roll, Pitch and Yaw as shown in Figure 6 is obtained as an output of sensor fusion. Next, only the Compass angle on the Yaw axis (antenna direction from a fixed point) is calculated using sensor fusion and is embedded in the last 2 bytes of advertising packet to advertise it regularly. Measurement of compass angle depends on the Output data rate of sensors too
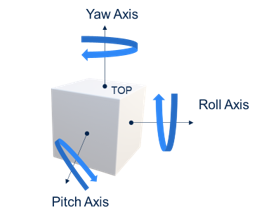 Figure 6: Roll, Pitch and Yaw axis
- Each BLE transceiver advertises and scans sequentially. Tuning the scan window, scan interval and advertising interval parameters can significantly impact battery life. The interval must be an integer multiple of 0.625ms (Time = N * 0.625ms) from 20ms to 10.24s. For ADV_NONCONN_IND (non-connectable undirected event), the minimum advertising interval can be 20ms. There is also a random delay generated by the Link Layer between 0 to 10ms in each advertising packet
An event is generated whenever any transceiver receives valid beacon data during passive scanning as shown in Figure 7. The Controller maintains the list of these advertising data and provides the relevant information in one Advertising Report event from multiple devices
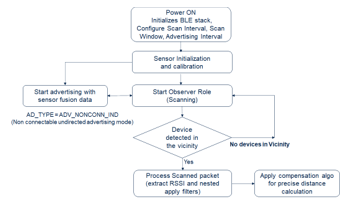 Figure 7: Flow chart of event generation during passive scanning
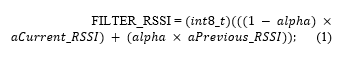
- RSSI strength is taken for the beacons received during scanning and nested filtering algorithm is implemented to filter out the variations. One of the filters applied in this application is Weighted Mean filter as in equation (1), where 0< αlpha <1. To determine the best, optimize constant (αlpha), several tests were performed with different constant values between 0 to 1. The results and known conditions were analyzed, and best optimized value was achieved between 0.6 to 0.7
- RSSI samples are filtered using nested filtering mechanism then transmit power and filter RSSI values are used to calculate distance [8] by using equation (2):
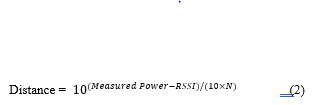 Measured Power: Factory-calibrated constant, it indicates average RSSI value at 1 meter
N: Environment dependent constant (or path loss exponent) which is in the range of 2 to 6
The path loss exponent indicates the rate at which the path loss increases with distance. Normally, N is defined between 2 to 6 as shown in Table 1 [9]
Table 1: Path loss exponent for different environments
| Environment | Path loss exponent (n) |
| Free space | 2 |
| Urban area cellular radio | 2.7 to 3.5 |
| Shadowed urban cellular radio | 3 to 5 |
| Inside a building – line-of-sight | 1.6 to 1.8 |
| Obstructed in building | 4 to 6 |
| Obstructed in factory | 2 to 3 |
- During the scanning, the transceiver extracts the yaw or compass angle of the neighbor transceiver and calculates the relative yaw angle
- Slope of RSSI vs Yaw angle is calculated as shown in Figure 12, assumed to be linear. Equation (3) for real-time compensation of RSSI is derived based on the slope and Relative Yaw angle
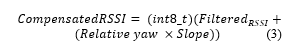 Based on Compensated RSSI value, Compensated distance which incorporates the error due to mismatch antenna orientation and is calculated as in equation (4)
 The Look-up table is maintained for 2m, 4m, 6m for yaw- angles ranging between 0 to 360 degrees as shown in Figure 8. The look-up table will be taken as a reference to calculate the Variation of RSSI for relative yaw angle from 0 to 90.
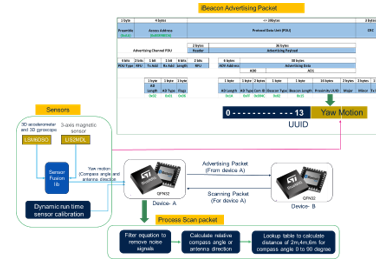 Figure 8: Flow chart of Proposed Solution
4. Adaptive Filtering of RSSI Values
Fluctuation in RSSI is influenced by environmental noise and values are varied with time due to multipath reflections [10]. Variations in RSSI on same distance can be optimized by applying nested filtering algorithms.
4.1. Weighted Mean Filter
Optimized constant value αlpha derived from experiments is multiplied with previous measured RSSI value and 1 – αlpha [11] to the current RSSI value received from same receiver or node. αlpha is for deciding the weightage between previous RSSI and current measurement, αlpha can be in between zero to one. Several tests were performed with different constant values and best results were obtained for αlpha between 0.6 to 0.7
![]() A: Current RSSI value
A: Current RSSI value
B: Previous RSSI value from same receiver
4.2. Moving Average and Feedback Filter
After applying Weighted Mean filter on RSSI, output values are updated with current values. Feedback is provided to the input and parallelly moving average methodology are applied on the number of samples saved in RAM (Random Access Memory of the SoC), which further filtered the noise. Nested filtering algorithm reduces the variations to a large extent.
5. Power Optimization using Sensor Fusion
Another advantage of using Motion Sensor in Digital Contact Tracing application is to optimize the power for longer battery life. The Wearable will go automatically into low power mode if there is no movement or activity sensed by the motion sensor for certain time. Whenever there is some activity sensed, for example, wearable is worn by a person again; Device will immediately switch from sleep mode to normal mode using the Wake-up event generated by the LSM6DSO sensor. As the wakeup interrupt line is connected with motion sensor interrupt line and the sensor generates an interrupt as soon as the device moves from it’s position. Action will be to stop the radio (scanning + advertisement) automatically when the devices are not being worn (for example at home) as shown in Figure 9. Similarly, the radio can be switched On if the devices are being worn.
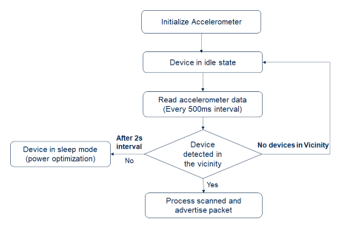 Figure 9: Device Power state in wake up or sleep mode
6. Test Analysis and Results
Various tests analysis performed on multi nodes in the network to observe RSSI variations due to antenna orientation [12]. In this paper, Sensor fusion impact is accounted to compensate RSSI and Distance between two nodes. Node-A is fixed at a center of the circle while Node-B is at 2m distance and rotated in approximately 2m radius as shown in Figure 10. STEVAL-BCN002V1 is taken as nodes shown in Figure 11. At each quarter movement, hundreds of filtered RSSI samples were measured to calculate the mean distance and error variance. With the change in direction of Node B, it is assumed that antenna direction also changes as the or an antenna is embedded in the Node. The Direction of Antenna is measured in Yaw angle also can be counted as Compass angle. Compass angle measurement is logged as shown in Figure 12.
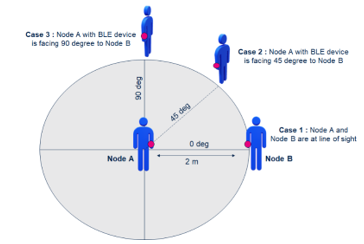 Figure 10: Node B direction with respect to fixed Node A
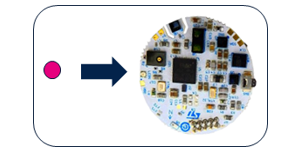 Figure 11: STEVAL-BCN002V1 as Node
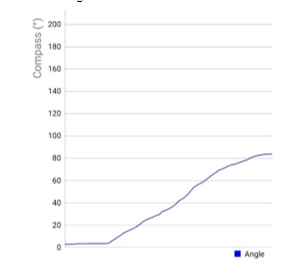 Figure 12: Compass Angle on Yaw axis is measured from 0 to 90 degree
Relative compass angle or Relative Yaw angle is the difference between the direction of two antennas in terms of angle. Even the nodes are at a fixed distance, RSSI strength is weakening as the orientation between two antennas are not aligned as shown in Figure 13.
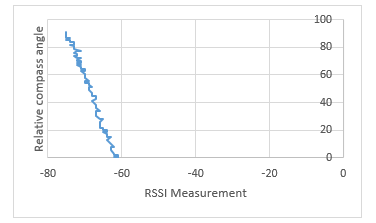 Figure 13: RSSI Measurement vs Relative compass angle on fixed position
Two experiment cases were defined to observe the impact on RSSI measurement and distance calculation, one before accounting Sensor Fusion in advertising packet and one after accounting it in packet. Total 100 samples were taken in each case.
6.1. RSSI Measurement on Node B before applying Compensation Algorithm
As shown in Figure 14 that before applying the compensation algorithm there is a huge impact in RSSI Measurement observed on Node B by just changing the relative antenna orientation or antenna direction between Node B and Node A, which further leads to calculating the wrong distance as per the path loss model, even if the actual distance between Node B and Node A is 1m. Similarly, Table 2 shows that as the Node B antenna direction is moving away from the line of sight of Node A, the calculated distance is increasing accordingly
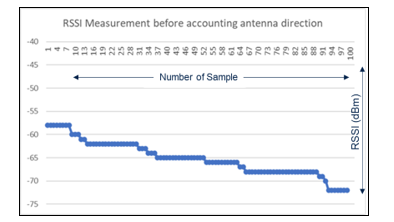 Figure 14: RSSI samples measurement without accounting relative antenna direction
6.2. RSSI Measurement on Node B after applying Compensation Algorithm
In this experiment, the Antenna direction in terms of compass angle is included in the advertising packet of Bluetooth® Low Energy node. Node-B extracts the antenna direction of Node-A to calculate the relative direction as shown in Figure 14, that after applying the compensation algorithm the impact in RSSI measurement observed on Node B by changing the relative antenna orientation or antenna direction between Node B and Node A is compensated, which further leads to calculating precise distance calculation as per the path loss model. Similarly, Table 3 shows that calculated distance based on RSSI after accounting the effect of Antenna direction is close to 1m only
Table 2: Distance based on RSSI without compensation
| Relative Yaw Angle
(B – A) in degree
|
RSSI (without compensation) Observed
|
Distance based on RSSI (in meter)
|
|
0 |
-58 |
1.10201845 |
|
20 |
-60 |
1.33253754 |
|
45 |
-62 |
1.41827941 |
|
90 |
-64 |
1.58188643 |
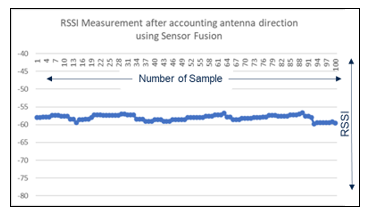 Figure 15: RSSI samples after accounting relative antenna direction
Table 3: Distance based on RSSI after compensation
|
Relative Yaw Angle (B – A) in degree |
Compensated RSSI (dBm) |
Compensated Distance (mm) |
|
0 |
-58 |
1.10018454 |
|
20 |
-58 |
1.12301845 |
|
45 |
-57.2 |
1.07151930 |
|
90 |
-56 |
1.21618600 |
7. Current Consumption in Proposed Solution
The current consumption of the BlueNRG-2 can be accurately predicted under different conditions using the BlueNRG consumption tool [13]. As mentioned in paper that BlueNRG-2 SoC (Bluetooth® Low Energy application processor), LSM6DSO and LIS2MDL (9DoF IMU Motion Sensor) are the main component used in STEVAL-BCN002V1 for the proving the concept. Hence active phase and inactive phase current consumption of BlueNRG-2, LSM6DSO (accelerometer and gyroscope), LIS2MDL (magnetometer) is shown in Table 4.
Table 4: Current Consumption
|
Device |
Active Phase |
Inactive phase
(power not gated by MCU) |
| BlueNRG-2 | 1.9 mA (Active mode) | 0.9 µA (Sleep mode) |
| LSM6DSO | 280 µA (50Hz) | 3 µA (power-down) |
| LIS2MDL | 475 µA (50Hz) | 1.5 µA (power-down) |
8. Conclusion
The use of Sensor Fusion for accounting Antenna Orientation in Real-time Location system is quite helpful to obtain the optimal design for digital contact tracing or social distancing related applications. Additionally, sensor fusion helps to optimize battery life by sensing the motion. If the node is stationary, it will direct the controller to disable all the radio activities and in the same way it will generate an event if any motion is sensed to wake up the device from sleep mode. The Antenna direction or orientation of one device is advertised using a Bluetooth beacon at regular intervals to other devices in the vicinity, so that the device while acting as a receiver can estimate the distance using RSSI by also accounting whether the device antenna is perfectly aligned or not. The Solution will be able to estimate the approximate RSSI for a specific position in a dynamic environment. The Solution will also help to avoid snooping of the beacon as the data which is being advertised is changing at regular intervals due to a change in antenna orientation.
Acknowledgment
We would like to thank STMicroelectronics for providing all the resources to accomplish this work.
- K.R. Tiwari, I. Singhal, A. Mittal, “Smart Social Distancing Solution Using Bluetooth® Low Energy,” in 2020 5th International Conference on Computing, Communication and Security (ICCCS), 1–5, 2020, doi:10.1109/ICCCS49678.2020.9277175.
- M. Barralet, X. Huang, D. Sharma, “Effects of antenna polarization on RSSI based location identification,” in 2009 11th International Conference on Advanced Communication Technology, 260–265, 2009.
- STMicroelectronics, “BlueNRG-2, Bluetooth® Low Energy wireless system-on-chip,” (December), 2020.
- STMicroelectronics, “How to use the BlueNRG-Tile Bluetooth LE enabled sensor node development kit,” (June), 1–44, 2020.
- STMicroelectronics, “STBLESensor Data brief BLE sensor application for Android and iOS,” (May), 2019.
- STMicroelectronics, “LSM6DSO Datasheet,” (January), 2019.
- STMicroelectronics, “LIS2MDIL Datasheet,” (November), 1–41, 2018.
- F. Awad, A. Omar, M. Naserllah, A. Abu-Hantash, A. Al-Taj, “Access point localization using autonomous mobile robot,” in 2017 IEEE Jordan Conference on Applied Electrical Engineering and Computing Technologies (AEECT), 1–5, 2017, doi:10.1109/AEECT.2017.8257754.
- Saverio Grutta, “Application Note?: Radio communication range estimation in ISM band,” (November), 1–47, 2020.
- M. Ayadi, A. Ben Zineb, “Body Shadowing and Furniture Effects for Accuracy Improvement of Indoor Wave Propagation Models,” IEEE Transactions on Wireless Communications, 13(11), 5999–6006, 2014, doi:10.1109/TWC.2014.2339275.
- N. Chithirala, B. Natasha, N. Rubini, A. Radhakrishnan, “Weighted Mean Filter for removal of high density Salt and Pepper noise,” in ICACCS 2016 – 3rd International Conference on Advanced Computing and Communication Systems: Bringing to the Table, Futuristic Technologies from Arround the Globe, 1–4, 2016, doi:10.1109/ICACCS.2016.7586326.
- A. Kishk, “Fundamentals of Antennas,” 2009.
- STMicroelectronics, “STSW-BNRG001 Data brief BlueNRG current consumption estimation tool STSW-BNRG001,” (December), 1–5, 2020.