Data Stream Summary in Big Data Context: Challenges and Opportunities

Adv. Sci. Technol. Eng. Syst. J. 6(4), 414–430 (2021);
 DOI: 10.25046/aj060447
With the advent of Big Data, we are witnessing a rapid and varied production of huge amounts of sequential data that can have multiple dimensions, we speak of data streams. The characteristics of these data streams make their processing and storage very difficult and at the same time reduce the possibilities of querying them a posteriori. Thus, it has become necessary to set up so-called summary structures, equivalent to views on the data streams which take into account these constraints and allow querying the data already pruned from the system. In order to take into account the aspect of volume, speed and variety of data streams, new methods have appeared in the field of Big Data and NoSQL. These solutions combined make it possible now to set up summaries that make it possible to store and process different types of data streams with more efficiency and representativeness and which best meet the constraints of memory and CPU resources necessary for processing data streams but also with some limits.
1. Introduction
In the development of the research in Databases, Statistics, Telecom- munication, etc, and especially with the advent of Big Data, new applications which product intensive data have arisen in various areas [1]–[5].
These data are no more modelizied in the same manner like in classical databases (relational databases), but on form of tran- sitory data streams. They have an ephemeral, continuous, veloce and mutidimentional caracter and their data are queried as soon as they arrived in the processing system by queries in continuous execution before to be discarded. If there is no well defined re- grouping mechanism in place on part of these streams and that allow future re-execution of queries, data will be forever lost. Indeed, the data streams characteristics not allow to plan their storage in their globality, and make their processing relatively dependant on CPU and memory resources. However, these data could hold required informations for analytics traitement later. That way, it becomes essential to know how to retain these informations or a part of them for a future exploitation.
In this context, many works [6]–[9] have been done to make avalaible structures or algorithms that allow to have views over data streams for posteriori queries execution over them. These structures are known under the denomination of data stream summaries [10].
Thus in the literature, we find two approaches of data stream sum- mary, generalist approach and specific approach. The generalist summary approaches of data streams allow to answer aproxima- tively in posteriori to any kind of queries over the data stream in an optimal manner and while respecting the storage and computation constraints required. Specific summary approaches are tailored to specific needs and oriented to more specific areas. In the front of these approaches, other works have been done combining the Big Data technologies with NoSQL databases [8], [9]. They have as goal to bring durable solutions to processing and storage constraints of data streams. Indeed, these technologies give largest capabili- ties of computation and storage and offer performances in terms of treatement that can be done over clusters of machines allowing thus to scale-up.
The need to be able to perform real-time analysis of the data available at all times is becoming more and more urgent in all areas. Thus, in order to make a contribution to the question, we have as objectives in this work (i) to make an in-depth state of the art of the techniques and Big Data tools put in place to summarize the data stream, (ii ) to study the advantages, disadvantages and use cases of these tools, (iii) to describe what are the different phases of the data stream processing and how these tools are used in these phases
(iv) and finally , to see what perspectives are opening up for a future contribution for example to see the possibility to do OLAP analysis over Big Data streams.
Thus, in this paper, while taking into account the opportunities offered by Big Data technologies, we abord in the section 2 the problematic of storage and computation of data streams. In the section 3, we present a state of art of the literature over the data streams summarization. This section treats generalist and specific approaches for data streams summaries. In the section 4, we study the use of the Big Data technologies to produce and treat summaries of data streams. And to finish, in the section 6, we dress the bilan and the future works relatives to this paper.
2. Problematic of data streams storage and processing
With the advent of intensive applications which produce huge vol- umes of data like fraud detection, roads traffic monitoring, the management of smart electricity meters, etc.[1]–[3], processing of data streams is often confronted to storage and computation constraints caused by the fact that they are generated in swift and continuous manner with variables velocities. The unlimited nature of data streams, produced in a rapid and continuous manner make that the Data Streams Management Systems (DSMS) do not have sufficient resources for their storage and processing. Indeed, the characters (rapid, continuous, infinite, etc.) of data streams do that, their storage in their totality is not conceivable. In the operation of a Data Stream Management System (DSMS), data are continuously treated on the fly relatively of a temporal windows defined in priori. After expiration of this windows, the data expire and are discarded from the system (lost). However, it can be very useful to submit posteriori queries on these data. Indeed, if new needs are declared that include a particular task that requires data already discarded from the system, then this task will not be realizable. For example, when a decision maker wants to know sales trends of the last day or the power produced the last two days an equipment of the distribu- tion system, within a temporal window of one hour, all of the data of these last periods would no longer exist in the system if it doesn’t exists any mechanism, like low cost storage technologies (but we have to take into account the cost that could rise over time), to retain these data. In that fact, one will not be able to satisfy these kinds of requests. By the fact that the data of streams are discarded from the system at the end of the window, some tasks that require data of the past (no covered by the window) will never be satisfied. This problem still remains when it comes to meeting needs combining both unloaded data and current data (from a valid window). Indeed, an aggregation query or a join query that contains so-called blocking operators like MIN, MAX, AVG, Order By, Group By, etc. (for ex- ample the maximum of sales or the sum of amounts of sales by city of the last 48 hours by considering a windows of an hour) require that all of required data to be available. Thus, it becomes impossible to give satisfaction to theses kinds of queries. To efficiently answer to these kind of needs, the ideal would be to dispose of an unlimited memory to permanently store data. However, we are limited by a bounded memory length. Thus, it becomes necessary to put in place mechanisms that allow to conserve a summary of expired data in order to provide approximate answers (acceptable) instead of the exact answers (which are impossible to obtain).
In this study, the method followed to respond to theses needs is defined by a series of questions:
What are the classic data stream summary techniques with their advantages and limitations ?
What are the new available architectures in the context of Big Data to summarize data streams with a comparative study of them ?
What tools or technologies can be used in the different layers of these architectures?
What are the advantages, disadvantages and use cases of these tools?
- What are the perspectives of contribution after this study?
3. Data streams summary
A data stream summary can be defined as a structure or an algorithm that allows to permanently store a portion of data of a stream [11], [12]. Data streams summaries have the advantage to allow process- ing of analytics queries posed in posteriori over the data streams. Multiple researches works [10], [11], [13]have been proposed in the scope of the data streams summaries and that can be grouped in two majors approaches: the generalist data streams summary approach [11], [14], [15] and the specific data streams summary approach [16]–[18].
3.1 generalist summaries of data streams
A generalist summary of data streams [10], [13] is a data structure updated as the events of a stream data arrive in the system. This type of summary allows to answer, in optimal way, in posteriori and approximatively to all kind of queries that can interest the final user and that address the stream’s data. It also allows to deal with the resources constraints (storage and computation power) subject to data streams. To be generalist, a summary of data streams must align with a certain number of points [13] :
to respect the constraints of espace-memory and computation power (1).
to exprime itself with variables belonging to cartesian product TXD where T is the timestamps’space and D is the set of qualitatives or quantitatives values (2).
to allow an approximation of all queries of type SELECT AND COUNT over the T xD space (3). to allow the calculation of the approximation error in function of CPU and memory resources available (4).
This structure must allow in the same time to calculate bounds of approximative answers’s precision of these queries. A generalist summary of data stream particularly looks for to control the lose of information between the data stream and the summary produced. Many works [11], [14], [15] have addressed the problematic of the generalist summaries of data streams.
The authors of [11] proposed a general description of a sum- mary that supports two operations update(tuple) and com- puteAnswer(). The update operation is called to update the summary’s structure at each arrival of a new event and the computeAnswer() function update or produce new results for answering the posed query.
During processing of the continuous queries, the optimal sce- nario is this where the two operations are running in a fast way compared with the arrival delay of events into the data stream. In that case, it is not necessary to provide special techniques to be in phase with the data stream (no blocking factor or bottleneck) and to produce approximative answers in real time : as new event arrives, it will be used to update the data structure and then new results are calculated by the way of this structure, all of this during a time period less important than the delay between arrivals of two successives events (i).
The algorithm proposed does not respect the constraint (3) because the one or the two operations are slows; it then be- comes impossible to continually produce an exact updated answer. The (1) constraint, in this side, is satisfied by the mean of technic describe in (i).
By the same method, we can see that constraints (2) and (4) are in turn verified by this proposition.
The authors of [14], in their side, proposed the StreamSamp algorithm based on the fundamental technic of random sam- pling of the entering data stream, followed by an intelligent storage of generated summaries that allow to analyze the data stream in ints entirety or in a part of it.
This process allows to this algorithm to no depend on the data stream events arrival rate. However, the efficiency of Stream- Samp deteriorates with time. Indeed, the weight of old events grows over time with a fixed sample size. Consequently, if the old events are putted together with others having a lower important weight, then they increase negatively the variance of the sample.
With this algorithm, the (1) constraint is assured but with a logarithmic growth of the size of the summary according to the stream size. Even if the data stream size is potentially infi- nite, the logarithmic growth is a good solution in the practice. The (2), (3) and (4) constraints are verified by the application of the poll theory [19] that allows to pose bounds to the ap- proximations’s quality with condition to take in consideration the events weight, these masses depend to order of the sample in wich they are keeped.
The authors of [15] proposed the CluStream algorithm that is divided in two phases, the On-line phase and the Offline phase. The On-line phase or micro-clustering phase is the portion of collection on line of statistics data. This processing do not depend of any user entry like the time window upper bound or the required granularity for the clusters construc- tion. The goal, here, is to maintain some statistics in a level of granularity (spatial and temporal) sufficiently high to be used by the second phase or macro-clustering phase with a specific time bound as good as an evolutive analyze. This phase is inspired by the k-means and the nearest neighbour algorithms. Thus, the on-line phase iteratively operates by always maintening a set of micro-clusters updated by integrat- ing the new events arrived in the system. These micro-clusters represent the snapshots of the clusters that change in each new occurring event of the stream.
The off-line phase begins by creating a certain number of initials micro-clusters at the start of the data stream. Thus, at the start of the data stream, a number InitNumber of events is stored over hard drive and a k-mean algorithm is then used to create the initials micro-clusters. The number InitNumber is chosen in order to be the larger possible authorized by the k-mean algorithm processing complexity by creating initial micro-clusters.
This proposition satisfies the (4) constraint because it allows to obtain approximative answers by using of Cluster Feature Vector (CFV). For the (2) constraint, it appears satisfied by the fact that in function of stream’s characteristics (the space dimension of values) and of the number of micro-clusters, the structure update time at new event arrival can be bounded
: this allows to reduce the needs in term of computation resources[13]. However, the CluStream algorithm does not match with the definition of a generalist summary of data stream over the (3) constraint because this algorithm doesn’t allow to know the bounds for approximation of answers of SELECT AND COUNT queries type and also eventually over the (1) constraint (for the required memory-espace)[13].
3.2 Specific summary approach of data streams
Generalists data streams summaries studied in 3.1 constitute an ideal. However, applications used in different domains can require a more specific type of summary : i.e. a data stream summary specialized in a well precise domain. Thus, in the literature we find different sum- mary techniques usable depending on needs. These mainly consiste of probabilistics techniques or data mining (sketchs, echantilloning, clustering, etc.) [16]–[24] where the summary has a probability to be selected (if these techniques are applied many times on the same dataset, the result (a summary) may vary) and the deterministics or statistics techniques [25]–[27](histograms, wavelets, etc.) which when applied on the same dataset will always give the same result (identical summaries).
- Probabilistics or data mining techniques
From the point of view of the results they produce, data mining tech- niques can be likened to summaries. Indeed, a lot of research has been carried out to extract sequential patterns, or frequent items-sets by using of sliding windows, etc., allowing to capture trends in data streams.Thus, we can note techniques such as sketches, clustering, sampling that we propose to study in this section.
The Sketches
In their seminal article, the [16] authors introduced the first time the randomized sketching notion, which is since then, widely used. These are small data structures and provide very compact data stream summaries by using few memory resources. This is a no- table point in data stream field which is characterized by the memory space constraint. The authors of [17] proposed the following for- malism of a sketch : a sketch S(A) is a compressed form of a given sequence A, providing the operations :
- INIT(S(A)) which defines how the sketch is initialized; UPDATE(S(A),e) which describes how to modify a sketch when a new event e arrives in the A sequence;
- UNION(S(A),S(B)) given two sketchs for two sequences A and B, provides the sketch of their union A ∪ B SIZE(S(A)) which estimates the distinct number of events of the sequence A.
Their use makes it possible to respond to queries over all of the data stream by providing approximative answers. The main idea of this technique is to randomly project each event in a particular space using hash function and keep only the most relevant components, thus saving space while preserving most of the information. There are different implementations of these sketchs notably [20], Count sketches [21], the Bloom’s filter [22], [23], Count-Min sketch (CM Sketch)[24], etc.
The sampling methods
The sampling techniques [18], [28]–[30] are also other probabilis- tics summary methods. The sampling over data streams is based on traditionals sampling techniques. Howerver, it requires significants innovations, like sequential sampling, to prevent the unbounded size of data streams because generally requiring all the data in order to select a representative sample. The sampling techniques can also be coupled with windowing techniques in order to prevent the data expiration phenomenon of the stream by allowing to consider an interval in which to define the sample. These windows can be of two types : sliding or landmark. Thus, certains of these mains methods have been adaptated to data stream context. Within these last, we can cite the Ramdom sampling [28] or the Reservoir sampling[28] [18]. The Random sampling [28] uses a little sample to capture the essentials characteristics of a dataset. This can be in the simplest form of a summary to implement and others samples can be con- structed from this one. This method seems to be inadapted when we process data streams with a certain complexity for example health data characterizied by a certain number of variables. Concerning the Reservoir sampling [18], [28] the basic idea is to select a sample size n, from which a ramdom sample of size n can be generated. However, this method has some disadvantages such as the size of the reservoir which can be very large. This can turn this procedure costly. Furthermore, this method is useful for an insertion or an up- date but find its limits at data expiration in a sliding window. Thus, it must be implemented actualization algorithms of the sample with- out affecting the representativity. Indeed, in this type of window, the events no longer part of the current window become exceeded, and if they belong to the sample, they must be replaced. In that sens, many technics have been developed known as sliding windows sampling for processing the case of sliding windows which, for remember, can be logical (defined over a time period) or physical (based on the number of the events) [29], [30].
For the logical windows, we find the periodic sampling [29] which consists to maintain a reservoir sample type for the K first events of the data stream constituting the first window. Then, when an event expires, it is replaced by the new arriving event.
This procedure thus maintains an uniform random sample for the first sliding window of size L and do not demand much memory (K events each moment into the memory). However, this method has the drawback to be highly periodic. It is that the reservoir sampling searches to resolve by adding all new arrived events in the system to a backing sample by affecting to it a given probability (2.θ.K log(L))/L. Then it generates a random sample from this one. When an event expires, it is im- mediately deleted from the reservoir. However, this method does not determine the index of the event which must replace the event to erase. It is the same principle of operation that the chain sampling follows by with a 1/min(i, L) probability where L represents the window size. These different methods requiring a piori knowledge of the number of events cannot be applied to the case of the physical windows. Indeed, these consist of a number of events that vary over time that cannot be guessed a priori. In addition, several window events can vary at the same time (for example when sliding the window). To work around this problem, there are sampling methods based on physical windows.
Among the sampling methods using physical windows [28]– [30], we find the sampling by priority which assigns to each event i a priority pi between 0 and 1 and a replacer chain. What distinguish it from the on-chain sampling. The events in the sample are chosen by considering only those with a higher priority and with a more recent timestamp. We also find the Random pairing sampling [30] which allows to main- tain an uniform sample over a sliding window combining Vitter’s sampling algorithm [28] and whose of Babcock [29]. The algorithm can process any structure S c that tolerates insertions and deletions but with a size that is always fixed.
As another sampling method, we have the join sampling [31], [32] which attempts to connect distributed data streams, for example, from meteorological measurement sensors from several stations. This method has the advantage of drawing each event in the sample in a single pass. However, its use requires having all the frequencies of the join key in the second relation. A last class of the probabilis- tic methods is the clustering techniques set [33]. The clustering problematic have been widely studied in Databases, Data mining and statistics. Indeed, the clustering is widely used by many ap- plications in different domains. However, many of these methods cannot be applied to data stream management because they must be adapted to the data streams volumetry and to the computation power of the systems, in short, to all constraints generally required by the data streams. Furthermore, these methods must operate in one pass instead of many like in classical systems. Thus, viewed the important number of applications appearing in data streams, other researches have been done in the goal to provide new propositions responding to the need of using clustering. This is how the authors of [33] present a distributed version of the clustering algorithm based on the density that they call DbScan [18]. We also find Den- Stream, StreamKM++ [34], etc. The particularity of these different algorithms is that they divide the clustering process in two major steps, to know, the on-line phase in which data are summarized into micro-clusters by conserving the data’s temporal information (times- tamp) and the off-line phase which uses the summaries also called quantifications of the first step to compute the final clusters. In the objective to evaluate these different algorithms, three measures are generally used [18] :
The Accuracy that measures the clusters purity generated by the studied or provided algorithm with clusters having the labels that are of the dataset.
The Normalized Mutual Information (NMI) that provides an independant measure of the number of clusters. It takes the maximal value of 1 only when two sets of labels have a perfect two-to-two match.
The Rand Index that measures the accuracy which is used by a cluster to be able to classify the data elements by comparing the labels of underlying classes.
- Deterministic or statistic techniques of summaries
A data stream can be defined by data of different nature i.e. qualita- tive or quantitative. In the latter case, we find numerical data streams which can be likened to time series whose size is unbounded. In other words, they are streams having a constantly evolving size and whose values are taken in the space of real numbers. As example, we have the phones calls, meteorological data from sensors, etc. Immediately, it is necessary to apply the methods of signal theory to them to summarize such data [35]. Among these efficient and robust mathematical tools, we find histograms [25], [26], wavelet compression, Fourier transformations, discrete cosine transforms, curve segmentation, etc.[27], [36], [37].
The Histograms
Histograms are commonly used in data summaries structures to succinctly capture the distribution of the values (discrete or con- tinuous) in a dataset (a column or a tuple of a table). They have been used for a multitude of tasks such as estimating query sizes, queries responses approximation, as well as in data mining. Fur- thermore, they can be used in order to summarize data which come from streams. The literature offers different types of histograms like Histogrammes V-optimal [11], [12], Equi-Width Histograms, End-Biased Histograms)[25], [26] or Compressed histogram [27].
The comparaison by wavelets
The wavelet transform, like the Fourier transform, is a mathemat- ical tool for capturing the evolution of digital functions (signal processing). They are often used as techniques to provide a rough representation of data, the [38], [39] data cube approximation, etc. In the context of data streams, the constraints known as the large
volume and the often high rate with which events occur in the stream still apply to wavelets taken as a data processing algorithm. And for their use in this field, it becomes necessary to design techniques for processing wavelets in data streams. With this in mind, the authors of [40] show how to dynamically maintain the best wavelet coeffi- cients efficiently as the underlying stream data is updated. While in [41], the authors propose a technique to get closer to the best dyadic (bipolar) interval which best reduces the error. This gave birth to a light algorithm to find the best wavelet representation denoted B-term Haar. It is for this reason that the Haar wavelet representation method relies on constant-valued dyadic intervals. In [12], the authors attempt to construct and update an optimal wavelet summary by considering time series modeling where new events are inserted at the end of the series (stream from a sensor of temperature measured at each instant). And since only the coefficients belonging to the path from the root to the new elements will be changed, most of the wavelet coefficients will not be affected by the insertion of new events. This implies a very simple construction of an algorithm with B coefficients by the use of a metric L2. (Maintain the high- est B coefficients in terms of absolute normalized values among the finalized values, as well as the updated coefficients ( log(N) coefficients, N initial size of the series). These are then compared with the B coefficients to construct a new subset of coefficients of high values and the turnstile modeling where the elements of the stream update the data of the series (distributed sensor streams accumulating their measurements before sending them to a central server) allow a more general wavelet decomposition insofar as all the coefficients can be affected by the arrival of a new event because this can be linked to any event already present in the series. Which makes difficult to maintain the coefficients and therefore to build the summary. Others authors like in [42], use a sketch in order to maintain, according to probabilities, an incremental summary of the data stream which will then be used as a basis for calculate the B coefficients. Those of [43], do not decompose the sketch in wavelets but directly construct their sketch by mean of the data of the stream decomposed in wavelets, afterward the obtained sketch is updated by incremental way. Their algorithm est thus applicable to many areas and is usable for to extend multidimensionnal data streams. In this section, we have seen that with the growth of applications producing massive, fast and varied data streams, computer systems are subject to very great storage and processing constraints [12]. These data can be structured, semi-structured or unstructured and their type can be either qualitative or quantitative. Thus, the need arose to have structures called summaries to store and query the pruned data of the system. These summaries can be generic in order to respond to any kind of query or specific to respond to specific queries only. Different methods such as probabilities, statistics, etc., allow these summaries to be made. Thus, the choice of a summary technique is often guided by the field one wishes to study. How- ever, their excessive memory resource requirements and processing time due to their complexity mean that these techniques do not appear to be the best solution to adopt for the construction of data stream summaries in a large scale context. Furthermore, their use does not always make it possible to have sufficiently representative summaries which can help decision-makers to always be as well informed as possible. These constraints are however nowadays more and more well apprehended by Big data tools.
4. Big Data tools for data streams sum- maries
As discussed in the previous sections, many applications in different fields such as social networks, or IoT, produce huge amounts of varied data in a rapid way; we are talking about Big Data [1]–[3]. ”Big Data” represents large volumes or streams of data that can be structured, semi-structured or unstructured. These data streams are generated quickly so that traditional databases systems do not have sufficient processing and storage resources to support them. This is why new tools adapted to this context have emerged. Generally, these techniques provide high performance, fault tolerance and can operate on distributed architecture systems. For each well-defined stage of the data stream processing cycle, several technologies are available.
4.1 Data streams processing architecture
Each big data solution acts in a well-defined phase of the big data stream processing cycle [44]–[46]. These phases range from the col- lection or ingestion of data streams to the analysis of these streams, including the data processing and storage management. These dif- ferent phases define a multi-layer architecture with those of the highest level strongly dependent on the low level layers. In general, we have 4 main types of architectures (figure 1 ) for processing Big Data data flows having the following layers :
Data retrieval layer which takes care off the collection and transfer of data streams to the processing layer;
Data processing layer which is responsible for performing processing operations on the streams and preparing them to be summarized;
Data storage layer which stores summaries from generated data streams;
Data analysis layer in which the visualization of data is de- fined for analysis and decision-making.
Each of these different layers has its own characteristics and involves its own tools.
4.2 Data streams collect and ingestion
The ingestion [47] step is the entry point for the entire data process- ing system. Indeed, this step links all data streams sources such as the electricity consumption collected in real time from all meters of the network structures (substations, transformers, feeders, etc.) [2] to the storage layer. These streams are collected and then injected into the system by various tools which operate in producer/consumer approach. Given the large amount of data collected, this phase will have to eliminate some unnecessary data through filtering. All this, taking into account significant information such as outliers [48] which may reflect anomalies or matters useful for decision-making. It is also in this step that we have to ensure the generation of meta- data on the structure and origin of the data, but also on the details of the collection. These will be of capital importance for the rest of the phases, more particularly, the data analysis.
In this step can intervene tools such as Kafka [49], Flume [50] or even Nifi [51], etc.
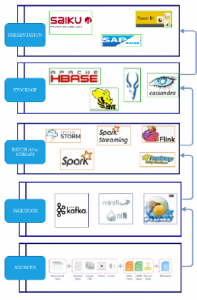
Figure 1: Data Stream processing architecture layers
Kafka is a distributed messaging system that collects and delivers large volumes of data with low latency [49]. Kafka’s architecture is essentially made up of three parts, namely a producer which collects data from different sources then in- jects them into a ”topic”. The topic describes the events of the data stream and has a queue structure. These queues are managed by brokers who are simple systems responsible for maintaining published data. Each broker can have zero or more partitions per topic. If a topic admits N partitions and N brokers, each broker will have a single partition. If the num- ber of brokers is greater than the number of partitions, some will not have any partition from this topic. The third element in the Kafka architecture is the consumer which retrieves the elements of the topic then injects them into a processing layer upstream. Producer and consumer can be written in differ- ent languages like Java, Python or Scala etc. There are also producers already defined (owners) such as in Azure [52], CDC (Change Data Capture) techniques [53] which make it possible to detect changes (insert, update, etc.) on the rela-
Table 1: Big Data streams processing main architectures
| Technology | Principle | Advantages | Incovenients | Usage |
| Traditionnal
Big data architecture |
• Positionned to solve the prob-
lems of traditional BI • It can be seen that it still re- tains the ETL action and en- ters the data storage through the ETL action. |
• Simple and easy to imple-
ment as per BI system con- cerns • The basic methodology has not changed. • The only change is the selection of technology, re- placing the BI components with the big data architec- ture. |
• For big data, there is no
such complete cube archi- tecture under BI. • At the same time, the architecture is still mainly batch processing and lacks real-time support. |
• Data analysis needs are
still dominated by BI sce- narios •as But due to issues such data volume and perfor- mance, they cannot meet daily use. |
| Data stream-
ing architec- ture |
• The batch processing is di-
rectly removed • And the data is processed in the form of streams throughout the entire process. • The ETL is replaced with a data channel. • The data processed by stream processing is directly pushed to consumers in the form of mes- sages. • Although there is a storage part, the storage is more stored in the form of windows, so the storage does not occur in the data lake, but in the peripheral system. |
• There is no bloated ETL
process, • The effectiveness of the data is very high |
• For streaming architec-
ture, there is no batch pro- cessing, so data replay and historical statistics cannot be well supported. • For offline analysis, only analysis within the window is supported. |
• One can use this as an
early warning • The different monitoring aspects, and the data valid- ity period requirements. |
| Lambda ar-
chitecture |
• Lambda’s data channel is di-
vided into two branches real- time streaming and offline. • Real-time streaming basically depends on much of the stream- ing architecture to ensure its real-time performance • While offline is mainly batch processing to ensure final con- sistency. |
• Both real-time and offline,
covering the data analysis scenarios very well. |
• Although the offline layer
and the real-time stream face different scenarios • Their internal processing logic is the same, so there are a lot of honors and du- plicate modules. |
• There are both real-time
and offline requirements. |
| Kappa archi-
tecture |
• The Kappa architecture is op-
timized on the basis of Lambda • Combining the real-time and streaming parts • And replacing the data chan- nel with a message queue. |
• The Kappa architecture
solves the redundant part of the Lambda architecture. • It is designed with an ex- traordinary idea of replay- ing data. v• The entire architecture is ery simple. |
• Although the Kappa archi-
tecture looks concise • It is relatively difficult to implement, especially for the data replay part. |
• It provides features like
Lambda architecture. |
databases like Debezium [54] in the NoSQL, the Neo4j Stream connector which links Kafka to the graph-oriented database Neo4j [55]. In addition, in order to be able to query the data of the stream passing through the topic, Kafka now has the KSQL language [56] which is an SQL-like language for streaming. The kafka project is now supported by the Apache foundation.
Flume is a collecting, aggregating and transferring framework of large volumes of data in HDFS (Hadoop Distributed File System) [50] file systems such as Hadoop, HBase or Spark [47]. In addition to the Hadoop ecosystem, Flume also allows the injection of data stream from social networks such as twit- ter, facebook, etc. Like kafka, Flume’s architecture consists mainly of three parts, namely the source, the chain and the sink. The source retrieves the data streams to put them in the chain or channel. The Flume sink component ensures that the data in the chain has been transmitted to the destination which can be HBase, Hadoop, etc. In this architecture, the source, the chain and the sink are together called Agents. The figure 3 describes this architecture.
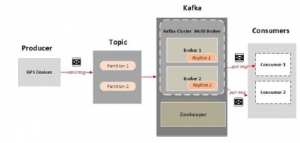
Figure 2: Kafka Architecture
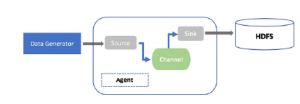
Figure 3: Flume Architecture
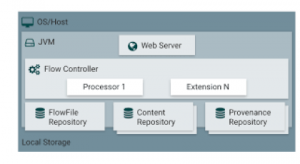
Figure 4: Nifi Architecture
Nifi [51] is a data ingestion technology that uses data stream oriented processing. It enables data acquisition, basic event processing and a data distribution mechanism. NiFi provides organizations with a distributed platform for building [57] enterprise workflows. It provides the ability to accommodate various data streams generated by IoT. NiFi enables seamless connections to databases, big data clusters, event (message) queues and devices. It incorporates tools for visual command, control, provenance (lineage or data traceability), prioritiza- tion, buffering (back pressure), latency, throughput, security,
scalability and extensibility [58]. NiFi is highly configurable and provides a scalable and robust solution to process and in- tegrate data streams of various formats from different sources on a cluster of machines. It allows to manipulate data of network failure, bad data, security, etc. MiNiFi2 [59], [47], a sub-project of Apache NiFi is a complementary approach to NiFi fundamentals in data stream management, focusing on data collection at the source of their creation.
These different tools can be used separately but are not universal. In that way and according to the needs or scenarios, we can combine them. Thus Flume or Nifi can be used as a producer or consumer of Kafka. The combination of Flume and Kafka allows Kafka to avoid custom coding and take advantage of Flume’s sources and strings, while Flume events passing through Kafka’s topic are stored and replicated between Kafka’s brokers for more resilience [60]. The combination of tools might seem unnecessary, as it seems to introduce some overlap in functionality. For example, NiFi and Kafka provide brokers to connect producers and consumers. How- ever, they do it differently: in NiFi, most of the data stream logic does not reside inside the producer / consumer, but in the broker; which allows centralized control [60]. NiFi was designed primarily for data stream management. With the two tools combined, NiFi can take advantage of Kafka’s reliable storage of stream data, while overcoming some Kafka [60] limitations such as lack of monitoring tools, reduced performance when a message has need to be touched up.
Table 2 compares these different tools.
4.3 Data stream processing
This step is responsible for standardizing the formats unsuitable for analyzing the data collected and extracting relevant informa- tion. It is also responsible for eliminating potentially erroneous data. Indeed, the [61] veracity criterion of Big Data requires verifying whether the data received is reliable and must therefore be verified before analysis. This processing can be done in two ways, namely stream processing or batch processing [44]–[46].
- The batch processing
In the batch processing [62], [63], the data is collected and grouped into blocks of a certain duration (minute, hour, etc.) then injected into a processing system. For example, processing all measure- ments taken by the sensors after 10 minutes [64]. So, rather than processing data streams as streams, current configurations ignore the continuous and timely nature of data production. Data collection tools, workflow managers and planners orchestrate batch creation and processing [47]. This constitutes a continuous line of data pro- cessing [46]. Batch processing is best suited when the data streams are received offline (the data source only delivers its information every 30 minutes for example) and when it is more important to pro- cess large volumes of data to obtain more detailed information than to get quick scan results. For batch processing, there are different distributed platforms that provide scalable processing on clusters. Among these tools we find :
Table 2: Kaka, Flume, Nifi comparison
| Ingestion tool | Out-of-the-box | Limites | Uses cases |
| Flume | • Configuration-based
• Sources, channels & sinks • Interceptors |
• Data loss scenarios when
not using Kafka channel • Data size (KB) • No data replication |
• Collecting
• Aggregating and mov- ing high volume streaming events into hadoop |
| Kafka | • Back-pressure
• Reliable stream data storage • Kafka stream • Sources/skins with Kafa con- nect |
• Custom coding often
need • Data size (KB) •col Fixed proto- /format/schema |
• Streaming
• Messaging • Systems integration • Commit log |
| Nifi | • Configuration-based UI
• Many drag & drop processors • Back-pressure • Prioritized queuing • Data provenance • Flow template |
• Not for CEP or windowed
computations • No data replication |
• Dataflow management
with visual control • Data routing between dis- parate systems • Arbitrary data size |
Apache Hadoop [65] which is one of the most popular batch processing frameworks. Hadoop uses a master / slave archi- tecture. The master is named namenode and is responsible for keeping the metadata on the cluster and distributes the data on the slaves. These are called datanodes and are used for stor- age in HDFS (its distributed file system). The namenode can also have a copy called secondary namenode which allows the cluster to be maintained in the event of the first on falling and thus becomes the main node [66]. By default, Hadoop stores the data to be processed in its distributed file system (HDFS) in CSV, Parquet or ORC format. However, it provides tools to store data on external databases such as NoSQL HBase or Cassandra databases. Hadoop uses the Map-Reduce [67] programming model for parallel data processing.
We can also use Apache Spark [62], [68] which is a data processing framework that implements an execution engine based on direct acyclic graphs (DAG) and divides the process- ing into micro-batches. It also provides an SQL optimizer. In order to maximize the performance of Big Data applica- tions, Spark supports in-memory processing but also on-disk processing when the data does not fit in memory. A Spark application takes its data from a collection of sources (HDFS, NoSQL, relational databases, etc.) or by interacting with data ingestion tools like Kafka, then applies a set of processes to them to generate interpretable results. For this, Spark uses an architecture made up of: [69] i) Spark driver which is the main node of a Spark cluster and which converts the process- ing into a set of tasks and then transmits them to ii) Cluster Manager which will carry them out on a set of iii) Executors which will be responsible for executing them.
There are several customized distributed computing architectures for batch processing [62]–[64]. However, they are not suitable for stream processing because in the Map-Reduce paradigm, all input data must be stored on a distributed file system (like HDFS) before starting processing. However, with data streams, there always arises the main storage constraint which means that this is not possible with the unlimited size of the data streams; hence the need to have streaming processing tools.
- The stream processing
To process the data streams as they arrive in the system, it is nec- essary to carry out ongoing processing on them in order to be able to draw knowledge from them since their storage is not allowed by available resources [62]. This stream processing is generally carried out on clusters of distributed machines to allow to scale-up. This provides a certain availability of processing resources (memory and CPU). It is in this sense that recent Big Data platforms have been born such as Apache Storm [70], Spark Streaming [71], Apache Flink [64], Samza [72] which process continuous streams messages on distributed resources with low latency and high throughput [44]– [46].
Apache Storm [70] is a stream processing framework devel- oped by the company Backtype acquired by Twitter. The main goal of Storm is the processing of data streams in a dis- tributed way with fault tolerance. To achieve this, it provides a framework for hosting applications and two approaches for creating these applications. The first approach called ”clas- sic” composes the application according to a directed acyclic graph (DAC) called topology. The topmost part of this graph takes input from sources like Kafka. These data sources are called spouts. The latter therefore pass the data to processing units called bolts which will be responsible for executing the requests on the data streams. The second approach is a model for building applications called Trident [73]. This is a high level of abstraction at the top of the topology. This model is more for familiar operations like aggregations and persistence. It provides primitives intended for this type of processing. A Trident therefore calculates a topology by combining and splitting operations into appropriate collections of bolts.
Spark [68] makes possible to process data which is frozen at an instant T. Thanks with the Spark Streaming module,
Table 3: Processing tools comparaison (1)
| Storm | Trident | Samza | Spark streaming | Flink (streaming) | |
| Strictest guarentee | at-least-once | exactly-once | at-least-once | exactly-once | exactly-once |
| Achievable latency | << 100 ms | < 100 ms | < 100 ms | < 1second | <100 ms |
| State Management | Small state | Small state | YES | YES | YES |
| Processing model | one-at-a-time | mico-batch | one-at-a-time | mico-batch | one-at-a-time |
| Back pressure | YES | YES | No buffering | YES | YES |
| Ordering | NO | between batches | within partitions | between batches | within partition |
| Elasticity | YES | YES | NO | YES | YES |
it is possible to process data streams which arrive continu- ously, and therefore to process this data as and when as they arrive. Spark Streaming [71] is therefore an extension of Spark for streaming processing. It provides fault tolerance in real-time processing of data streams. The framework will accumulate data for a certain period of time and then produce a small RDD (Resilient Distributed Dataset). This RDD ac- cumulation / production cycle will recur until the program is terminated. We are talking here about micro-batches as opposed to processing events one by one. Spark Streaming di- vides the incoming stream into these micro-batches of specific intervals and then returns a Dstream. The latter represents a continuous stream of data ingested by a source like Kafka, Flume, Twitter, etc. Dstreams are processed and then sent to a file system, database, real-time dashboard, etc. With micro- batch processing, Spark Streaming will add a delay between the arrival of a message and its processing. This therefore opposes it here to Apache Storm which offers real-time pro- cessing of events and non-compliance with the constraint (1) presented in section 3. This difference in processing, however, allows Spark Streaming to offer a guarantee of exactly once message processing under normal conditions (each message is delivered once and only once to the program, without loss of messages), and at least once in degraded conditions. (a message can be delivered several times, but always without losses). Storm in turn allows to adjust the guarantee level but, to optimize performance, the at most once mode (each message is delivered at most once but losses are possible) must be used. Another advantage of Spark Streaming is its API which is identical to the classic Spark API. It is thus possible to manipulate data streams in the same way as we manipulate frozen data.
Apache Flink [64] follows a paradigm that embraces data streams processing as a unified model of real-time analy- sis, streaming data stream, and batch processing in a single programming model and with a only execution engine. In comparison with ingestion techniques like Kafka which allow a quasi-arbitrary reproduction of data streams, the data stream processing programs do not distinguish between the fact of processing the latest events in real time (Storm), the con- tinuous aggregation of data periodically in windows (Spark Stream). Rather, they just start processing at different points in the continuous data stream and maintain states during [64] processing. While Flink on the other hand, through a highly
flexible windowing mechanism, can process both early and approximate results, as well as delayed and precise results, in the same operation, thus avoiding the need to combine different systems for them for the two use cases [64]. The ar- chitecture of a Flink cluster includes three types of processes: the client, the Job Manager and at least one Task Manager. The client takes the program code, transforms it into a data stream graph and submits it to the Job Manager. This trans- formation phase also examines the data types (schema) of the data exchanged between operators and creates serializers and other type/schema specific codes. The Job Manager coordi- nates the distributed execution of the data stream. It tracks the status and progress of each operator and each stream, schedules new operators, and coordinates checkpoints and recovery. In a high availability configuration, the Job Man- ager maintains a minimal set of metadata at each checkpoint to fault-tolerant storage, so that a standby Job Manager can rebuild the checkpoint and recover the data stream execution from there. The actual data processing takes place in the Task Managers. A Task Manager executes one or more operators that produce streams and report their status to the JobMan- ager. Task Managers manage buffer memory pools to buffer or materialize streams, and network connections to exchange data streams between cluster operators. In comparison to Spark, Flink incorporates i) an execution dataflow that lever- ages pipelined execution of distributed batch and streamed data flows, ii) native iterative processing, iii) sophisticated windowing semantics.
Samza [72] is another LinkedIn project in the real-time data stream processing space. Become open source and added to the incubator of the Apache family of projects, Samza is a framework for real-time processing of data streams built on top of the Apache YARN infrastructure as well used by Spark or in Hadoop. Like Storm with Trident, Samza provides some primitives for building common types of data streams process- ing applications and for maintaining states within those same applications. The Samza application is based on the Appli- cation Manager which is used in order to manage the Samza Task Runners which are hosted in containers called YARN Containers. These Task Runners perform Stream Tasks which are the equivalent of Storm bolts for Samza. In other words, they take care of doing the desired processing on the events of the data stream such as the computation of aggregate func- tions (sum, min, max, avg, count, etc.). All communications
Table 4: Processing tools comparaison (2)
| Technology | Principle | Advantages | Incovenients | Languages |
| Apache
Spark |
• The Apache Spark Architec-
ture is founded on Resilient Dis- tributed Datasets (RDDs). • These are distributed im- mutable tables of data, which are split up and allocated to workers. • The worker executors imple- ment the data. |
• Apache Spark is a mature prod-
uct with a large community • Proven in production for many use cases • And readily supports SQL query- ing. |
• Spark can be complex to set up
and implement • It is not a true streaming engine (it performs very fast batch pro- cessing) • Limited language support • Latency of a few seconds, which eliminates some real-time analyt- ics use cases |
• Python
• Java • Scala • R • SQL. |
| Apache
Storm |
• The Apache Storm Architec-
ture is founded on spouts and bolts. • Spouts are origins of informa- tion and transfer information to one or more bolts. |
• Probably the best technical solu-
tion for true real-time processing • Use of micro-batches provides flexibility in adapting the tool for different use cases • Very wide language support |
• Does not guarantee ordering of
messages, may compromise relia- bility • Highly complex to implement |
• Java |
| Apache
Samza |
• Apache Samza uses the
Apache Kafka messaging sys- tem, architecture, and guaran- tees, to offer buffering, fault tol- erance, and state storage. |
• Offers replicated storage that pro-
vides reliable persistency with low latency. • Easy and inexpensive multi- subscriber model •loCan eliminate backpressure, al- wing data to be persisted and pro- cessed later |
• Only supports JVM languages
• Does not support very low la- tency • Does not support exactly-once semantics |
• JVM lan-
guages |
| Apache
Flink |
• Apache Flink is a stream
processing framework that also handles batch tasks. • Flink approaches batches as data streams with finite bound- aries. |
• Stream-first approach offers low
latency, high throughput • Real entry-by-entry processing • Does not require manual opti- mization and adjustment to data it processes • Dynamically analyzes and opti- mizes tasks. |
• Some scaling limitations
• A relatively new project with less production deployments than other frameworks |
• Java
• Maven |
from Samza are submitted to Kafka brokers. Similar to Data nodes in a Hadoop Map-Reduce application, these brokers are often co-located on the same machines hosting Samza’s con- tainers. Samza therefore uses the topics or subjects of Kafka and a natural partitioning to implement most of the grouping modes found in data streams processing applications.
Both modes of processing have their advantages and disadvan- tages. The major advantage of streaming processing is its lack of complexity since it processes the data stream as it receives it. Also in comparison in terms of processing time, the stream processing has a lower latency time since the tuples are processed immediately after their arrival. However, they often have a low output rate. In addition, fault tolerance and load balancing are more expensive in stream processing than in batch processing [74], [75].
In batch processing, splitting data streams into micro-batches reduces [76] costs. Certain operations like state management are the most difficult to implement because the system will then have to consider the whole [77] batch. We can also note that the batch processing can also be incorporated into a stream processing as in Flink [64] or Apache Streaming [71], [78]. The choice of the
type of processing and the tools will be guided by the nature of the application to be implemented. Thus, in the literature there are still other technologies that we have not studied in this paper such as [63], [79]–[84] for Stream processing. The figure 3 provides some elements of comparison of these different tools. In general, they meet the constraints given in section 3.
The table 4 is a comparison of these differents tools.
4.4 Summary or partial storage of data streams
In this layer, the processed data streams upstream are then integrated. After this processing, they are likely to be aggregated according to different temporal granularities. Then, they can be modeled ac- cording to a more suitable format to build a data stream summary which will be used for the partial storage of the stream and for its analysis later. This layer involves solutions such as HBase, Hive or even Cassandra for NoSQL databases management [44]–[46]. NoSQL databases are most often used to store Big Data [85], [86]. They are schema-free and allow the storage of many data formats without prior structural declarations. They are grouped into four categories according to the difference in implemented data models.
Table 5: Storage tools comparaison
| Technology | Principle | Advantages | Inconvenients | Usage |
| HBase | • Distributed and scalable big
data store newline • Strong consistency newline • Built on top of Hadoop HDFS newline • CP on CAP |
• Optimized for read
• Well suited for range based scan • Strict consistency • Fast read and write with scal- ability |
• Classic transactional applica-
tions or even relational analyt- ics • Applications need full table scan • Data to be aggregated, rolled up, analyzed cross rows |
• Facebook mes-
sage. |
| Cassandra | • High availability
• Incremental scalability • Eventually consistent • Trade-offs between consis- tency and latency • Minimal administration • No SPF (Single point of fail- ure) – all nodes are the same in Cassandra • AP on CAP |
• Simple setup, maintenance
code • Fast random read/write • Flexible parsing/wide column requirement • No multiple secondary index needed |
• Secondary index
• Relational data • Transactional operations (Rollback, Commit) • Primary & Financial record • Stringent and authorization needed on data • Dynamic queries/searching on column data • Low latency |
• Twitter
• Travel portal |
| Hive | • Hive can help the SQL savvy
query data in various data stores that integrate with Hadoop. • Hive’s partitioning feature limits the amount of data. Par- titioning allows running a filter query over data stored in sepa- rate folders and only reads the data which matches the query. |
• It uses SQL.
T• Fantastic Apache Spark and ez Integration. • You can play with User De- fined Functions (UDF). • It has great ACID tables with Hive 3+. • You can query huge Hadoop datasets. • Plenty of integrations (e.g., BI tools, Pig, Spark, HBase, etc.). •likOther Hive-based features e Hive Mall can provide some additional unique func- tions. |
• Very basic ACID functions
• High latency • Hive isn’t the best at small data queries (especially in large volume) |
• Hive should be
used for analytical querying of data collected over a pe- riod—for instance, to calculate trends or website logs. |
Thus, we distinguish between key-value oriented , column-oriented, document-oriented and graph-oriented models. In the rest of this section, we will introduce some NoSQL database management sys- tems.
Hbase [85] is a distributed, column-oriented database man- agement system built on the Hadoop [65] HDFS file system on which it constitutes a major component of the ecosystem by providing real-time read / write access to HDFS files. The architecture of HBase is made up of worker nodes in HBase also called Region Servers. Each Region Server contains an arbitrary number of regions. Each region is responsible for storing rows from a specific table, based on an interval of row keys. The actual contents of the lines are stored in HF files on the underlying HDFS file system. An HBase master node coordinates the Region Servers and assigns their row key intervals. HBase provides fault tolerance for storing large volumes of sparse data. It includes an environment allowing compression, in-memory processing and filters on database columns. HBase is used more and more in different systems
like facebook messaging system. It also provides an API in Java [85]. When processing [66] data streams, HBase is used to store the results or summaries obtained either in batch with Spark or in Stream with Storm for analysis purposes. HBase performs very well for real-time analysis of big data streams, and is thus used by Facebook for message processing and real-time analysis [46], [87].
Hive [88] is a data warehouse structure for analyzing struc- tured data stored in Hadoop. These data from the HDFS sys- tem can be in CSV, Avro, Parquet or even ORC format. Hive is most often used for the purpose of creating big data stream summaries and making them easy to query by providing an SQL like language called HQL or HiveQL. It also provides ODBC drivers for accessing data by tools such as Power BI Desktop etc. Hive supports [89] online scanning. The ar- chitecture of Hive is composed of an interface with the user (either in command line or in graphical mode), of a metastore which is a database of metadata on the tables and databases created in Hive, a Thrift Server allowing the operation of Hive and executing the queries, a Driver which manages the life cycles of HiveQL queries during compilation, optimization and execution, a Compiler which is invoked by the driver by passing it the HQL request. The latter transcribes this into a plan or a DAG of map-reduce jobs [67]. This plan is then transmitted to the execution engine in topological order. Hive uses Hadoop as the [90] runtime engine.
Apache Cassandra [86] is a NoSQL database management system that provides a distributed and decentralized storage system for managing large volumes of data. It is column oriented and provides scalability, fault tolerance and consis- tency [91]. In Cassandra’s architecture, there is no master node to manage all the nodes of the network like the HBase namenode [87]. The distribution of the data on the different nodes is done in an equivalent manner. Cassandra defines this environment to guarantee more consistency of data as well as for the availability of resources [92]. For its good writing performance, Cassandra is increasingly used for processing [87] data streams by different organizations like Facebook and for IoT [86], etc.
These tools that we have just mentioned are not the only ones. There are others like MongoDB [93] a document oriented database, Neo4j [55] graph oriented from NoSQL technologies . The choice of one or the other of these systems must be made according to the needs of the application.
Also, as discussed in section 3, data streams summaries are ei- ther generalist or specific in nature. This separation is also followed by Big Data tools which can often be used in both summary type cases. Thus there are some implementations such as the MongoDB
[93] database used in [94] in order to analyze the data streams col- lected from sensors positioned on sick subjects allowing the doctor to make the right diagnoses in order to administer the best treatments and be more reactive in the event of attacks (respiratory, cardiac or stroke, etc.) [95]–[97] leader in data-oriented graph which has developed for its server a connector for Kafka and Confluent called Neo4j Streams [98] allowing to integrate streaming events for the analysis of financial frauds, knowledge graphs and a vision to all levels of clients of the [99] system. There are also key-value ori- ented NoSQL databases like Redis [100] coupled with Storm in
[101] and [102] to keep static data on clients who have visited a website in order to be able to enrich the analyzes carried out on the sections on which they had to click, we speak of clickstream as well as in [103] for the analysis of Twitter data. Table 5 provides a comparison of these different tools.
4.5 Data stream visualization and analysis
In order to facilitate decision making from data streams, they must be described according to a certain number of representation models such as tables, graphs, curves, etc. And these different visuals when put together, make it possible to build dashboards. In this sense, this phase of data analysis is one in which we can detect intrinsic patterns, extract relationships and knowledge, but also correct errors and eliminate ambiguities. It then makes it possible to be able to interpret the data streams more easily. This is because decision- makers must interpret the results of an analysis of data stream. This is necessary in order to rule out errors. SAP Hana [104], Power BI [105] Saiku [106] are different tools for carrying out this analysis. Table 6 provides a comparison of these different tools.
As for the other phases of the architecture, there are a very large number of tools in the literature for visualizing data streams such as Splunk [44]–[46], [108].Power BI [105] is a self-service Business Intelligence solution produced by Microsoft. It provides business user-oriented data visualization and analysis capabilities to upgrade the decision-making process and business visions. Power BI is a cloud-based, self-service BI solution. This means that we can build and deploy a solution immediately with data from cloud and on-premises data sources, systems and functions. Power BI is composed of two main parts namely a server installed locally or at Microsoft to host the reports and a tool to create and publish these [105] reports. It provides connectors to ac- cess different data sources like Hive, etc. For example, when a visualization (table, graph, etc.) in a dashboard is connected to a real-time data source (Direct Query), the visualization up- dates continuously, allowing faster information [105]. When dealing with data arriving in real time, this ability to automati- cally update reports offered by Power BI has a real advantage. Thus, it allows decision-makers to be informed at all times about the overall state of the subject studied.Saiku [106] offers a user-friendly web analytics solution that allows users to quickly and easily analyze their data and cre- ate or share reports. Saiku connects a wide range of OLAP servers including Mondrian, Microsoft Analysis Services, SAP BW and Oracle Hyperion and can be deployed quickly and inexpensively to allow users to explore data in real time. SAP Hana [104] is a column-oriented and in-memory rela- tional database management system and has a database server to store and retrieve data requested by applications in real time. In addition, SAP Hana performs advanced real-time analysis of big data streams (prescriptive and predictive anal- ysis, sentiment analysis, spatial data processing, continuous analysis, text analysis, social network analysis, text search, processing. graphics data) and contains ETL capabilities as well as a real-time application server [107].
5. Future works
It is possible to note that even if the works presented in this study provide rather interesting results, they do not always make it pos- sible to satisfy the requirements subject to data streams. Indeed, if we consider data streams with several dimensions the requirements of representativeness which means that a model must always re- main faithful to the source data is not always guaranteed. Also the requirement of compactness which makes it possible to guarantee that the model will be able to hold in memory can be not assured. The genericity prerequisite used in order to optimize the processing and storage times and to respond to different types of requests can also be not. The dynamicity criterion making it possible to take into account new events that have arisen in the stream or even rapid
Table 6: Visualization tools comparaison
| Technology | Principle | Advantages | Incovenients | Usage |
| Saiku | • A lightweight open-source an-
alytical tool which is written in HTML/JavaScript (jQuery) • Focuses on fast and config- urable OLAP analysis. |
• Undertake complex, pow-
erful analysis using an easy to use, drag and drop inter- face, via the browser • Diverses data source. De- ployement quickly with the graphical • User friendly Schema De- signer for designing data models. • Creation consistent and re-usable meta data • RESTful web-services provider with JSON data payload. |
• Pricing : to take advan-
tage of all the features of Saiku Enterprise every user requires a licence |
• Add reporting and anal-
ysis to any application or website • Explore data in Mon- goDB, Spark and more, di- rectly from the browser. • Caching to address perfor- mance and speed up analy- sis. |
| Power BI | •b Power BI is a cloud-based
usiness analysis and intelli- gence service by Microsoft. • It is a collection of business in- telligence and data visualization tools such as software services, apps and data connectors. |
• Cost-effective
• Custom visualization • High data connectivity • Regular updates • Integration with Excel • Attractive visualizations |
• Crowed user interface
• Difficult to understand • Rigid formulas (DAX) |
• Real-time analysis
• custom visualizations • Quick Insights |
| SAP HANA | SAP HANA is a tool, which
comprises: • An in-memory HANA database • Data modeling tools • Data provisioning • And HANA administration, making it a suite. |
• Provides real-time analy-
sis and decision-making ca- pability. • It enables processing of large amounts of data while the business is going on. Thus, it provides instant real-time insights. |
• SAP HANA is only com-
patible to and thus will run only on SAP or SUSE Linux certified hardware. • Limited hardware com- patibility makes wanting to use SAP HANA a costly in- vestment. |
• Core process accelerators
• Planning, Optimization applications • Sense and response ap- plications i.e. SAP HANA works as a digital core for an Internet of things (IOT). |
updating in order to be able to provide responses quickly and not constitute a bottleneck or a blocking factor for the stream can also be not guaranteed. All of these factors would increase processing times and the difficulty to storage some data for the aim of analysis. Thus, to overcome these various concerns, we will soon be proposing a generic data stream summary model based on Big Data technologies as well. This model should make it possible to col- lect, transform, store, process and present data streams. It would be defined by different storage structures in cascade where each level of the cascade would correspond to a time granularity that would define when new measures would be calculated. For data collection, we would use technologies as Apache Kafka combined with some technics like random functions to produce stream. Form the streams processing, we would aim to use streaming technolo- gies like Apache Storm and for the storage, we would use NoSQL technologies as Apache HBase. This model would be based over
Titled Time Windows to manage the space and time dimensions.
6. Conclusion
With the advent of intensive applications which produce huge vol- umes of data like fraud detection, roads traffic monitoring, the
management of smart electricity meters, etc. it becomes necessary for companies, science, finance, medicine, etc. to be able to anal- yses and use the results obtained by the mean of this Big data for decisions making. However, processing of these data streams is often confronted to storage and computation constraints caused by the fact that they are generated in swift and continuous manner with variables velocities. In this paper, our main goals were to study and evaluate classical techniques and Big data tools used to generate data stream summaries, the architectures defined and tools that can be used and in what layer of these architectures for to answer user’s queries. Thus we have drawn up a state of the art on data streams summaries. Classical methods of stream data summary have many benefits but their implementation entails constraints which are the limits of storage and processing capacities available in traditional systems which that Big data tools can deal with. Indeed, with Big Data solutions, new possibilities are opening up to better understand these limits. In this sense, we have presented different architectures for the processing of data stream of a Big Data nature which in- volves in each of their layers a certain number of tools (Section 4). These architectures have thus been implemented by various approaches combining Big Data technologies with those of NoSQL in order to overcome the problem of processing and storage relating to data stream. These different proposals are most often distributed over clusters.
- A. Murphy, C. Taylor, C. Acheson, J. Butterfield, Y. Jin, P. Higgins, R. Collins, C. Higgins, “Representing financial data streams in digital simulations to support data flow design for a future Digital Twin,” Robotics and Computer- Integrated Manufacturing, 61, 101853, 2020, doi:https://doi.org/10.1016/j. rcim.2019.101853.
- R. Verde, A. Balzanella, A Spatial Dependence Measure and Prediction of Georeferenced Data Streams Summarized by Histograms, chapter 5, 99–117, John Wiley & Sons, Ltd, 2020, doi:https://doi.org/10.1002/9781119695110. ch5.
- P. K. Padigela, R. Suguna, “A Survey on Analysis of User Behavior on Digital Market by Mining Clickstream Data,” in K. S. Raju, A. Govardhan, B. P. Rani,
R. Sridevi, M. R. Murty, editors, Proceedings of the Third International Conference on Computational Intelligence and Informatics, 535–545, Springer Singapore, Singapore, 2020. - R. Sahal, J. G. Breslin, M. I. Ali, “Big data and stream processing platforms for Industry 4.0 requirements mapping for a predictive maintenance use case,” Journal of Manufacturing Systems, 54, 138–151, 2020, doi: https://doi.org/10.1016/j.jmsy.2019.11.004.
- F. Zheng, Q. Liu, “Anomalous Telecom Customer Behavior Detection and Clustering Analysis Based on ISP’s Operating Data,” IEEE Access, PP, 1–1, 2020, doi:10.1109/ACCESS.2020.2976898.
- L. Rutkowski, M. Jaworski, P. Duda, Basic Concepts of Data Stream Min- ing, 13–33, Springer International Publishing, Cham, 2020, doi:10.1007/ 978-3-030-13962-9 2.
- S. Zhang, F. Zhang, Y. Wu, B. He, P. Johns, “Hardware-Conscious Stream Processing: A Survey,” 2020.
- T. Dilova, Y. Anastasov, V. Yordanov, N. Milovanov, D. Dzhonova, “Arrangement for enriching data stream in a communications network and related method,” 2020.
- B. Tidke, R. Mehta, D. Rana, H. Jangir, “Topic Sensitive User Clustering Using Sentiment Score and Similarity Measures: Big Data and Social Network,” International journal of web-based learning and teaching technologies, 15(2), 34–45, 2020.
- B. Csernel, Re´sume´ ge´ne´raliste de flux de donne´es. PhD thesis, Ph.D. thesis, 2008.
- B. Babcock, S. Babu, M. Datar, R. Motwani, J. Widom, ““Models and Issues in Data Stream Systems.”,” 1–16, 2002, doi:10.1145/543613.543615.
- R. Chiky, Re´sume´ ge´ne´raliste de flux de donne´es. PhD thesis, Ph.D. thesis, 2009.
- C. Midas, A. Inria, “Re´sume´ ge´ne´raliste de flux de donne´es,” Extraction et gestion des connaissances (EGC’2010), Actes, 26 au 29 janvier 2010, Hammamet, Tunisie, 2010.
- B. Csernel, F. Clerot, G. He´brail, “Datastream clustering over tilted windows through sampling,” 2006.
- C. Aggarwal, J. Han, J. Wang, P. Yu, T. Watson, R. Ctr, “A Framework for Clustering Evolving Data Streams,” 2003.
- N. Alon, Y. Matias, M. Szegedy, “The Space Complexity of Approximating the Frequency Moments,” Journal of Computer and System Sciences, 58, 137–147, 1999, doi:10.1006/jcss.1997.1545.
- P. Jukna, Probabilistic Counting, 41–51, 2011, doi:10.1007/ 2-17364-6 3.
- C. Aggarwal, J. Han, J. Wang, P. Yu, T. Watson, R. Ctr, “A Framework for Clustering Evolving Data Streams,” 2003.
- Y. Tille´, The´orie des sondages: e´chantillonnage et estimation en populations finies, 2001.
- P. Flajolet, G. Martin, “Probabilistic Counting Algorithms for Data Base Applications,” Journal of Computer and System Sciences, 31, 182–209, 1985, doi: 10.1016/0022-0000(85)90041-8.
- A. Ebrahim, J. Khlaifat, “An Efficient Hardware Architecture for Finding Frequent Items in Data Streams,” 113–119, 2020, doi:10.1109/ICCD50377. 2020.00034.
- B. Bloom, “Space/Time Trade-offs in,” 2002.
- R. Chiky, B. Defude, G. He´brail, “De´finition et diffusion de signatures se´mantiques dans les syste`mes pair-a`-pair.” 463–468, 2006.
- E. Eydi, D. Medjedovic, E. Mekic´, E. Selmanovic, Buffered Count-Min Sketch, 249–255, 2018, doi:10.1007/978-3-319-71321-2 22.
- I. Kutsenko, “OPTIMIZATION OF QUERY IN RELATIONAL DATABASES,” EurasianUnionScientists, 2, 52–58, 2018, doi: 10.31618/ESU.2413-9335.2018.2.56.52-58.
- P. Ravi, D. Haritha, P. Niranjan, “A Survey: Computing Iceberg Queries,” International Journal of Engineering & Technology, 7, 791, 2018, doi: 10.14419/ijet.v7i2.7.10979.
- A. Cal`?, “Querying web data,” 9050, 2015.
- C. Myers, Random Sampling, 91–106, 2020, doi:10.1201/ 9780429292002-ch07.
- B. Babcock, M. Datar, R. Motwani, “Sampling From a Moving Window Over Streaming Data,” Proc. SODA, 2001, doi:10.1145/545381.545465.
- R. Gemulla, W. Lehner, P. Haas, “A Dip in the Reservoir: Maintaining Sample Synopses of Evolving Datasets.” 595–606, 2006.
- K. Ying, J. Wu, G. Dai, C. Miao, C. Fan, Q. Chen, “A kind of data aggregation technology based on linear time probabilistic counting algo- rithm,” Chinese Journal of Sensors and Actuators, 28, 99–106, 2015, doi: 10.3969/j.issn.1004-1699.2015.01.018.
- W. Ren, X. Lian, K. Ghazinour, “Efficient Join Processing Over Incomplete Data Streams,” 209–218, 2019, doi:10.1145/3357384.3357863.
- Y. Wang, T. Peng, J.-Y. Han, L. Liu, “Density-Based Distributed Clustering Method,” Ruan Jian Xue Bao/Journal of Software, 28, 2836–2850, 2017, doi: 10.13328/j.cnki.jos.005343.
- N. Goyal, P. Goyal, K. Venkatramaiah, “An Efficient Density Based Incremental Clustering Algorithm in Data Warehousing Environment,” 2021.
- Y. Pitarch, Re´sume´ de Flots de Donne´es : motifs, Cubes et Hie´rarchies, Ph.D. thesis, 2011, the`se de doctorat dirige´e par Poncelet, Pascal et Poncelet, Pascal Informatique Montpellier 2 2011.
- K.-P. Chan, A. Fu, “Efficient time series matching by wavelets,” 126–133, 1999, doi:10.1109/ICDE.1999.754915.
- E. Stollnitz, T. Derose, D. Salesin, Wavelets for computer graphics – theory and applications, 1996.
- P. Rathika, G. Sreeja, “Wavelet Based Histogram Technique for Tumour Detection in Digital Mammograms,” 2012.
- J. Vitter, M. Wang, B. Iyer, “Data Cube Approximation and Histograms via Wavelets (Extended Abstract),” 1998.
- Y. Matias, J. Vitter, M. Wang, “Dynamic Maintenance of Wavelet-Based Histograms,” 2000.
- A. Gilbert, S. Guha, P. Indyk, Y. Kotidis, S. Muthukrishnan, M. Strauss, “Fast, Small-Space Algorithms for Approximate Histogram Maintenance,” Conference Proceedings of the Annual ACM Symposium on Theory of Computing, 2001, doi:10.1145/509907.509966.
- G. Cormode, M. Garofalakis, D. Sacharidis, “Fast Approximate Wavelet Tracking on Streams,” volume 3896, 4–22, 2006, doi:10.1007/11687238 4.
- A. Gilbert, Y. Kotidis, S. Muthukrishnan, M. Strauss, “Surfing Wavelets on Streams: One-Pass Summaries for Approximate Aggregate Queries,” 2001.
- N. Singh, “Emerging Trends in Technologies for Big Data,” The International Technology Management Review, 5, 202, 2015, doi:10.2991/itmr.2015.5.4.4.
- S. Ahsaan, H. Kaur, S. Naaz, Real-Time Data Processing Topology, 2020.
- F. Gurcan, M. Berigel, “Real-Time Processing of Big Data Streams: Life- cycle, Tools, Tasks, and Challenges,” 1–6, 2018, doi:10.1109/ISMSIT.2018. 8567061.
- H. Isah, F. Zulkernine, “A Scalable and Robust Framework for Data Stream Ingestion,” 2018.
- C. Lavergne, “Statistique et analyse des donne´es,” 2021.
- J. Kreps, “Kafka : a Distributed Messaging System for Log Processing,” 2011. [50] D. Vohra, Apache Flume, 287–300, 2016, doi:10.1007/978-1-4842-2199-0 6.
- R. Young, S. Fallon, P. Jacob, “An Architecture for Intelligent Data Processing on IoT Edge Devices,” 2017, doi:10.1109/UKSim.2017.19.
- F. Khan, “Apache kafka with real-time data streaming,” 2021.
- S. Rooney, P. Urbanetz, C. Giblin, D. Bauer, F. Froese, L. Garce´s-Erice, Tomic, “Kafka: the Database Inverted, but Not Garbled or Compromised,” 3874–3880, 2019, doi: 10.1109/BigData47090.2019.9005583.
- S. Rooney, P. Urbanetz, C. Giblin, D. Bauer, F. Froese, L. Garce´s-Erice, Tomic, “Debezium stream changes from your database,” 2019, doi: https://debezium.io/doc.
- F. Lopez, E. Cruz, “Literature review about Neo4j graph database as a feasible alternative for replacing RDBMS,” Industrial Data, 18, 135, 2015, doi: 10.15381/idata.v18i2.12106.
- R. D. e. D. G. Hojjat Jafarpour, “KSQL: Streaming SQL Engine for Apache Kafka,” in Proceedings of the 22nd International Conference on Extending Database Technology (EDBT) ISBN, 18, 2019, doi: 978-3-89318-081-3onOpenProceedings.org.
- B. M. West, “Integrating IBM Streams with Apache NiFi – Streams- dev,” https://developer.ibm.com/streamsdev/docs/integrating-ibm-streams- apache-nifi/, 2018.
- D. Baev, “Managing Data in Motion with the Connected Data Architecture,” in 4th Big Data & Business Analytics Symposium, 2, 2017.
- J. P. Young Roger, Fallon Sheila, “An Architecture for Intelligent Data Pro- cessing on IoT Edge Devices,” 10.1109/UKSim.2017.19., 2, 2017.
- P. H. et Mohamed Rilwan, “Big Data Ingestion: Flume, Kafka and NiFi,” Big Data, Software Architect, 2, 2017, doi:https://tsicilian.wordpress.com/2017/ 07/06/big-data-ingestion-flume-kafka-and-nifi/.
- J. Hiba, H. Hadi, A. Hameed Shnain, S. Hadishaheed, A. Haji, “BIG DATA AND FIVE V’S CHARACTERISTICS,” 2393–2835, 2015.
- M. Goudarzi, “Heterogeneous Architectures for Big Data Batch Processing in MapReduce Paradigm,” in IEEE Transactions on Big Data, 65, 18–33, 2019, doi:10.1109/TBDATA.2017.2736557.
- N. S. e. G. M. Nasiri H., “Evaluation of distributed stream processing frameworks for IoT applications in Smart Cities,” J Big Data, 6, 52, 2019, doi: 10.31618/ESU.2413-9335.2018.2.56.52-58.
- S. E. e. S. H. Paris Carbone, “Apache Flink: Stream and Batch Processing in a Single Engine,” Bulletin of the IEEE Computer Society Technical Committee Engineering, 6, 52, 2015.
- Yanfei, J. Rao, C. Jiang, X. Zhou, “Moving MapReduce into the Cloud with Flexible Slot Management and Speculative Execution,” IEEE Transactions on Parallel and Distributed Systems, 28, 1–1, 2016, doi: 10.1109/TPDS.2016.2587641.
- A. S. e. S. M. Toshifa, “Big Data Hadoop Tools and Technologies: A Review,” International Conference on Advancements in Computing & Management (ICACM-2019), 2019.
- M. Dayalan, “MapReduce: Simplified Data Processing on Large Cluster,” International Journal of Research and Engineering, 5, 399–403, 2018, doi: 10.21276/ijre.2018.5.5.4.
- N. S. I. e. a. Koo J., Faseeh Qureshi, “IoT-enabled directed acyclic graph in spark cluster,” J Cloud Comp, 9, 50, 2020, doi:https://doi.org/10.1186/ s13677-020-00195-6.
- R. W. P. D. T. A. e. a. Zaharia, Matei Xin, “Apache spark: A unified engine for big data processing,” Communications of the ACM, 59, 56–65, 2016, doi:10.1145/2934664.
- A. B. et V. Voityshyn, “Apache storm based on topology for real-time processing of streaming data from social networks,” Lviv I. EEE First International Conference on Data Stream Mining & Processing (DSMP), 345–349, 2016, doi:10.1109/DSMP.2016.7583573.
- L. H. S. S. S. I. Zaharia M, Das T, “Discretized streams: an efficient and fault-tolerant model for stream processing on large clusters.” HotCloud 12:10, 2012.
- Y. P. N. R. J. B. I. G. Shadi A. Noghabi, Kartik Paramasivam, R. H. Campbell, “Samza: Stateful Scalable Stream Processing at LinkedIn,” Proceedings of the VLDB Endowment, 10 No. 12, 345–349, 2017, doi: Copyright2017VLDBEndowment2150-8097/17/08.
- A. Toshniwal, “Storm @Twitter,” SIGMOD’14, June 22–27, 2014, Snowbird, Utah, USA.Copyright, 10 No. 12, 345– 349, 2014, doi:2014ACM978-1-4503-2376-5/14/06… $15.00. doi. 10.1145/2588555.2595641.
- T. S. Singh MP, Hoque MA, “A survey of systems for massive stream analytics,” arXiv preprint, 2016, doi:arXiv:1605.09021.
- S. S. G. B. G. R. Hirzel M, Soule´ R, “A catalog of stream processing optimizations,” CM Comput Surv CSUR, 46(4), 46–50, 2014, doi: Returntoref28inarticle.
- W. P. D. T. A. M. D. A. M. X. R. J. V. S. F. M. e. a. Zaharia M, Xin RS, “Apache spark: a unified engine for big data processing,” Commun ACM, 59(11), 2016, doi: arXiv:1605.09021.
- O. AC., “Storm or spark: choose your real-time weapon.” 2018, doi: http://www.infoworld.com/article/2854894/application-development/ spark-and-storm-for-real-time-computation.html.
- S. D. e. S. D. Lekha R.Nair, “Applying spark-based machine learning model on streaming big data for health status prediction,” Computers & Electrical Engineering, 65, 393–399, 2018, doi:http://www.infoworld.com/article/2854894/ application-development/spark-and-storm-for-real-time-computation.html.
- S. S. G. V. A. M. e. C. C. B. Saha, H. Shah, “Apache tez: A unifying frame- work formodeling and building data processing applications,” ACM SIGMOD, 2015.
- V. B. T. B. C. C. A. C. J. E. M. G. D. H. M. J. e. a. M. Kornacker, A. Behm, “Impala: A modern, open-source sql engine for hadoop,” CIDR, 2015.
- D. S. A. B. H.-I. H. R. R. e. a. D. J. DeWitt, S. Ghandeharizadeh, “The gamma databasemachine project,” IEEE TKDE, 1990.
- F. M. K. V. K. C.-M. S. P. J. R. K. T. S. Kulkarni S, Bhagat N, “witter heron: stream processing at scale,” In: Proceedings of the 2015 ACM SIGMOD international conference on management of data, 239–50, 2015.
- R. Kejariwal A, Kulkarni S, “KReal time analytics: algorithms and systems,” ow., 8(12), 2040–1, 2015.
- Z. P., “Comparison of apache stream processing frameworks,” Cakesolutions, 8(12), 2040–1, 2018, doi:http://www.cakesolutions.net/teamblogs/ comparison-of-apache-streamprocessing-frameworks-part-1.
- N. I. e. K. T. Xiufeng Liu, “Survey of real-time processing systems for big data,” IDEAS ’14 – ACM 18th International Database Engineering & Appli- cations Symposium, 8(12), 2040–1, 2014, doi:10.1145/2628194.2628251.
- A. Lakshman, P. Malik, “Cassandra — A Decentralized Structured Storage System,” Operating Systems Review, 44, 35–40, 2010, doi:10.1145/1773912. 1773922.
- O. M. E. P. Henrique Zanu´z, Bruno Raffin, “In-Transit Molecular Dynamics Analysiswith Apache Flink,” In Situ Infrastructures for Enabling Extreme-scale Analysis and Visualization, DALLAS, United States, 1–8, 2018, doi: ISAV2018.
- N. J. Z. S. P. C. S. A. H. L. P. W. Ashish Thusoo, Joydeep Sen Sarma, R. Murthy, “Hive – A Warehousing Solution Over a Map-Reduce Framework,” VLDB‘09 Lyon, France, 239–50, 2009.
- Jesu´s Camacho-Rodr´?guez, “Apache Hive: From MapReduce toEnterprise-grade Big Data Warehousing,” SIGMOD ’19 Amsterdam, Netherlands, 239–50, 2019.
- M. M. N. Dr MD NADEEM AHMED, AASIF AFTAB, “A Technological Survey On Apache Spark And Hadoop Technologies.” INTERNATIONAL JOURNAL OF SCIENTIFIC &TECHNOLOGY RESEARCH, 9 ISSUE 01, 239–50, 2020.
- G. L. G. Pal, K. Atkinson, “Near Real-Time Big Data Stream Processing,” 4th International Conference for Convergence in Technology (I2CT), Mangalore, India, 9 ISSUE 01, 1–7, 2018, doi:10.1109/I2CT42659.2018.9058101.
- K. K. Wahid A., “Cassandra—A Distributed Database System: An Overview.” In: Abraham A., Dutta P., Mandal J., Bhattacharya A., Dutta S. (eds) Emerging Technologies in Data Mining and Information Security. Advances in Intelligent Systems and Computing, 755, 1–7, 2019, doi:Springer,Singapore.https:
//doi.org/10.1007/978-981-13-1951-8 47. - S. T. Krishnan Hema, Elayidom M.Sudheep, “MongoDB – a comparison with NoSQL databases,” International Journal of Scientific and Engineering Research, 7, 1035–1037, 2016.
- C. e. L. M. Nadeem Qaisar, Mehmood et Rosario, “Modeling temporal as- a for MongoDB NoSQL database,” Journal of Big Data, 9
239–50, 2017. - D. Vohra, Apache Flume, 287–300, 2016, doi:10.1007/978-1-4842-2199-0 6.
- S. D. e. M. L. S.K. Goyal, “Effective handling of patient health records using NoSQL: MONGOD,” Research Journal of Pharmaceutical, Biological and Chemical Sciences, 7(4), 134–138, 2016.
- P. S. et Stirman K., “Schema design for time series data in mongodb,” http://blog.mongodb.org, 30, 134–138, 2013.
- N. Team, “Neo4j Streams,” https://neo4j.com/press-releases/neo4j-streams- kafta-confluent/, 30, 134–138, 2020.
- N. Team, “Neo4j Streams,” https://neo4j.com/press-releases/neo4j-streams- kafta-confluent/, 30, 134–138, 2020.
- M. S. et Narendra Singh Yadav, “A Practical Approach to Process Streaming Data using Graph Database,” international Journal of Computer Applications, 117(23), 28–32, 2015, doi:10.5120/20695-3588.
- Redis, “A Practical Approach to Process Streaming Data using Graph Database,” Site web de Redis, 2020, doi:https://redis.io/.
- A. Quinton, “Storm Real-time Processing Cookbook Efficiently process unbounded streams of data in real-time,” Packt Publishing, 2013, doi: https://redis.io/.
- G. Shilpi, Saxena et Saurabh, “Practical Real-Time Data Processing and Analytics, Distributed Computing and Event Processing using Apache Spark, Flink, Storm, and Kafka,” Packt Publishing, 2017, doi: https://redis.io/.
- G. Shilpi, Saxena et Saurabh, “Big Data Analysis: Apache Storm Perspective,” International Journal of Computer Trends and Technology, 19(1), 9–14, 2015, doi:10.14445/22312803/IJCTT-V19P103.
- L. W. G. P. M. I. R. H. D. Fa¨rber Franz, May Norman, “The SAP HANA database – An architecture overview,” IEEE Data Eng. Bull, 35, 28–33, 2012.
- A. K. U. Amrapali Bansal, “Microsoft Power BI,” International Journal of Soft Computing and Engineering (IJSCE) ISSN, 7, 2231–2307, 2017.
- S. Thabet, “Concepts and Tools for Marketing Intelligence Development,” International Journal of Innovation in the Digital Economy, 4, 15–3, 2013, doi:10.4018/jide.2013070102.
- F. Franz, “SAP HANA database: Data management for modern business applications,” SIGMOD Record, 40, 45–51, 2011, doi:10.1145/2094114. 2094126.
- M. F. e. M. F. K. D. K. D. Fischer Fabian, Fischeruni Fabian, “Real-Time Visual Analytics for Event Data Streams,” Proceedings of the ACM Symposium on Applied Computing, 2011, doi:10.1145/2245276.2245432.