Predicting School Children Academic Performance Using Machine Learning Techniques
 , Stephanny VicunaPolo 2, Diala Abu Al-Halawa 3, Sameh Hallaq 4, Ziad Abdeen 3
Adv. Sci. Technol. Eng. Syst. J. 6(5), 08–15 (2021);
 DOI: 10.25046/aj060502
The study aims to assess the machine learning techniques in predicting students’ associated factors that affect their academic performance. The study sample consisted of 5084 middle and high school students between the ages of 10 and 17, attending public and UNRWA schools in the West Bank. The ‘Health Behaviors School Children’ questionnaire for the 2013-2014 academic year was used for data collection, and was then analyzed through machine learning techniques in order to evaluate their relationship with student academic outcomes. Six machine learning techniques (Random Forest, Neural Network, Support Vector Machine, Decision Tree, Naïve Bayes, and Logistic Regression) were used for prediction. The results indicated that the logistic regression and Naïve Bayes models had the highest accuracy levels (94.3%, 94%) respectively, followed by a decision tree, Neural Network, Random Forest, and Support Vector Machine (93.3%,91.9%,91.7%, and 80.2%) respectively. Thus, the Logistic Regression and Naïve Bayes had the best performance in classifying and predicting student academic performance with the associated factors. Furthermore, Decision Tree, Random Forest, and Neural Network had better predictive performance than Support Vector Machine. The results indicated that perception, Smoking, Depression, PTSD, Healthy Food Consumption, Age, gender, Grade Level, and Family income are the most important and significant factors that influence student academic performance. Overall, machine learning techniques prove efficient tools for identifying and predicting the features that influence student academic performance. The deployment of machine learning techniques within schools’ information systems will facilitate the development of health prevention and intervention programs that will enhance students’ academic performance.
1. Introduction
The prediction of students’ academic performance is of great concern to educational institutions, governments, parents, and other stakeholders as it would enhance the development of curriculum, teaching methodologies, and planned interventions [1]. Several studies have evidenced that given the multi-causal nature of the concept of academic performance, a wide range of variables, from socio-economic to nutritional, health, and environmental, are directly correlated with it at all levels of education [2]. Good health, nutrition, and physical activity, for instance, are proven to enhance students’ cognitive functions and therefore achieve better academic outcomes[3] [4].
Although the correlation between lifestyle habits and academic performance has been established [5], few studies have investigated the uses of Data Mining, namely Machine Learning Techniques among educational environments [6]-[10].
DM is used in various fields of research as it analyzes and extracts useful information and hidden patterns from large data sets. The implications of DM, particularly ML techniques, in education are to provide new knowledge to help educational practitioners make predictions, informed decisions, as well as boost the shift of educational institutions from a traditional learning model towards automation[10]. Furthermore, ML techniques such as Clustering, Neural Networks (NNs), Decision Trees (DT), Random Forest (RTs), Support Vector Machine (SVMs), Logistic Regression (LRs), Naïve Bayes among others, have proven effective in predicting multicausal concepts such as academic performance [11]-[13].
2. Literature Review
2.1. Academic Performance-Associated Risk Factors
Abundant literature exists regarding Machine Learning and educational outcomes, although studies have found that certain variables do indeed significantly impact academic performance, there is no consistent agreement on a specific set of predictors or risk factors [14]. Nonetheless, some of the common variables yielding correlations include gender, parents occupation, family income, parents education, ethnicity, family size, mental health, post-traumatic stress disorder (PTSD), lifestyle habits, physical activity, and nutrition [3], [15].
In [16], the author demonstrates three key variable categories for improved academic performance: 1) Health behaviors, 2) Nutrition and Cognition, and 3) Obesity. The authors describe health behaviors as being influenced by risk associated factors such as physical activity, aerobic fitness, body mass, and energy consumption [13], [14]. Furthermore, relevant nutrition-associated risk factors, such as protein-energy consumption, breakfast consumption [19], short-term fasting, and sugar intake are among the key variables substantially influencing the development of brain functions.
In [10], the study provides a framework for researchers to use DM and ML models for the prediction of student academic performance. The guidelines consist of six stages: 1) data collection, 2) data initial preparation, 3) statistical analysis, 4) data preprocessing, 5) data mining implementation, and 6) result evaluation. The study has also found that early student performance prediction is not a widely studied area, yet it possesses the potential in aiding universities provide timely actions to improve students’ academic outcomes. The study concluded that the most essential factors in predicting academic success are “prior-academic achievement, student demographics, e-learning activity, and psychosocial attributes” [10].
In [20], the authors aimed to predict middle and high-school students’ academic achievement with a focus in Science and Arts classes by making use of the Chi-squared Automatic Interaction Detection (CHAID) model. The results yielded that students’ performance in arts and science is strongly correlated to psychosocial features such as PTSD, self-reported health perception, age, and instances of depression [21]. However, variables such as good nutrition [15], family support, and gender weighed more on students’ science performance. The study found that data mining, namely machine learning, possesses great potential for discovering hidden information that would otherwise be difficult by using conventional analysis [20].
2.2. Machine Learning Techniques
Distinct studies have approached the analysis and prediction of academic achievement through a variety of methods. In [1], the authors review the ML techniques applied to the prediction of students’ academic achievement through a study of published research, concluding the following:
- Most literature (around 70% of articles in their review) seeks to study student performance at the university level.
- The most widely used technique for predicting students’ behavior is supervised learning.
- Support Vector Machine, DT, Naïves Bayes, and Random Forests are well-studied algorithmic proposals generating positive results.
- Neural Networks as less used, yet predict students’ performance more accurately.
- Unsupervised learning has low accuracy in predicting students’ behavior based on studies reviewed.
In [12], the authors seek to predict higher education student performance using the Random Forest Classification algorithm on a study of the UCI student performance dataset consisting of 8000 data. The study concludes that the RF algorithm predicts results that are 15% more accurate than the SVM algorithm.
The study in [22] analyzed the methodologies for the prediction of academic performance and the main variables impacting student outcomes. The study found that most experimental datasets focused on undergraduate Science, Technology, Engineering, and Mathematics (STEM) courses from a single educational entity. The majority of datasets were relatively small with a sample size of fewer than 1000 students. Furthermore, the prediction models were commonly developed as stand-alone modules instead of an ensemble technique despite it having better accuracy rates. Most ML techniques used are supervised through regression, neural networks, and tree-based models. Finally, the study concludes that the most effective predictive models are the Hybrid Random Forest, Feedforward 3-L Neural Network, and Naïve Bayes [22].
Seeking to introduce a prediction model for academic performance, the authors in [13] used supervised machine learning techniques like SVM and Logistic Regression. The results show that the Support Vector Machine algorithm yields more accurate results than logistic regression.
In [14], the authors employed a multi-dimensional methodological approach to predict first-year student academic performance at Babcock University with a sample size of 7,500 data. The study used classification algorithms such as Random Forest, Random Tree, REPtree, J48, OneR, Decision stump, JRip, ZeroR, Decision Table, PART, and Artificial Neural Networks. The study developed a Recommender System (RS) to enhance academic performance prediction. The results found that Random Forest, Reptree, J48, JRip, PART, Decision Table, and Artificial Neural Networks outperformed other classifiers with an accuracy rate of 96.78% (the lowest). Nonetheless, Random Tree, with an accuracy rate of 99.908%, proved ideal for this study’s objectives [14].
In [9], the authors propose a prediction model for student performance based on a Decision Tree algorithm and through the application of an ensemble method on a UCI dataset for students in the Alentejo region of Portugal. The study used three supervised algorithms, J48, NN, and MLP. The results show that J48, with an accuracy rate of 96.78%, yields the most accurate results.
Thus, several studies have investigated academic performance from distinct perspectives, including teaching and educational factors, physical health, and educational environment [4], [5], [16]. The literature concludes that early prediction of risk factors affecting academic performance is essential in aiding struggling students in self-regulating the factors that can impact their cognitive development [3], [16], [19]. Nonetheless, in this study, we seek to assess machine learning models to predict students’ academic status based on three levels of health factors (physical, mental, and social).
3. Research Methodology
In this research, we have used machine learning techniques for the classification and prediction of the influence of health factors on students’ academic performance. Five machine learning models were utilized for data analysis. The methodology follows the guidelines outlined in [10] through data collection, data initial preparation, data analysis, data preprocessing, machine learning implementation of the models studied, and finally results evaluation through a confusion matrix and other visualization tools.
3.1. Data Collection
The data used for this research was collected from the National Health and School Behavior study conducted by Al-Quds University and the Ministry of Education (MoE) in the year 2013-2014. The data contains student’s health, health behavior, and academic performance indicators. The survey was administered via the ‘self-reporting’ method of data collection while supervised by appointed school social workers. The research considers features that relate to the social, physical, and mental health of Palestinian children in school grades 5-9 (10-17 years). A representative sample of 5084 students was used in this study. The data includes associated risk factors variables related to mental health, physical health, social health, nutrition, and academic performance. The associated risk factors variables are listed in Table 1 below.
Table 1: Machine Learning Models’ variables
| Variable Name | Description | Value |
| Gender | Gender | Boys, Girls |
| Age | Age | Age (11-16 Years) |
| FAS | Economic Status | Low, Medium, High |
| ST | School Type | Public or Refugee |
| LP | Living Place | Urban or non-Urban) |
| FatherEdu | Father Education | ≤ Secondary or > Secondary |
| MotherEdu | Mother Education | ≤ Secondary or > Secondary |
| Healthy | Healthy Food Consumption | Low or High |
| Unhealthy | Unhealthy Food Consumption | Low or High |
| BMI | Body Mass Index | Normal, Overweight, or Obese |
| Anemia | Anemia hemoglobin blood test | Non-Anemic (+12g/dl), Anemic (<12 g/dl) |
| Smoking | Tobacco Risk | Yes, No |
| PA | Physical Activity | Low Active or Active |
| LA | Leisure Time Activity | Low Active or Active |
| FS | Family Support | Low, Medium, High |
| PS | Peer Support | Low, Medium, High |
| SS | School Support | Low, Medium, High |
| PTSD | Posttraumatic stress symptoms | Low, Moderate, Severe |
| Depression | Depression Symptoms | Low, Moderate, Severe |
| Psychosomatic_Symp | Psychosomatic symptoms | Low, Moderate, Severe |
| Positive_Health | Positive health perceptions | Low, Medium, High |
| Life_Satisfaction | Life Satisfaction | Low, Medium, High |
| Average_Score | Student Total Average Grades | Excellent/Very Good, Good, Weak/Fail |
Socio-demographic variables: Include variables such as age, living place, gender, family income, parent’s education, and school type.
Physical activity: Physical activity was measured in a two-scale system, the activity scale and the leisure scale. The activity scale was composed of three question items:
- In the last week, how many days were you physically active for more than 60 minutes
- Number of hours playing sports outside school
- Number of hours exercising per week
The leisure time scale similarly comprised three question items:
- Number of hours watching TV
- Number of hours playing video games
- Number of hours using the internet
All six items considered only weekdays (5 days a week). Respondents’ answers were analyzed in quartiles for both scales. Physically active students were identified as those in the upper quartiles, and likewise, low and non-active students were identified as those in the upper quartile of the leisure scale.
Nutrition: Nutrition data were collected though and in-person self-reported 24h-food recall of one-day food intake, as well as through a food frequency questionnaire (FFQ). The food items were scaled by classifying them into 8 food categories (vegetables, fruits, dairy products, sweets, soft drinks, sweet beverages, and energy drinks) [23]. Response choices ranged from (1) never, (2) 1-2 times a week, (3) 3-4 times a week, to (4) 5-7 times a week (almost daily).
Furthermore, respondents were grouped into two classes based on consumption habits, healthy and unhealthy consumers. Respondents were classified into the healthy group if they formed part of the upper 2 quartiles and indicated they didn’t consume unhealthy foods. Respondents were identified as unhealthy if they had indicated that they did not consume any of the healthy food groups, or if they were in the upper 2 quartiles on the unhealthy foods consumption frequency.
Anemia: Anemia was measured through the collection of blood samples for the assessment of hemoglobin levels. An instantly calibrated finger-prick was used for the collection of blood samples. Respondents with anemia were identified as those with a hemoglobin levels below 12 g dl–1 for children younger than 14 years old, and those with levels below 13 g dl–1 for respondents over 14 years of age.
Social Support: Social support was measured through three variables: 1) family support, 2) school support, and 3) peer support. Each variables asked to what extent respondents felt they were able to talk to their family, teachers, and peers.
Positive health perception: Self-reported health perception was measured through six question items:
- I like the way things are going for me
- my life is going well
- I have a good life
- I feel good about what is happening to me
- I would like to change many things in my life
- I wish I had a different kind of life—often or almost always.
Life satisfaction. The life satisfaction variable was measured through a 1-item scale based on the evaluative aspects of subjective well-being gathered from psychological research. The scale ranges from 0 to 10, where 0 represents the worst possible life, and 10 the best possible life satisfaction.
Posttraumatic stress disorder symptoms (PTSD)— PTSD symptoms were measured through 20- question items where respondents had to select their degree of association with the givens statement on a scale from 0 (not at all) to 4 (very much).
Academic performance: Respondents grades were obtained from prior school records, the average grades obtained in six courses (Arabic language, English language, Religion, Social studies, Science, and Mathematics) were collected and included in the total average estimation. Academic performance was considered by categorizing the average total score into Excellent/Very Good, Good, Weak/Fail.
3.2. Data Preparation
The raw data variables were selected, and cleaned the data prior to analysis. This step was taken to ensure the elimination of data redundancy, removed missing values, and derived new variables when applicable. The initial dataset consisted of 5084 student records. The key features in the dataset are balanced, whereas the gender variable is unbalanced.
3.3. Data Pre-Processing
The data has passed through a preprocessing phase before being ran in the machine learning algorithms. The data preprocessing includes techniques for organizing the data for machine learning models, such as data transformation, coding the categorical data, and feature selection, among others. The majority of the studied variables are composed of multiple questions, and thus need to be merged into a single variable with a preserved distance between the values. Preprocessing computes the variables from the scale of variables and converts them into meaningful numerical values. Common distance values were used depending on variable category levels: The three levels set as variable categories are 1) Low =0, 2) Moderate =1, and 3) High =2, and the two levels are set as 1) No =0, and 2) yes=1. The machine learning models are then used to analyze the students’ academic achievement, as well as to predict the associated risk factors. The cross-validation technique that repetitively splits data into training and testing sets was used to overcome the problem of over fitting.
3.4. Statistical Analysis and Machine Learning Implementation
Six ML predictive models were built and compared to each other depending on their prediction accuracy from the given dataset. The ML algorithms used are described in the table below (Table 2).
Table 2: Description of Machine Learning Techniques
| ML algorithm | Description |
| Artificial Neural Network (ANN or NN) | The Neural Networks algorithm is a computational model built up of many small aggregators that are clustered into groups, or layers that feed-forward from the input data to an output prediction [24]. Thus, the NN algorithm maps the predictor variables to an outcome variable through intermediate hidden layers. |
| Random Forest (RF) | Random Forest is an ensemble model that comprises decision trees, and then outputs the plurality of votes from the trees [25]. Each tree is exposed to a data subset and independently evaluates the features available to arrive in a conclusion [24]. RFs must be trained and are sensitive to the training data. |
| Support Vector Machine (SVM) | The SVM classifies linear and non-linear data; the model starts with a small number of the most similar cases across classes “support vectors”, and the remaining cases are then classified based on their fall in the side of the support vectors [26]. |
| Logistic Regression (LR) | Logistic regression is a statistical technique for classifying records based on values of input fields. LR is similar to linear regression, but it helps to find the probability that a certain item belongs in a specific class, thus the outcome lies between 0 and 1 [26]. |
| Decision Tree (DT) | Decision trees are structures with multiple levels and a hierarchy of observations about an object in order to predict its class [24]. The tree “leaves” represent the classes the object could belong to and its “branches” reference the features that could lead the object to a certain class. DTs are used to predict and classify certain objects [27]. |
| Naïve Bayes Classification | NB is analyzes training sets across the set of features and finds the probabilities of features’ ability to predict the target variable. Naïve Bayes gives the probability of an event based on prior knowledge conditions without assuming that features are related even though they could be interdependent [26].
|
The machine learning algorithms were applied to predict the students’ academic performance. The Orange data mining software [28] was used in testing and validating the machine learning models.
3.5. Results evaluation
The study found that Logistic Regression and Naïve Bayes had the highest accuracy rates (94.3% and 94% respectively), and are the most suitable machine-learning algorithms to predict student academic performance. The other algorithms similarly reported high accuracy rates and performed very well in predicting the associated factors related to academic performance. The results have been evaluated through a confusion matrix describing the performance of all machine learning models used (found under section 4.1- Table 4), as well as graphical representations of the data, and importance ranking of variables.
4. Results
A descriptive analysis was performed for describing the data distribution and for understanding the data set before the evaluation of machine learning techniques. The data set is composed of 5084 students with a mean age of 13±1.5, ranging from 10-17 years old. Among these students, approximately 32.8% are boys and 67.2% are girls. Data in figure 1 shows the academic performance levels distributed by grade levels. The study found that the overall distribution of students’ academic performance levels is almost similar in all grades. Results show that 46.7% of students obtained a low-average score, 20.6% obtained a medium-average score, and 32.7% obtained a high-average score.
Results in figure 2 show the average academic performance score by grade and gender. Results indicated that most of the students reported a good average score (70-75) in all grades for both girls and boys. We observed no significant difference found between the average performance score and grade or gender.
Figure 3 demonstrates the comparison between machine learning algorithms’ accuracy rates for the algorithms used in predicting students’ academic performance. Besides LR and NB models, which had the highest accuracy rates, the other ML algorithms had high-performance accuracy while SVM reported the lowest performance accuracy 80.2%. Logistic regression has 94.3% correct instances and 5.7% incorrect instances. For the further representation of prediction accuracy, the instances classification accuracy of the six models is shown in Table 2, while results in Table 4 show the algorithms’ performance features through confusion matrices description.
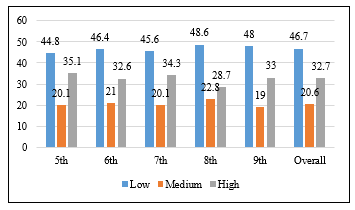 Figure 1: Students’ academic performance by grade
Table 5 describes the details of the algorithms’ performance. The classification results show that the Logistic regression and Naïve Bayes models are the best algorithms for predicting students’ academic achievement. The logistic regression precision and area under curve (AUC) results (99.3% and 94.3% respectively) reflected in Table 4 indicate that most of the tested machine learning algorithms perform effectively in predicting positive values. Furthermore, the support vector machine algorithm reported the lowest acceptable performance, yet its significance is still valid for predicting students’ academic performance.
The logistic regression ROC curve for the three academic performance classes is presented in figures 4.5, and 6. Three numerical categories for respondents’ grades are included: 1) low, 2) medium, and 3) high. The ROC curve resides in the upper-left corner, thus the LR algorithm has a better prediction of positive value with an AUC of 99%. Furthermore, the Mathew Correlation Coefficient has been calculated for the 6 machine learning algorithms as shown in Table 3. Results indicated that the different classifiers had constant and high-performance levels. Most of the models reported MCC values closed to one in the [-1,+1] interval, which means that the machine learning models performed very well in predicting the students’ academic performance.
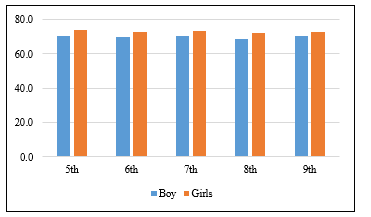 Figure 2: The students’ average academic performance by grade and gender
Table 3: The estimated Mathew correlation Coefficient for the 6 ML models
| Machine Learning Model | Mathew Correlation Coefficient |
| Logistic Regression | 0.93 |
| Naïve Bayes | 0.927 |
| Random Forest | 0.92 |
| Decision Tree | 0.92 |
| Neural Network | 0.915 |
| SVM | 0.78 |
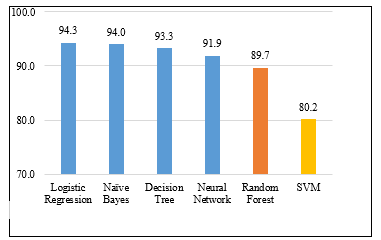 Figure 3: Comparison of Prediction Accuracy Percentage among the 6 ML Models
The machine learning models features importance ranking results are shown in Table 6. The ranking analysis includes Information Gain, Gain ratio, Gini and Chi-Square algorithms. Results in Table 6 indicated that positive health perception, Smoking, Depression, PTSD, Healthy Food Consumption, Age, gender, Grade Level, and Family income are the most important features for predicting students’ academic performance.
Table 3: The confusion matrix that describes the performance of Machine Learning models.
| Random Forest Predicted Value | ||||||||
| Actual Value | L | M | H | ∑ | ||||
| L | 94.2 | 5.5 | 0.5 | 2523 | ||||
| M | 5.3 | 86.5 | 7.3 | 1257 | ||||
| H | 0.5 | 8.0 | 92.3 | 1304 | ||||
| ∑ | 2604 | 1185 | 1295 | 5084 | ||||
| Actual Value | Support Vector Machine Predicted Value | ∑ | ||||||
| L | 88.3 | 21.5 | 0.0 | 2523 | ||||
| M | 11.5 | 60.4 | 16.8 | 1257 | ||||
| H | 0.2 | 18.1 | 83.2 | 1304 | ||||
| ∑ | 2555 | 1237 | 1292 | 5084 | ||||
| Actual Value | Decision Tree Predicted Value | ∑ | ||||||
| L | 94.3 | 4.7 | 0.0 | 2523 | ||||
| M | 5.6 | 90.3 | 6.1 | 1257 | ||||
| H | 0.0 | 5.0 | 93.9 | 1304 | ||||
| ∑ | 2618 | 1139 | 1327 | 5084 | ||||
| Actual Value | Logistic Regression Predicted Value | ∑ | ||||||
| L | 96.5 | 6.4 | 0.0 | 2523 | ||||
| M | 3.5 | 88.8 | 4.6 | 1257 | ||||
| H | 0.0 | 4.8 | 95.4 | 1304 | ||||
| ∑ | 2532 | 1249 | 1303 | 5084 | ||||
| Actual Value | Neural Network Predicted Value | ∑ | ||||||
| L | 95.5 | 8.1 | 0.0 | 2523 | ||||
| M | 4.5 | 83.6 | 7.1 | 1257 | ||||
| H | 0.0 | 8.3 | 92.9 | 1304 | ||||
| ∑ | 2535 | 1259 | 1290 | 5084 | ||||
| Naïve Bayes Predicted Value | ||||||||
| L | 95.8 | 6.1 | 0.0 | 2523 | ||||
| M | 4.2 | 87.9 | 3.4 | 1257 | ||||
| H | 0.1 | 6.0 | 96.6 | 1304 | ||||
| ∑ | 2554 | 1260 | 1270 | 5084 | ||||
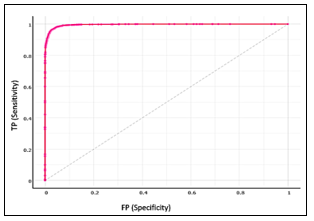 Figure 4: Logistic Regression ROC curve for low academic performance
Table 4: Performance of algorithmic models
| Model | AUC | CA | F1 | Precision | Recall |
| Logistic Regression | 0.993 | 0.943 | 0.943 | 0.943 | 0.943 |
| Naïve Bayes | 0.975 | 0.940 | 0.940 | 0.941 | 0.940 |
| Decision Tree | 0.939 | 0.933 | 0.932 | 0.932 | 0.933 |
| Neural Network | 0.986 | 0.919 | 0.919 | 0.919 | 0.919 |
| Random Forest | 0.970 | 0.897 | 0.895 | 0.895 | 0.897 |
| SVM | 0.938 | 0.802 | 0.802 | 0.801 | 0.802 |
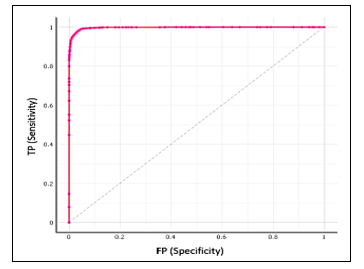 Figure 5: Logistic Regression ROC curve for moderate academic performance
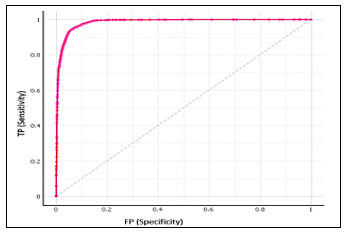 Figure 6. Logistic regression ROC curve for high academic performance
5. Discussion
The study aimed to predict the association between health factors (mental, physical, and social) with student academic performance. With this in mind, the results have identified that healthy students indeed perform better at school.
Twenty-two relevant features were utilized after performing feature selection using machine learning algorithms. These features were employed as input variables, while the average academic score was considered as the target variable. Among the tested models, logistic regression showed the best performance results with sensitivity =94.3%, specificity=96.3%, and AUC=99.3%. Out of the 22 features selected, 11 features are related to academic performance including physical, mental, and social health indicators.
The data has shown that positive health-associated factors are significantly interrelated with students’ physical growth, cognitive development, and academic performance [7]. Furthermore, it has been found that unhealthy factors, such as obesity, depression, anxiety, and PTSD, have a direct negative impact on student’s mental health and cognitive development, these findings were found to be consistent with other related studies [29], [30].
Table 5: Features’ Importance Ranking
| Features Ranking Algorithms | |||||
| Features | Info. gain | Gain ratio | Gini | χ² | Relief |
| PTSD | 0.040 | 0.025 | 0.020 | 43.8 | 0.006 |
| Smoking | 0.025 | 0.038 | 0.012 | 138.4 | 0.026 |
| positive health perception | 0.024 | 0.042 | 0.012 | 139.1 | 0.009 |
| Depression | 0.016 | 0.016 | 0.008 | 49.7 | 0.034 |
| Healthy Food Consumption | 0.010 | 0.010 | 0.005 | 30.6 | 0.029 |
| Family Support | 0.008 | 0.005 | 0.004 | 5.0 | 0.057 |
| Age | 0.006 | 0.003 | 0.003 | 27.9 | 0.011 |
| Gender | 0.006 | 0.006 | 0.003 | 12.9 | 0.010 |
| Grade Level | 0.004 | 0.002 | 0.002 | 16.8 | 0.013 |
| Psychosomatic Symptom | 0.004 | 0.002 | 0.002 | 5.7 | 0.015 |
| Family Income | 0.003 | 0.002 | 0.001 | 10.7 | 0.065 |
| Mother Education | 0.002 | 0.002 | 0.001 | 5.7 | 0.007 |
| School Support | 0.002 | 0.001 | 0.001 | 8.3 | 0.030 |
| Residency | 0.002 | 0.001 | 0.001 | 7.4 | 0.039 |
| Unhealthy Consumption | 0.001 | 0.001 | 0.001 | 2.7 | 0.012 |
| Physical Activity | 0.001 | 0.001 | 0.001 | 1.0 | 0.007 |
| Anemia | 0.001 | 0.001 | 0.000 | 5.5 | 0.003 |
| Life Satisfaction | 0.001 | 0.001 | 0.000 | 5.1 | 0.021 |
| Peer Support | 0.001 | 0.000 | 0.000 | 0.8 | 0.014 |
| BMI | 0.000 | 0.001 | 0.000 | 2.5 | 0.014 |
| Leisure Time Activity | 0.000 | 0.000 | 0.000 | 0.6 | 0.040 |
| father Education | 0.000 | 0.000 | 0.000 | 0.5 | 0.013 |
The prediction results indicated that the negative features had more effect on students with low academic performance. Students with low family income, smoking, anemia, depression, and unhealthy food consumption reported a significant association with low academic performance. Parents’ education, life satisfaction, positive health perception, and physical inactivity had less significant effects on low academic performance than other features.
In the present paper, we evidence that several machine learning algorithms were able to predict academic performance associated with risk factors. All tested algorithms were successfully managed to predict the target variable. Nonetheless, we have found that the Logistic Regression and Naïve Bayes algorithms are the most effective in predicting academic performance when health (mental and physical) and social risk factors are considered. These findings strengthen previous findings that discuss the validity of data mining and ML techniques in predicting students’ academic performance. Although the common ML model with highest accuracy in several literature is Naïve Bayes, we have found that when accounting for only key subject areas and excluding commonly high-performance subjects (such as Arts and Physical Education), Logistic Regression is able to provide similar accuracy levels.
6. Conclusion
The study assessed the accuracy and performance of machine learning models in predicting the associated health factors on students’ academic performance. Six ML models were used for this study (Random Forest, Logistic Regression, Neural Network, Support Vector Machine, Naïve Bayes, and Decision Tree). Although all models yielded valid and positive results, the logistic regression model proved to provide the best accuracy rate and performance, closely followed by the Naïve Bayes model. The study’s findings demonstrate that other ML algorithms, such as Random Forest, Decision Tree, and Neural Networks are also able to satisfactorily predict students’ academic performance, while support vector machine yielded the results with the least accuracy.
Furthermore, the obtained results show that the indicators that most affect academic performance include smoking, depression, PTSD, family support, anemia, leisure time, unhealthy food consumption, place of residence, and grade level. On the other hand, gender, physical activity, friends’ support, school support, life satisfaction, mother’s education, and positive health do not significantly influence students’ academic performance.
Therefore, this research concludes that ML algorithms, particularly (yet not exclusively) Logistic Regression and Naïve Bayes, could be integrated into schools’ information systems for the automatic prediction of students’ academic performance based on key variables. In this manner, students, families, and school staff, and administration will be able to tackle issues that might affect students’ performance through the use of the obtained prediction results. Likewise, through the use of accurate machine learning techniques, such as Random Forest, public health professionals, healthcare providers, and decision-makers will be able to predict rising issues, and implement relevant intervention programs to enhance students; health and education
7. Recommendations
Based on the findings presented in this paper, future research will benefit from expanding the study by adding additional associated factors, including cognitive development skills, in-school student behavior, social activities, and digital media activities. Further variables to consider that would enhance the aim of the research are factors related to the school environment and teaching methods, in particular those that are student-centered, motivational, and personalized as we believe they might positively influence academic performance.
Moreover, in a future study, we seek to deploy the above-mentioned machine learning algorithms by integrating them within schools’ information management systems in Palestine to test the effectiveness of ML algorithms in a practical school environment. The results could aid researchers globally in developing frameworks for ML-led, automated school performance indicators.
Abbreviations
Data Mining (DM), Machine Learning (ML), Random Forest (RF), Artificial Neural Networks (ANN or NN), Decision Tree (DT), Support Vector Machine (SVM), Logistic Regression (LR), Naives Bayes (NB), Post-Traumatic Stress Disorder, (PTSD), Chi-squared Automatic Interaction Detection (CHAID), Science, Technology, Engineering and Mathematics (STEM), United Nations Relief and Works Agency (UNRWA), Food Frequency Questionnaire (FFQ), Area Under Curve (AUC), Classification Accuracy (CA), Features (F), Intelligent Recommender System (IRS), Ministry of Education (MoE).
Conflict of Interest
The authors declare no conflict of interest
Acknowledgments
The authors wish to thank the Palestinian Ministry of Education, as well as Al Quds University for allowing us to carry out the study, as well as the children involved and their parents for their cooperation and patience. We further wish to acknowledge all field workers whose hard work made this research possible. The authors further wish to thank the ministry of the education team, mainly Mr. Mohammad Remawi and Ms. Suzan Tutah for their support in data collection. The Sources of Support is German Research Foundation (DFG) under grant number JU 2769/2.
- J.L. Rastrollo-Guerrero, J.A. Gómez-Pulido, A. Durán-Domínguez, “Analyzing and predicting students’ performance by means of machine learning: A review,” Applied Sciences (Switzerland), 10(3), 2020, doi:10.3390/app10031042.
- M.M. Dubuc, M. Aubertin-Leheudre, A.D. Karelis, “Relationship between interference control and working memory with academic performance in high school students: The Adolescent Student Academic Performance longitudinal study (ASAP),” Journal of Adolescence, 80, 204–213, 2020, doi:10.1016/j.adolescence.2020.03.001.
- R. Qasrawi, “Links between nutrition, life style habits and academic acheivment in Palestinian schoolchildren: A cross-sectional study,” Al-Quds Journal for Academic Research, 01(1), 90–102, 2021, doi:10.47874/2021p6.
- E.L. Faught, J.P. Ekwaru, D. Gleddie, K.E. Storey, M. Asbridge, P.J. Veugelers, “The combined impact of diet, physical activity, sleep and screen time on academic achievement: A prospective study of elementary school students in Nova Scotia, Canada,” International Journal of Behavioral Nutrition and Physical Activity, 14(1), 1–13, 2017, doi:10.1186/s12966-017-0476-0.
- B. Asmare, M. Taddele, S. Berihun, F. Wagnew, “Nutritional status and correlation with academic performance among primary school children, northwest Ethiopia,” BMC Research Notes, 11(1), 1–6, 2018, doi:10.1186/s13104-018-3909-1.
- R.R. Halde, A. Deshpande, A. Mahajan, “Psychology assisted prediction of academic performance using machine learning,” in 2016 IEEE International Conference on Recent Trends in Electronics, Information & Communication Technology (RTEICT), 431–435, 2016, doi:10.1109/RTEICT.2016.7807857.
- H.F. Golino, C.M.A. Gomes, D. Andrade, “Predicting Academic Achievement of High-School Students Using Machine Learning,” Psychology, 05(18), 2046–2057, 2014, doi:10.4236/psych.2014.518207.
- V.L. Uskov, J.P. Bakken, A. Byerly, A. Shah, “Machine Learning-based Predictive Analytics of Student Academic Performance in STEM Education,” in 2019 IEEE Global Engineering Education Conference (EDUCON), 1370–1376, 2019, doi:10.1109/EDUCON.2019.8725237.
- M. Imran, S. Latif, D. Mehmood, M.S. Shah, “Student academic performance prediction using supervised learning techniques,” International Journal of Emerging Technologies in Learning, 14(14), 92–104, 2019, doi:10.3991/ijet.v14i14.10310.
- E. Alyahyan, D. Dü?tegör, “Predicting academic success in higher education: literature review and best practices,” International Journal of Educational Technology in Higher Education, 17(1), 2020, doi:10.1186/s41239-020-0177-7.
- A. Blanch, A. Aluja, “A regression tree of the aptitudes, personality, and academic performance relationship,” Personality and Individual Differences, 54(6), 703–708, 2013, doi:10.1016/j.paid.2012.11.032.
- A. Makwe, A.S. Rathore, An Empirical Study of Neural Network Hyperparameters, 2021, doi:10.1007/978-981-15-5788-0_36.
- D.I.F.S. Engr. Sana Bhutto, Dr. Qasim Ali Arain, Maleeha Anwar, “Through Supervised Machine Learning,” Predicting Students’ Academic Performance Through Supervised Machine Learning, 2020.
- M. Goga, S. Kuyoro, N. Goga, “A Recommender for Improving the Student Academic Performance,” Procedia – Social and Behavioral Sciences, 180(May), 1481–1488, 2015, doi:10.1016/j.sbspro.2015.02.296.
- T. Burrows, S. Goldman, K. Pursey, R. Lim, “Is there an association between dietary intake and academic achievement: a systematic review,” Journal of Human Nutrition and Dietetics, 30(2), 117–140, 2017, doi:10.1111/jhn.12407.
- T.M. Burkhalter, C.H. Hillman, “A narrative review of physical activity, nutrition, and obesity to cognition and scholastic performance across the human lifespan,” Advances in Nutrition, 2(2), 201–206, 2011, doi:10.3945/an.111.000331.
- I.K. Desai, A. V. Kurpad, V.R. Chomitz, T. Thomas, “Aerobic fitness, micronutrient status, and academic achievement in Indian school-aged children,” PLoS ONE, 10(3), 1–13, 2015, doi:10.1371/journal.pone.0122487.
- F.M. Asigbee, S.D. Whitney, C.E. Peterson, “The Link Between Nutrition and Physical,” Journal of School Health, 88(6), 407–415, 2018.
- K. Adolphus, C.L. Lawton, L. Dye, “The effects of breakfast on behaviour and academic performance in children and adolescents,” Frontiers in Human Neuroscience, 7(JUL), 1–28, 2013, doi:10.3389/fnhum.2013.00425.
- R. Qasrawi, Z. Abdeen, H. Taweel, M.A. Younis, D.A. Al-Halawa, “Data mining techniques in identifying factors associated with schoolchildren science and arts academic achievement,” in Proceedings – 2020 International Conference on Promising Electronic Technologies, ICPET 2020, 2020, doi:10.1109/ICPET51420.2020.00023.
- P.A. Banerjee, “A systematic review of factors linked to poor academic performance of disadvantaged students in science and maths in schools,” Cogent Education, 3(1), 1–17, 2016, doi:10.1080/2331186X.2016.1178441.
- A. Namoun, A. Alshanqiti, “Predicting student performance using data mining and learning analytics techniques: A systematic literature review,” Applied Sciences (Switzerland), 11(1), 1–28, 2021, doi:10.3390/app11010237.
- G.C. Frank, T.A. Nicklas, L.S. Webber, C. Major, J.F. Miller, G.S. Berenson, “A food frequency questionnaire for adolescents: defining eating patterns.,” Journal of the American Dietetic Association, 92(3), 313–318, 1992.
- H. Phwkrg, R.I. Frppxqlfdwlrq, W.S. Olyhv, “9 – 11 April , 2019 – American University in Dubai , Dubai , UAE 2019 IEEE Global Engineering Education Conference ( EDUCON ) Page 1370 9 – 11 April , 2019 – American University in Dubai , Dubai , UAE 2019 IEEE Global Engineering Education Conference ( ED,” 2019 IEEE Global Engineering Education Conference (EDUCON), 1370–1376, 2019.
- Y.L. Pavlov, “Random forests,” Random Forests, 1–122, 2019, doi:10.1201/9780429469275-8.
- S. Uddin, A. Khan, M.E. Hossain, M.A. Moni, “Comparing different supervised machine learning algorithms for disease prediction,” BMC Medical Informatics and Decision Making, 19(1), 1–16, 2019, doi:10.1186/s12911-019-1004-8.
- P. Geurts, A. Irrthum, L. Wehenkel, “Supervised learning with decision tree-based methods in computational and systems biology,” Molecular BioSystems, 5(12), 1593–1605, 2009, doi:10.1039/b907946g.
- J. Demšar, T. Curk, A. Erjavec, ?. Gorup, T. Ho?evar, M. Milutinovi?, M. Možina, M. Polajnar, M. Toplak, A. Stari?, “Orange: data mining toolbox in Python,” The Journal of Machine Learning Research, 14(1), 2349–2353, 2013.
- C.A.C. Montanez, P. Fergus, A. Hussain, D. Al-Jumeily, B. Abdulaimma, J. Hind, N. Radi, “Machine learning approaches for the prediction of obesity using publicly available genetic profiles,” Proceedings of the International Joint Conference on Neural Networks, 2017-May, 2743–2750, 2017, doi:10.1109/IJCNN.2017.7966194.
- S. Roy, A. Garg, “Predicting academic performance of student using classification techniques,” 2017 4th IEEE Uttar Pradesh Section International Conference on Electrical, Computer and Electronics, UPCON 2017, 2018-Janua, 568–572, 2017, doi:10.1109/UPCON.2017.8251112.