The Internal Reliability of a Questionnaire on the Impact of Enterprise Resource Planning on the Performance of Moroccan Companies

Adv. Sci. Technol. Eng. Syst. J. 6(5), 59–64 (2021);
 DOI: 10.25046/aj060508
Background: Today, Enterprise Resource Planning (ERP) software is a major tool for strengthening competitiveness. They are an asset that is changing work practices through the rapid circulation of information, the coordination of action and the development of new ways of doing things, rapid access to a wide range of knowledge and the opening up of new services. The purpose of our study is to validate a reliable and reasonable questionnaire to measure the impact of ERP on the Performance of Moroccan companies. Material and methods: This is a cross-sectional study that took place between January and April 2020. The study was based on a questionnaire. The statistical validation of the questionnaire is based on the calculation of the Cronbach’s Coefficient Index and a factor analysis. Results: The study involved 41 Moroccan companies, 27 of which have an ERP. The Cronbach’s alpha value of all the items obtained is 0.96. Conclusion: Results showed that questionnaire is a well-structured, objective, valid and reliable in the Moroccan context, the questionnaire could be an instrument to evaluate the impact of ERP on the performance of Moroccan companies
1. Introduction
The company, as an open system, pursues a certain number of objectives that are in the interest of the stakeholders such as: management, shareholders, customers, suppliers, etc. Therefore, it is a place where convergent and contradictory interests are located. To do this, it is led to produce information that responds to the various concerns it raises, hence the emergence of Information Technology (IT).
At a time of globalization, privatization and increased information, the use of New Technologies of Information and Communication (NTIC) has been proven and recognized as an essential investment solution to ensure the evolution and development of companies [1].
From this point, ERP is presented like an IT application that is part of production management, because it contributes to the simplification of certain constraints through computerization of information systems facilitating the exchange and posting of information between employees and different departments of the company.
From this point, ERP is presented like an IT application that is part of production management, because it contributes to the simplification of certain constraints through computerization of information systems facilitating the exchange and posting of information between employees and different departments of the company.
ERP is an evolution of Manufacturing Resource Planning 2 (MRP2) which appeared in the early 1970s in the United States. MRP2 was intended for production planning from industrial and commercial planning to production monitoring.
It is a configurable software built around a single database, capable of covering the majority of the information processing needs of the company’s various functions thanks to a set of compatible modules.
If it is well mastered, an ERP can be a source of important competitive advantage since it will allow an optimal management of all the company’s information and a cross-referencing of data from the different departments that make up the company. On this point, the implementation of ERP in companies develops the control, effectiveness and efficiency of operations and strategic decision-making [2].
In Morocco, the first major ERP projects were initiated as early as 1995. Large companies and public bodies have made use of this technology, such as Office Cherifien of Phosphates (OCP), National Office of Electricity (ONE) and National Office of Drinking Water (ONEP). In the last decade, ERP have shown a significant increase [3]. Companies of all sizes are making investments in ERP implementations in order to anticipate the positive impacts on their organization. Studying the impact of ERP on business performance is becoming an important criterion to justify the associated investments.
In this sense, our objective is to study the internal reliability of a questionnaire that measures the impact of ERP on the performance of Moroccan companies.
2. Materials and methods
This cross-sectional study took place between January and April 2020. The study was mainly based on a questionnaire on the impact of ERP on the performance of Moroccan companies with the aim of validating it. The population studied includes Moroccan companies from different sectors of activity.
The literature review concerning the impact of ERP on business performance us to use a scale of 15 items [4]-[6]. The latter were submitted to the professors of higher education for their scientific advice and to a linguist to judge the comprehensibility of the items because this scale will be intended for an Arab-French speaking population. They are spread over 3 dimensions:
- Economic performance : 7 items
- Organizational performance : 5 items
- Human Performance : 3 items
The items corresponding to each dimension were measured using Likert scales with five degrees:
- The first degree is : Very low
- The second degree is : Low
- The third degree is: Medium
- The fourth degree is: High
- The fifth degree is: Very high
Similarly, we conducted a questionnaire containing questions on statutes, motivations and opinions. Data confidentiality was entrusted to the respondents by the anonymity of the participant.
In our study, the internal reliability of a questionnaire was assessed by measuring the internal consistency of the different scales. Internal consistency, which reflects how items on the same scale are interrelated, was assessed using Cronbach’s alpha coefficient. A Cronbach’s alpha coefficient greater than 0.70 indicated good internal consistency of the scales [7]. Since the number of items constituting a dimension influences the value of Cronbach’s alpha. The standardized Cronbach’s alpha was presented for each scale.
Cronbach’s alpha was also used in the item reduction step [7]. This step allows the questionnaire to be as short as possible while retaining the items that contribute the most to the scales. The Cronbach’s alpha was generated for each scale by considering all but one item. This procedure was carried out for each scale by excluding each item in turn. When the value of Cronbach’s alpha increases with the deletion of an item, this indicates that this item correlates poorly with the other items of its scale. Such an item is then excluded from the questionnaire. Next, exploratory factor analyzes were performed. Statistical analysis were done by the Statistical Package for the Social Sciences (SPSS, version 21) [8]. The data collected were therefore the subject of exploratory analyzes to determine the dimensionality of the scale. Principal Component Factor Analysis (PCF) is the most efficient method for synthesizing information and uncovering the underlying structure of a concept since it is a method for analyzing multi-variate data. Which makes it possible to simultaneously explore the relationships that exist between several variables studied [8].
In our study we used the Kayser Meyer Olkin (KMO) test. A KMO of less than 0.5 is unacceptable, 0.5 is low, more than 0.6 is acceptable, 0.7 is average, 0.8 is meritorious and 0.9 is excellent [9] and Bartlett’s sphericity test to assess the potential effectiveness of the PCR studied. For a factor analysis to be feasible the Bartlett test must be significant (p < 0.05) [10].
3. Results
3.1. Description of the study population
The socio-economic and demographic characteristics of the 41 enterprises that participated in the study are presented in Table 1. Most of the companies that participated in this study are service companies. Only 27 companies surveyed have an ERP and two companies are planning to implement it. The latter can be justified by the high cost of the ERP. (Figure 1)
Table 1: Description of Study Population
| Variables | Number | Percentage |
| Sector of activity | ||
| Agro-alimentaire | 7 | 17% |
| Bank/Insurance | 1 | 2% |
| Commerce/Distribution | 5 | 12% |
| Industry | 9 | 22% |
| Machine and equipment / Automobile | 4 | 10% |
| Service | 15 | 37% |
| Have an ERP | ||
| Yes | 27 | 66% |
| No | 12 | 29% |
| No, but we’re planning to implement | 2 | 5% |
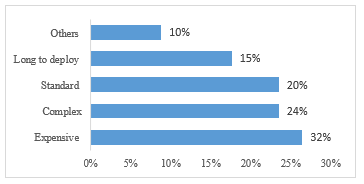 Figure 1: Critics of using ERP
3.2. Validation of the questionnaire
- Internal reliability of items
The reliability of the measurement scale is checked by calculating the Cronbach’s alpha for each dimension and for all items. (Table 2)
The reliability indices of the dimensions used in our study are well above 0.7. They are between 0.87 and 0.95. Cronbach’s alpha is satisfactory, so there is homogeneity and correlation between the different dimensions of the questionnaire, they can be added together to form a scale score.
As for the total scale, the Cronbach’s alpha value of all items was 0.96, which presents a good reliability.
As shows in Table 3, the results of the variables that best explain the impact of ERP on business performance.
After having completed the internal validity study in which we were able to exhaustively determine the variables most influencing the impact of ERP on business performance, we continue our study by processing the matrix of correlations between the 15 selected items.
Table 2: Cronbach alphas of items and dimensions based on the results of SPSS
| Cronbach’s alpha | Items | |
| Sets of items
Economic performance Organizational performance Human Performance |
0.96
0.95 0.94 0.88 |
15
7 5 3 |
Table 3: Internal reliability based on the results of SPSS
| Scale average in case of deletion of an element | Scale variance when deleting an element | Cronbach’s Alpha if the element is deleted | |
| Time saving | 44.47 | 207.263 | .963 |
| Saving Material Resources | 44.95 | 207.164 | .963 |
| Human Resources Economics | 44.95 | 199.608 | .961 |
| Improves customer satisfaction | 44.84 | 203.585 | .963 |
| Improves the quality of services/products | 44.63 | 202.579 | .962 |
| Increases Turnover | 45.05 | 210.719 | .965 |
| Increases Market Share | 45.11 | 211.655 | .966 |
| Facilitates access to information | 44.47 | 208.374 | .964 |
| Improves the reliability of the information communicated | 44.53 | 207.485 | .963 |
| Facilitates control tasks | 44.47 | 207.708 | .962 |
| Improves coordination within the company | 44.58 | 205.924 | .962 |
| Contributes to the decentralization of decisions | 44.84 | 203.807 | .963 |
| Increases staff productivity | 45.16 | 208.807 | .963 |
| Improves staff knowledge and skills | 45.00 | 205.111 | .963 |
| Improves staff satisfaction | 44.95 | 210.275 | .964 |
- Factor analysis
To make a factorial analysis of the questionnaire we took into consideration the value of the KMO index and the Barlett’s test of sphericity.
For our study, the KMO index was 0.7 > 0.5 which shows an acceptable value to do the factor analysis, thus the Bartlett’s sphericity test is highly significant. (Table 4)
To study the factorial structure of the collected data, we opted for Principal Component Analysis (PCA), which was carried out with varimax rotation on all the items of the questionnaire.
Table 4: Cronbach alphas of items and dimensions based on the results of SPSS
| Value | ||
| Indice KMO | 0.737 | |
| Bartlett’s sphericity test | Ci-square approx. | 336.194 |
| Ddl | 105 | |
| Signification | 0.000 | |
- Correlation matrix
We took into account 15 items used to assess the impact of ERP on business performance in order to design the correlation matrix as a quick way to estimate the internal consistency of the items. This will give 105 correlation coefficients.
The average correlation by averaging 105 coefficients is 0.655. More specifically, it turns out that the most important ration is 0.923 and the least important ratio is 0.318 (Table 5)
Table 5: Correlation Matrix based on the results of SPSS
| Time saving | Saving Material Resources | Human Resources Economics | Improves customer satisfaction | Improves the quality of services/ products | Increases Turnover | Increases Market Share | Facilitates access to information | Improves the reliability of the information communicated | Facilitates control tasks | Improves coordination within the company | Contributes to the decentralization of decisions | Increases staff productivity | Improves staff knowledge and skills | Improves staff satisfaction | |
| Time saving | 1.000 | ||||||||||||||
| Saving Material Resources | .763 | 1.000 | |||||||||||||
| Human Resources Economics | .801 | .878 | 1.000 | ||||||||||||
| Improves customer satisfaction | .804 | .618 | .773 | 1.000 | |||||||||||
| Improves the quality of services/products | .758 | .630 | .761 | .923 | 1.000 | ||||||||||
| Increases Turnover | .504 | .447 | .588 | .726 | .757 | 1.000 | |||||||||
| Increases Market Share | .626 | .552 | .613 | .688 | .658 | .873 | 1.000 | ||||||||
| Facilitates access to information | .738 | .800 | .735 | .442 | .554 | .318 | .369 | 1.000 | |||||||
| Improves the reliability of the information communicated | .683 | .653 | .704 | .480 | .635 | .353 | .328 | .907 | 1,000 | ||||||
| Facilitates control tasks | .796 | .739 | .798 | .688 | .745 | .488 | .419 | .838 | ,903 | 1.000 | |||||
| Improves coordination within the company | .592 | .768 | .740 | .552 | .648 | .426 | .362 | .779 | ,832 | .885 | 1.000 | ||||
| Contributes to the decentralization of decisions | .508 | .618 | .715 | .595 | .654 | .530 | .398 | .606 | ,710 | .801 | .816 | 1.000 | |||
| Increases staff productivity | .635 | .737 | .754 | .591 | .633 | .602 | .667 | .716 | ,669 | .721 | .746 | .591 | 1.000 | ||
| Improves staff knowledge and skills | .530 | .492 | .679 | .590 | .673 | .668 | .485 | .565 | ,706 | .802 | .778 | .777 | .731 | 1.000 | |
| Improves staff satisfaction | .423 | .480 | .669 | .598 | .646 | .686 | .519 | .504 | ,586 | .664 | .752 | .740 | .711 | .877 | 1.000 |
3.3. Reasons for implementing an ERP system
Among the reasons for implementing an ERP, the reason to Harmonize their information system is in the lead with 32%, followed by the reason to Improve their performance and make their work easier with 28% (Figure 2).
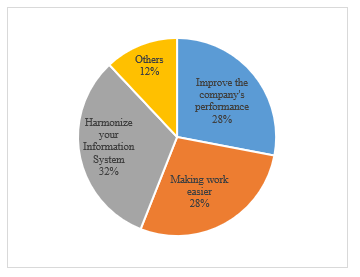 Figure 2: Main reasons for implementing an ERP system
4. Discussion
The objective of this study was to propose a scale that helps managers to measure the impact of ERP on the performance of Moroccan companies, which is reliable and has scientifically valid and satisfactory psychometric qualities, and which helps managers to measure the impact of ERP. Based on Churchill’s paradigm [11]-[13].
The implementation of an ERP can generate benefits related to administrative productivity [14], such as: Optimization of the cost of ownership and elimination of reconciliation, correction and consolidation tasks [15]. For this reason, ERP can be a major tool to improve the overall functioning of the company and strengthen its performance [14]. According to our study 35% of the respondents used ERP to improve their performance.
The literature on performance measurement is broader than the literature on performance management [16]. The economic performance of an entity is measured on the basis of the change in business activity and the return on investments and sales. It can also come from an informed analysis of the income statement [17]. Organizational performance is the way in which the company is organized to achieve its objectives [18]. Human performance is analyzed through the results obtained by the employees, these results are expressed by the wealth created, the added value produced [19].
The implementation of ERP in Moroccan companies is recent, however, few studies that assess their impact on the performance of companies and this is what we notice in the literature and the work already done. Therefore, our work can be considered as the first study carried out on the validation of the internal reliability of a questionnaire on the impact of ERP.
In order to test the internal reliability of a questionnaire, marketing researchers, especially those from other social sciences, are in the habit of comparing the value of the estimated Cronbach’s alpha coefficient to a conventional threshold set at ά ≥ 0.70. Nevertheless, there are authors who have criticized this practice such as Peterson, 1994; Vos, Stem and Fotopoulos, 2000; Duhachek, Coughlan and Iacobucci, 2005 [20]. Indeed, the threshold ά ≥ 0.70 is only an empirical threshold because of the lack of statistical distributions to conclude whether Cronbach’s alpha is acceptable or not [21].
However, thanks to the efforts of several psychometricians, the researchers were able to make statistical inferences about the distribution of Cronbach’s alpha coefficient and its confidence interval [22]-[25].
Overall, the statistical analysis shows that the questionnaire on the impact of ERP on business performance meets several validity criteria. In our study, the internal reliability of the questionnaire was significant with a Cronbach’s index of 0.969.
Although it was considered reasonable, we studied the internal validity in which we found that almost all the items retained their deletion leads to a decrease in Cronbach’s alpha value, except for two items (Increases Sales and Increases Market Share) their deletion has no effect on Cronbach’s alpha value [26], [27].
The correlation matrix shows that all the items are sufficiently correlated (r > 0.4) for us to consider that they measure the same construct, which is the impact of ERP on the company’s performance.
5. Conclusions
In summary, we have demonstrated that the questionnaire on the impact of ERP on business performance has satisfactory reliability. Consistent with our expectation, all three dimensions show statistically significant correlations. Future validation studies will need to examine confidence interval and test-retest reliability.
Abbreviations
ERP: Enterprise Resource Planning;
IT: Information Technology;
KMO: Kayser Meyer Olkin;
MRP: Manufacturing Resource Planning;
NTIC: New Technologies of Information and Communication;
OCP: Office Cherifien of Phosphates;
ONE: National Office of Electricity;
ONEP: National Office of Drinking Water;
PCA: Principal Component Analysis;
PCF: Principal Component Factor
Acknowledgments
I thank all the authors who have contributed to the realization of this work.
- M.E. Porter, V.E. Millar, “Strategic Management for Competitive Advantage How Information Gives You Competitive Advantage,” 1985.
- A. Amzil, “Place Des Erp Dans Le Suivi De La Performance Des Filliales Par La Maison-Mere,” 1–490, 2016.
- N. Belghazi, “La bataille des logiciels «?fait tout?»,” L’Economiste, 1598, 2003.
- L. Gharsallah, Impact de l’ERP sur la performance?: cas d’IGL, Université de Sfax, Tunisia, 2006.
- A. Chaabouni, “Implantation d’un ERP (Enterprise Resource Planning)?: Antécédents et Conséquences,” Conférence Internationale de Management Stratégique, Annecy / Genève 13-16, 1–26, 2006.
- H.R. Gopaul, A Systemic Analysis of Erp Implementation Challenges and Coping Mechanisms, Faculty of Commerce University of Cape Town, 2016.
- Peter M. Fayers and David Machin, Quality of Life – Assessment, Analysis & Interpretation, 2000, doi:10.1002/9780470024522.
- A. Field, Discovering Statistics Using Spss Andy Field.Pdf, Advances in Experimental Medicine and Biology, 622, 153–167, 2008, doi:10.1177/014662168701100107.
- D.W. Stewar, “The Application and Misapplication of Factor Analysis in Marketing Research,” Journal of Marketing Research, 18(1), 51–62, 1981.
- V. Galtier, Proposition d’une échelle de mesure contextualisée de l’apprentissage d’équipe?: Une analyse exploratoire, Université Paris IX Dauphine, 2003.
- G.A. Churchill, “A Paradigm for Developing Better Measures of Marketing Constructs,” Journal of Marketing Research, 16(1), 64, 1979, doi:10.2307/3150876.
- L.R. Fabrigar, R.C. MacCallum, D.T. Wegener, E.J. Strahan, “Evaluating the use of exploratory factor analysis in psychological research,” Psychological Methods, 4(3), 272–299, 1999, doi:10.1037/1082-989X.4.3.272.
- P. Roussel, F. Durrieu, E. Campoy, Méthodes d’équations structurelles?: recherches et applications en gestion, Paris, 2002.
- J.-L. Deixonne, Piloter un projet ERP?: transformer et dynamiser l’entreprise par un système d’information intégré et orienté métier, 2001.
- R. Marciniak, M. Carbonel, Management des projets informatiques?: études de cas, Paris, 1996.
- B. Sogbossi Bocco, “Perception de la notion de performance par les dirigeants de petites entreprises en Afrique,” La Revue Des Sciences de Gestion, 241(1), 117, 2010, doi:10.3917/rsg.241.0117.
- C. Marmuse, Encyclopédie de la gestion, Edition de, Paris, 1996.
- C. Marmuse, Encyclopédie de la gestion, Edition de, Paris, 1997.
- D.C. Bernard Martory, Gestion des ressources humaines Pilotage social et performances, 5eme éditi, 2002.
- S. Moussa, “L ’ alpha de Cronbach et l ’ estimation de son intervalle de confiance?: L ’ étude de deux approches,” in Entrepreneuriat et Entreprise dans la Nouvelle Economie?: Contextes, Financement, Stratégie, Gouvernance et Performance, 11, 2008.
- B.P.Y. Evrard, Market?: études et recherches en marketing?: fondements, méthodes, 2ème, 1998.
- L.S. Feldt, D.J. Woodruff, F.A. Salih, “Statistical Inference for Coefficient Alpha,” Applied Psychological Measurement, 11(1), 93–103, 1987, doi:10.1177/014662168701100107.
- J.J. Barnette, “ScoreRel CI: An excel program for computing confidence intervals for commonly used score reliability coefficients,” Educational and Psychological Measurement, 65(6), 980–983, 2005, doi:10.1177/0013164405278577.
- J.M. Van Zyl, H. Neudecker, D.G. Nel, “On the distribution of the maximum likelihood estimator of Cronbach’s alpha,” Psychometrika, 65(3), 271–280, 2000, doi:10.1007/BF02296146.
- D. Iacobucci, A. Duhachek, “Advancing Alpha: Measuring Reliability with Confidence,” Journal of Consumer Psychology, 13(4), 478–487, 2003, doi:10.1207/S15327663JCP1304_14.
- Jum C. Nunnally, Psychometric Theory, 2nd editio, New- York, 1978.
- N. Malhotra, Études marketing avec spss, 5e édition, Paris, 2007.