Application of Geographic Information Systems and Remote Sensing for Land Use/Cover Change Analysis in the Klip River Catchment, KwaZulu Natal, South Africa
 , Julius Musyoka Ndambuki 1, Wanjala Ramadhan Salim 1, Sophia Sudi Rwanga 2
Adv. Sci. Technol. Eng. Syst. J. 6(5), 65–72 (2021);
 DOI: 10.25046/aj060509
Ladysmith is a major economic hub in the uThukela District Municipality. However, it has been experiencing floods almost every year which has resulted in the loss of lives and disruption of business activity within the Ladysmith Central Business District. The main objective of this study was to quantify the land use/cover changes before and after floods of 1994, 2006, and 2015 using Geographic Information System and remote sensing. Landsat images for the years 1990, 2000, 2010, and 2020 were used to prepare study area maps. The study revealed that the catchment has undergone drastic modifications in land use/cover in the past four decades. The results showed that agriculture, barren land, and built-up increased by 0.09 %, 63.95 %, and 34.19 %, while vegetation and water bodies drastically declined by 45.88 % and 60 % respectively. In conclusion, the Klip river catchment is at high risk of continuous flooding because of the rapid decrease in natural vegetation and water bodies. Therefore, the study recommends that government should give a greater focus on protecting, preserving, and regenerating natural vegetation as well as water bodies. This information will be useful to planners and policymakers in the planning and development of land use management strategies needed to reduce flooding in the study area.
1. Introduction
Identifying changes in land use/cover (LU/C) becomes an essential tool for policy formulation, planning as well as the development of targeted land use management strategy [1]. Land use/cover may be used interchangeably, land cover is defined as the physical characteristics found at the earth’s surface [2], while land use describes the way in which human beings use the land. It occurs in two different forms which are conversion and modification. A change from one land-use class to another is called conversion, while a change in the physical characteristic of the land without a change in the overall classification is called modification [3]. In [4], the author indicated that changes in catchment characteristics may influence the frequency and magnitude of the flood regime, therefore, it is important to assess changes in land use/cover that have occurred each year [1]. There is evidence to prove the effectiveness of the Geographic Information System (GIS) in collecting, capturing, storing, retrieving, manipulating, analysing, and displaying digital data that is required for land use/cover change detection [5 – 7]. On the other hand, remote sensing has proved its potential for providing accurate and up-to-date information [8], whereas GIS is used to detect and monitor changes in land use/cover [9]. Integration of GIS and remote sensing has been proven to be the effective tools to be used to detect changes in land use/cover that have taken place in the catchment [10]. Several studies have previously focused on the changes in land use/cover using GIS and remote sensing. For example, in [11], the author applied GIS and remote sensing to investigate changes that have occurred in the Dedza district in Malawi. The study results showed that between 1991 and 2015, there was a significant decrease in agricultural land, water bodies, forest land, and wetlands while built-up areas and barren land significantly increased. The long-term annual rate of change in water bodies dropped from 5.54% ha-1 to 1.74% ha-1 during the study period. In contrast, the increase in the annual rate of change in forest land, agricultural land as well as built-up area was from 1.71% ha-1 to 1.94% ha-1, 0.02% ha-1 to 0.11% ha-1, and 7.22% ha-1 to 9.80% ha-1 respectively. In [12], the author used remote sensing and GIS to investigate change along the River Kaduna floodplain. Results from their study showed a substantial change in the land use/cover classes in the study area. The study further revealed that there has been a progressive conversion of natural vegetation areas into farmlands and turning into built-up areas in the end. They concluded that the floodplain areas have undergone considerable changes because of human activities, and it has led to disastrous consequences. In [13], the author investigated the changes that happened before and after the floods in District Charsadda, Pakistan using GIS and remote sensing techniques. After assessing the percentage change of different classes, agricultural land, barren land, and water bodies was standing at 68.5%, 22.5 %, and 8.8 % before the flood, while, after the flood, water bodies, barren land, and agricultural land had grown up to 16.4 %, 26.30 %, and 57 %, respectively. The study also pointed out that the settlements along River Kabul were severely damaged by the flood. In [14], the author examined the hydrological effects of land use/cover change in the Harts catchment from 1990 to 2010 using GIS and remote sensing. From the study, it was found that the vegetation cover decreased from 758,345 ha in 1990 to 736,879.4 ha in 2008, while barren land increased by 97,651.49 ha from 226,670 ha to 324,321.49 ha in the same year. The study further pointed out that a decrease in natural vegetation cover has led to an increase in a runoff production and consequently changing flow regimes in the Harts catchment. In [15], the author quantified changes in land use/cover in the Western Cape Province, South Africa. The study used GIS and remote sensing to create land use/cover maps. The results indicated a significant change in the period from 1990 to 2014, with a decrease in grasslands, barren land, forest plantations as well as wetlands, and an increase in mines and quarries, water bodies, built-up areas, woodlands, thicket as well as shrubland classes. The study also found that mines and quarries had the highest increase of 52.82%, followed by plantation which decreased by 32.41%. The study cited the high demand of sand for construction purposes as the cause of the decline in mines and quarries and the government’s exit policy as the cause of a decline in plantations. From the reviewed literature, it appears that land use/cover change analysis was conducted in different parts of the world, including South Africa. As far as the author’s knowledge is concerned, there is still a lack of information on land use/cover change in the Klip river catchment, KwaZulu Natal. Therefore, this study aims to assess the land use/cover change using GIS and remote sensing. Findings from this study will be helpful to planners and policymakers in their planning development of land use management strategies aimed at reducing flooding in the study area.
2. Materials and Methods
2.1. Study area
The study site is located in Ladysmith which is a major town in Alfred Duma’s local municipality (Figure 1). Ladysmith town lies between the latitudes 28°39′53″ and 28°39′53″ south and between longitudes 29°57′42″ and 29°57′42″ east, downstream of the Klip River catchment [16]. Klip River originates from the Drakensberg mountains approximately forty kilometers to the western side of Ladysmith, and its area covers about 1670 km2 [16]. The study area receives rainfall of about 700 mm to 1000 mm/year, which is above the country’s average annual rainfall of about 450 mm, with the highest amount of rainfall received in the months between October to March, while May to August received low rainfall [16]. Ladysmith serves as a major commercial, financial and administrative area of both Alfred Duma municipality and uThukela District Municipality [17], however, it has always been subjected to flooding, and the situation has become more and more severe almost every year since 1884 [18]. In particular, the floods that occurred in 1994, 2011, 2012 and 2015, resulting in the loss of lives and disruption of business activity within the Ladysmith Central Business District [17 – 19]. In order to minimize floods occurrences, the local municipality has constructed two dams, constructed levees, installed stormwater drains but floods are continuing to cause problems within the town and its surrounding areas [19]. The study area’s population continue to increase rapidly over the past few decades, it was 174 535 in 1996 and increased to 237437 in 2011, while the provincial population increased from 8.57 million in 1996 to 11.29 million in 2019 [20].
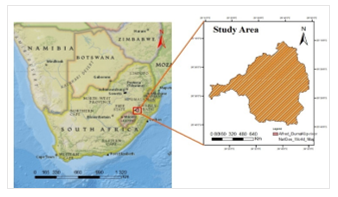 Figure 1: Location map of the study area
2.2. Data collection
In this paper, satellite imagery data has been used to investigate the historical changes in land use/cover that have taken place in the study area over 30 years starting from 1990 to 2020. Landsat images of four separate years (1990, 2000, 2010, and 2020) and digital elevation model (DEM) were freely downloaded from the USGS (United States Geological Survey) earth explorer website, https://earthexplorer.usgs.gov/. In order to avoid errors in the classification process, this study considered a cloud cover of less than ten (10) percent [21]. The physical characteristics of the Landsat images are shown in Table 1.
Table 1: Physical characteristics of the Landsat images used in this study
| Satellite Data | Path/row | Date of acquisition | Grid
cell (m) |
| Landsat 4-5 TM | 169/80 | 22 October 1990 | 30 |
| Landsat 7 ETM+ | 169/80 | 09 October 2000 | 30 |
| Landsat 5 TM | 169/80 | 06 May 2010 | 30 |
| Landsat 8 OLI/TIS | 169/80 | 25 September 2020 | 30 |
3. Methodology
3.1. Image pre-processing and classification
In this study, all images were pre-processed and classified using the ERDAS image software version 2015 and ArcGIS software version 10.7.1. Landsat images were georeferenced (WGS_84, Zone 35 North Coordinate System – Universal Transverse Mercator), and adopted a supervised and maximum likelihood algorithm for LU/C classification [21]. The process began by creating training sites and a total of 375 signatures were created using the maximum likelihood tool, and for consistency, 65 signatures were created for each one of the five classes, namely, agriculture, barren land, built-up areas, vegetation, and water bodies [22]. After classification, LU/C maps were produced and used for further analysis in square kilometers [23]. The percentage area covered by each class was computed using Equation (1) [7; 24; 25]
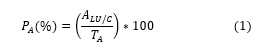 where represents the percentage area covered by LU/C, stands for the area of land use/cover, and is the total catchment area.
3.2. Land use/land cover change detection
LU/C change detection was carried out to indicate the forms of changes that have taken place between the two periods in the study area [7; 24; 26]. In this paper, the ten-year interval of LU/C maps of 1990, 2000, 2010 and 2020 was used to calculate the rate of change in between the two periods, and also the 30 years (net) changes in LU/C considering 1990 to 2020. Therefore, the rate of change between the two periods is calculated using Equation (2), [7; 23; 25; 27; 28].
![]() where represents the rate change in LU/C between two periods , where denotes the area of LU/C at the initial year, and is the area of LU/C in the final year.
where represents the rate change in LU/C between two periods , where denotes the area of LU/C at the initial year, and is the area of LU/C in the final year.
3.3. Accuracy assessment
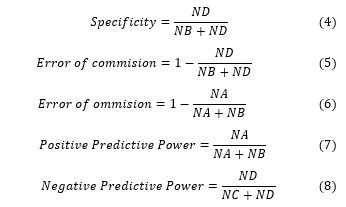
In [29; 30], authors indicated that accuracy assessment is the final phase of classification and is used to measure the map accuracy to be able to use the information that is correct and accurate. This study adopted the Kappa coefficient statistical tool which was developed by Cohen in 1960 in order to measure the agreement between observed and chance agreement [31;32]. The classification error matrix information resulting from producer’s accuracy, user’s accuracy as well as overall accuracy was used as an input to Kappa coefficient, detailed information and concepts are reported in studies conducted by [32 – 36]. The advantage of using the Kappa coefficient is its capability to correct chance agreement between the predicted and observed values [37]. In order to achieve accurate results in image classification, a total of 50 random sample points were considered as recommended by [38], and for consistency, this study used the same number of points among the five considered categories, namely, agriculture, barren land, built-up areas, vegetation, and water bodies [39]. The sensitivity, specificity, error of commission and omission, as well as positivity and negativity predictive power were computed as follows: [21; 32; 34; 35].
![]()
 where:
stands for the number of times a classification agreed with the observed value.
represents the number of times a point was classified as X when it was observed to not be X.
![]() is the number of times a point was not classified as X when it was observed to be X. is the number of times a point was not classified as X when it was not observed to be X.
is the number of times a point was not classified as X when it was observed to be X. is the number of times a point was not classified as X when it was not observed to be X.
Then, the overall accuracy was computed using Equation (10), while the Kappa coefficient was computed using Equation (11), [7; 21; 24; 26; 34; 38].
![]() Where stands for Overall Assessment; represents the number of correct points; is the total number of reference points.
Where stands for Overall Assessment; represents the number of correct points; is the total number of reference points.
![]() where, = Kappa coefficient, r = number of rows in the error matrix, = number of observations in rows and column , = marginal totals of rows , = marginal totals of column , = total number of observations.
where, = Kappa coefficient, r = number of rows in the error matrix, = number of observations in rows and column , = marginal totals of rows , = marginal totals of column , = total number of observations.
According to [12; 21; 24; 32; 40], the computed kappa coefficient results are guided by five rating scores. Table 2 presents the recommended Kappa coefficient rating score.
Table 2: Kappa statistics rating criteria
| Score (%) | Descriptions |
| less than 0.2 | Poor or very poor |
| 0.2 to 0.4 | Fair |
| 0.4 to 0.6 | Good |
| 0.6 to 0.8 | Very good |
| 0.8 to 1.0 | Excellent |
4. Results and Discussion
4.1. Land use/land cover classification
In this study, the findings are presented in the form of maps, pie charts, and tables. These include LU/C classes, LU/C classification maps, and change detection over the period between 1990 and 2020. Four satellite images of 1990, 2000, 2010 and 2020 were used to create four different LU/C maps (Figure 2 a, b, c, and d). The LU/C were classified into five namely, agriculture, built-up areas, barren-lands, vegetation, and water bodies, and were described in Table 3, whereas the magnitude of changes in LU/C are shown in Figure 3 a, b, c, and d.
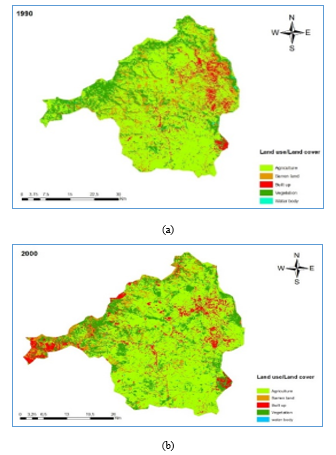
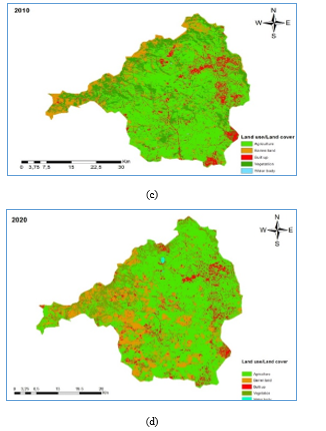 Figure 2 (a), (b), (c), and (d): Land use/cover maps of 1990, 2000, 2010 and 2020
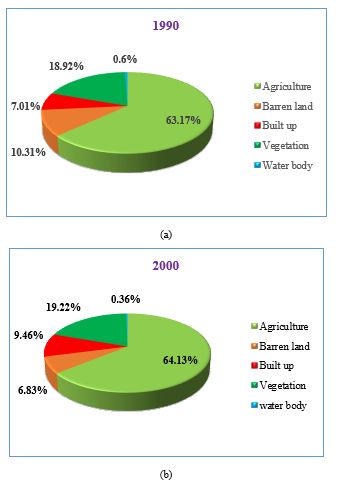
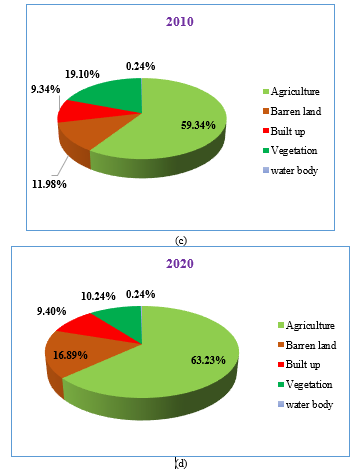 Figure 3(a), (b), (c), and (d): Pie charts showing land use/cover areas (1990, 2000, 2010 and 2020)
Table 3: Descriptions of land use/cover classes
| Code | Classes | Descriptions |
| 1 | Agriculture | Areas used for agricultural activities, including crop fields and pastures. |
| 2 | Barren land | Areas with exposed soil including rocky or sandy areas, areas of severe erosion. |
| 3 | Built-up areas | Areas covered by buildings or structures including residential, industrial, and commercial services in both rural and urban. |
| 4 | Vegetation | Areas with perennial trees mostly grow up in the preserved land, mixed woodlands, and forest plantations near rivers and on top of the mountains. |
| 5 | Waterbody | Land covered by water, including dams and other bodies containing clear open water. |
4.2. Land use/land cover change detection
This section describes the changes that have taken place before and after the floods of 1994, 2006, and 2011, and it has been done using LU/C maps of the Klip river catchment produced. The change statistics for the periods 1990-2000, 2000-2010, 2010-2020, and 1990-2020 produced from the comparison of classified maps (1990, 2000, 2010, and 2020) are shown in Tables 4, 5, 6, and 7. Table 4 displays the results of the LU/C change that occurred between the years 1990 and 2000. In 1990, agricultural land, barren land, built-up areas, vegetation and water bodies covers 63.17 % (1055 km2), 10.30 % (172 km2), 7.01 % (117 km2), 18.92 % (316 km2), and 0.6 % (10 km2) of the total area, respectively. Then, barren land and water bodies significantly decreased by 33.72 % (58 km2) and 40 % (4 km2), from 172 km2 and 10 km2 in 1990 to 114 km2 and 6 km2 in 2000, respectively. This means that 58 km2 of barren land and 4 km2 of water bodies have been converted to agricultural land, built-up areas, and vegetation, which increased by 1.49 % (16 km2), 35.04 % (41 km2), and 1.58 % (5 km2), respectively.
Table 4: Land use/cover change results (1990 – 2000)
| Land use/Land cover type | 1990 [Before Flood] | 2000 [After Flood] | Rate of change
km2 (%) |
||
| Area (km2) | % of area | Area (km2) | % of area | ||
| Agriculture | 1055 | 63,17 | 1071 | 64,13 | 16 (1,49) |
| Barren land | 172 | 10,30 | 114 | 6,83 | 58 (-33,72) |
| Built up areas | 117 | 7,01 | 158 | 9,46 | 41 (35,04) |
| Vegetation | 316 | 18,92 | 321 | 19,22 | 5 (1,58) |
| Water body | 10 | 0,60 | 6 | 0,36 | 4 (-40,00) |
| Total | 1670 | 100 | 1670 | 100 | |
Table 5 presents the results of the LU/C change that has occurred within the period 2000 and 2010. In this period, barren land was found to be the only class that recorded an increase, it significantly increased by 75.44 % (86 km2) from 114 km2 in 2000 to 200 km2 in 2010. Contrary to an increase, agricultural land, built-up areas, vegetation, and water bodies decreased from 63.14 % (1071 km2), 9.46 % (158 km2), 19.22 % (321 km2), and 0.36 % (6 km2) in 2000 to 59.34 % (991 km2), 9.34 % (156 km2), 19.10 % (319 km2), and 0.24 % (4 km2) in 2010, which represents decreasing annual rate 7.47 %, 1.28 %, 0.62 %, and 33.33 % respectively. The reason behind the decrease in built-up areas was political violence that had occurred in the province of KwaZulu Natal in the 1980s and 1990s, and continued for several years till 2011, with over 500 000 people being displaced from their homes and communities [41- 43].
Table 5: Land use/cover change results (2000 – 2010)
| Land use/Land cover type | 2000 [Before flood] | 2010 [After flood] | Rate of change
km2 (%) |
||
| Area (km2) | % of area | Area (km2) | % of area | ||
| Agriculture | 1071 | 64,13 | 991 | 59,34 | 80 (-7,47) |
| Barren land | 114 | 6,83 | 200 | 11,98 | 86 (75,44) |
| Built up areas | 158 | 9,46 | 156 | 9,34 | 2 (-1,28) |
| Vegetation | 321 | 19,22 | 319 | 19,10 | 2 (-0,62) |
| Water body | 6 | 0,36 | 4 | 0,24 | 2 (-33,33) |
| Total | 1670 | 100 | 1670 | 100 | |
Table 6 shows the LU/C change results that occurred in the period between 2010 to 2020. In 2010, agriculture constituted the major part of the five classes, covering 59.34 % (991 km2) of the total area, followed by vegetation 19.10 % (319 km2), barren land 11.98 % (200 km2), built-up areas 9.34 % (156 km2), whereas water bodies occupied the smallest area 0.24 % (319 km2 ). In this period, vegetation significantly decreased by 46.39 %, this indicates that 148 km2 of natural vegetation has been converted to agricultural land, barren land, and built-up areas, which increased from 991 km2, 200 km2, and 156 km2 in 2010 to 1056 km2, 282 km2, and 157 km2 in 2020 with an annual increasing rate of 6.56%, 41%, and 0.637%, respectively. The results further showed that 4 km2 of water bodies did not change in 2020.
Table 6: Land use/cover change results (2010 – 2020)
| Land use/Land cover type | 2010 [Before flood] | 2020 [After flood] | Rate of change
km2 (%) |
||
| Area (km2) | % of area | Area (km2) | % of area | ||
| Agriculture | 991 | 59,34 | 1056 | 63,23 | 65 (6,56) |
| Barren land | 200 | 11,98 | 282 | 16,89 | 82 (41,00) |
| Built up areas | 156 | 9,34 | 157 | 9,40 | 1 (0,637) |
| Vegetation | 319 | 19,10 | 171 | 10,24 | 148 (-46,39) |
| Water body | 4 | 0,24 | 4 | 0,24 | 0 (0,00) |
| Total | 1670 | 100 | 1670 | 100 | |
Table 7 presents the 30-year changes (net) in LU/C for the period between 1990 and 2020. In this period, agriculture, barren land as well as built-up areas recorded an increase from 63.17 %, 10.30 %, and 7.01 % in 1990 to 63.23 %, 16.89 %, and 9.40 % in 2020, with an annual increasing rate of 0.09 %, 63.95 %, and 34.19 % respectively. On the other hand, vegetation and water bodies significantly decreased from 18.92 % and 0.6 % in 1990 to 10.24 % and 0.4 % in 2020, respectively, with an annual decreasing rate of 45.88 % and –60 %, respectively.
Table 7: Land use/cover change results (1990 – 2020)
| Land use/Land cover type | 1990 [Before flood] | 2020 [After flood] | Rate of change
km2 (%) |
||
| Area (km2) | % of area | Area (km2) | % of area | ||
| Agriculture | 1055 | 63,17 | 1056 | 63,23 | 1 (0,09) |
| Barren land | 172 | 10,30 | 282 | 16,89 | 110 (63,95) |
| Built up areas | 117 | 7,01 | 157 | 9,40 | 40 (34,19) |
| Vegetation | 316 | 18,92 | 171 | 10,24 | 145 (-45,88) |
| Water body | 10 | 0,6 | 4 | 0,24 | 6 (-60,00) |
| Total | 1670 | 100 | 1670 | 100 |
4.3. Accuracy assessment
The figures below show the accuracy assessment results for classified images for the years 1990, 2000, 2010 and 2020. The overall accuracy (OA) results were 81.0 %, 81.2 %, 84.0 %, and 88.0 %, while the calculated kappa coefficient (KC) results were 75.3 %, 76.0 %, 79.8 %, and 84.8 %, respectively (Figure 4). On the other hand, user’s accuracy (UA) for all classes was above 70% except only vegetation which was 66.7% in 1990 and 62.1% in 2000. Similarly, producer’s accuracy (PA) was also above 70% for all classes, except only water bodies which stood at 65.8% in 2020 (Figure 5). In general, the land use/cover maps accuracy achieved high accuracy results, and this means that both overall and kappa accuracy satisfy the minimum requirement as stipulated by [12; 21; 24; 32; 40].
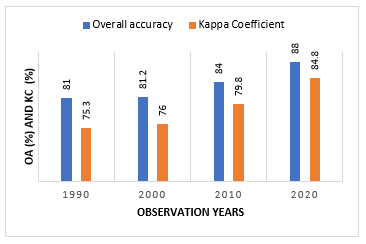 Figure 4: The overall and kappa coefficient accuracy assessment results (1990 – 2020)
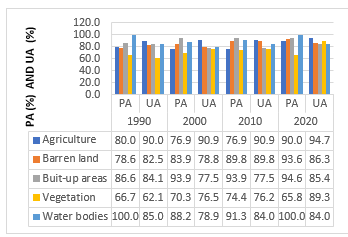 Figure 5: Producer and user’s accuracy assessment results (1990 – 2020)
5. Conclusion
The objective of this study was to quantify the land use/cover changes before and after floods of 1994, 2006, and 2015 using Geographic Information System and remote sensing. The study results showed an increasing trend in agriculture, barren land, and built-up areas, while vegetation and water bodies showed a decreasing trend over the study period (1990 – 2020). In general, the study showed that the catchment has undergone drastic modifications over the past thirty years. Results further revealed that both vegetation and water bodies drastically decreased by 45.88 % and 60 %, from 18.92 % (316 km2) and 0.6 % (10 km2) in 1990 to 10.24 % (171 km2) and 0.24 % (4 km2) in 2020, respectively. The drastic decline has led to the expansion of agriculture, barren land as well as built-up areas, which has increased from 63.17 % (1055 km2), 7.01 % (117 km2), 10.30 % (172 km2) in 1990 to 63.23 % (1056 km2), 9.40 % (157 km2) and 16.89 % (282 km2) in 2020, respectively. Therefore, it can be concluded that a drastic decline in natural vegetation and water bodies could be one of the contributing factors to the recurring floods in the Ladysmith Central Business District and its surrounding areas. This manuscript suggests that government should give greater focus on protecting, preserving and regenerating natural vegetation as well as water bodies. This information will be useful to planners and policymakers in the planning and development of land use management strategies needed to reduce flooding in the study area.
Acknowledgements
The authors wish to acknowledge both the University of South Africa and Tshwane University of Technology for funding this study.
- M. H. Saputra, H. S. Lee, “Prediction of land use and land cover changes for north Sumatra, Indonesia, using an artificial-neural-network-based cellular automaton,” Sustainability, 11(11), 3024, 2019.
- C. Liping, S. Yujun, S, Saeed, “Monitoring and predicting land use and land cover changes using remote sensing and GIS techniques: A case study of a hilly area,” Jiangle, China, PloS one, 13, (7), 0200493, 2018, doi.org/10.1371/journal.prone.0200493.
- R. Choudhary, D. Pathak, “Land use/land cover change detection through temporal imageries and its implications in water-induced disaster in Triyuga watershed, east Nepal,” Journal of Nepal Geological Society, 51, 49-54, 2016.
- M. P. A. Tali, T. A. Kanth, “Land use/land cover change and its impact on flood occurrence: a case study of upper Jhelum floodplain, M. Phil dissertation,” University of Kashmir, 2011.
- E. Zadbagher, K. Becek, S. Berberoglu, “Modeling land use/land cover change using remote sensing and geographic information systems: a case study of the Seyhan Basin, Turkey,” Environmental monitoring and assessment, 190(8), 1-15, 2018, doi.org/10.1007/s10661-018-6877-y.
- H. Chen, L. Fleskens, J. Baartman, F. Wang, S. Moolenaar, C. Ritsema, “Impacts of land-use change and climatic effects on streamflow in the Chinese Loess Plateau: A meta-analysis,” Science of the Total Environment, 703, 134989, 2020, doi.org/10.1016/j.scitotenv.2019.134989.
- B. Bufebo, E. Elias, “Land Use/Land Cover Change and Its Driving Forces in Shenkolla Watershed, South Central Ethiopia,” The Scientific World Journal, 2021, 2021, doi.org/10.1155/2021/9470918.
- D. L. Peterson, S. L. Egbert, K. P. Price, E. A. Martinko, “Identifying historical and recent land-cover changes in Kansas using post-classification change detection techniques,” Transactions of the Kansas Academy of Science, 107(3), 105-118, 2004.
- J. Maina, S. Wandiga, B. Gyampoh, C. Kkg, “Assessment of Land Use and Land Cover Change Using GIS and Remote Sensing: A Case Study of Kieni, Central Kenya,” Journal of Remote Sensing & GIS, 9(1), 1-5, 2020, doi:10.35248/2469-4134.20.9.270.
- S. Poongothai, N. Sridhar, R. A. Shourie, “Change detection of land use/land cover of a watershed using remote sensing and GIS,” International Journal of Engineering and Advanced Technology, 3(6), 226-230, 2014.
- M. G. Munthali, J. O. Botai, N. Davis, A. M. Adeola, “Multi-temporal analysis of land use and land cover change detection for Dedza district of Malawi using geospatial techniques,” International Journal of Applied Engineering Research, 14(5), 2019.
- A. J. Abubakar, E. A. Olowolafe, Y. M. Obansa, “Land Use and Land Cover Change Analysis along River Kaduna Floodplain Using Geospatial Techniques,” IIARD International Journal of Geography and Environmental Management, 1(8), 2012.
- M. Fida, I. Hussain, W. Tao, A. Rashid, S. A. Ali Shah, “Land use and land cover change analysis of District Charsadda, Pakistan along Kabul River in 2010 flood: using an advance geographic information system and remote sensing techniques,” Natural Hazards and Earth System Sciences Discussions, 1-16, 2020, doi.org/10.5194/nhess-2020-255.
- T. H. Kabanda, L. G. Palamuleni, “Land use/cover changes and vulnerability to flooding in the Harts catchment, South Africa,” South African Geographical Journal, 95(1), 105-116, 2013, doi: 10.1080/03736245.2013.806165.
- P. Tizora, A. Le Roux, G. G. Mans, A. K. Cooper, “Land use and land cover change in the Western Cape Province: quantification of changes & understanding of driving factors,” 2016.
- D. T. Chabalala, J. M. Ndambuki, R. W. Salim, S. S. Rwanga, “Impact of climate change on the rainfall pattern of Klip River catchment in Ladysmith, KwaZulu Natal, South Africa,” In IOP Conference Series: Materials Science and Engineering, IOP Publishing, 640 (1), 012088, November 2019, doi:10.1088/1757-899X/640/1/012088.
- N. Ngcobo, “Stakeholder’s perceptions of using ecological infrastructure in addressing flood risks: the case study of the Emnambithi/Ladysmith Local Municipality,” Master’s Thesis, University of KwaZulu-Natal, 2016.
- F. G. Bell, T. R. Mason, “The problem of flooding in Ladysmith, Natal, South Africa,” Geological Society, London, Engineering Geology Special Publications, 15(1), 3-10, 1998.
- B. A. Schep, A. M. Roor, M. E. Rottink, P. Spielmann, A. E. Waqué, B. J. Van de Zande, “Project Ladysmith,” 2016.
- South African Institute of Race Relation, “SA changing demographics-implications for policy,” Institute of race relation”, 2(22), 1-10, 2019.
- S. S. Rwanga, J. M. Ndambuki, “Accuracy assessment of land use/land cover classification using remote sensing and GIS,” International Journal of Geosciences, 8(4), 611-622, 2017, doi:10.4236/ijg.2017.84033.
- Y. Hailu, B. Tilahun, H. Kerebeh, T.Tafese, “Land use land cover change detection in Gibe Sheleko National Park, Southwestern Ethiopia,” Agricultural and Resource Economics: International Scientific E-Journal, (4)4, 2018.
- J. S. Alawamy, S. K. Balasundram, C. T. Boon Sung, “Detecting and analyzing land use and land cover changes in the region of Al-Jabal Al-Akhdar, Libya using time-series Landsat data from 1985 to 2017,” Sustainability, 12(11), 4490, 2020, doi:10.3390/su12114490.
- T. Gashaw, T. Tulu, M. Argaw, A. W. Worqlul, “Evaluation and prediction of land use/land cover changes in the Andassa watershed, Blue Nile Basin, Ethiopia,” Environmental Systems Research, 6(1), 1-15, 2017, DOI10.1186/s40068-017-0094-5.
- K. Alkaradaghi, S. S. Ali, N. Al-Ansari, J. Laue, “Evaluation of land use & land cover change using multi-temporal Landsat imagery: a case study Sulaimaniyah Governorate, Iraq,” Journal of Geographic Information System, 10(6), 247-260, 2018, DOI:10.4236/ijis.2018.103013.
- M. A. Giraldo, L. S. Chaudhari, L. O. Schulz, “Land-use and land-cover assessment for the study of lifestyle changes in a rural Mexican community: The Maycoba Project,” International Journal of health geographics, 11(1), 1-9, 2012,
- D. C. Phan, T. H. Trung, T. Sasagawa, T. P. T. Vu, D. T. Bui, M. Hayashi, K. N. Nasahara, “First comprehensive quantification of annual land use/cover from 1990 to 2020 across mainland Vietnam,” Scientific reports, 11(1), 1-20, 2021, doi.org/10.1038/s41598-021-89034-5.
- A. S. Minale, “Retrospective analysis of land cover and use dynamics in Gilgel Abbay Watershed by using GIS and remote sensing techniques, Northwestern Ethiopia,” International Journal of Geosciences, 4(07), 1003, 2013, dx.doi.org/10.4236/ijg.2013.47093.
- R. Manandhar, I. O. Odeh, T. Ancev, “Improving the accuracy of land use and land cover classification of Landsat data using post-classification enhancement,” Remote Sensing, 1(3), 330-344, 2009, doi:103390/rs1030330.
- G. M. Foody, “Estimation of land coverage from a land cover classification derived from remotely sensed data,” GeoJournal, 36(4), 361-370, 1995.
- G. H. Rosenfield, K. Fitzpatrick-Lins, “A coefficient of agreement as a measure of thematic classification accuracy,” Photogrammetric engineering and remote sensing, 52(2), 223-227, 1986.
- S. Talukdar, P. Singha, S. Mahato, S. Pal, Y. A. Liou, A. Rahman, “Land-use land-cover classification by machine learning classifiers for satellite observations—A review,” Remote Sensing, 12(7), 1135, 2020, doi:10.3390/rs12071135.
- K. S. Cheng, J. Y. Ling, T. W. Lin, Y. T. Liu, Y. C., Shen, Y. Kono, “Quantifying Uncertainty in Land-Use/Land-Cover Classification Accuracy: A Stochastic Simulation Approach,” Frontiers in Environmental Science, 9, 46, 2021, doi.org/10.3389/fenvs.2021.628214.
- G. Banko, “A review of assessing the accuracy of classifications of remotely sensed data and methods including remote sensing data in forest inventory,” 1998.
- Á. Barsi, Z. Kugler, I. László, G. Szabó, H. M. Abdulmutalib, “Accuracy Dimensions in Remote Sensing”. International Archives of the Photogrammetry, Remote Sensing & Spatial Information Sciences, 42(3). 2018, doi.org/10.5194/isprs-archives-XLII-3-61-2018.
- R. C. Weih Jr, D. White Jr, “Land-Use/Land-Cover Characterization Using an Object-Based Classifier for the Buffalo River Sub-Basin in North-Central Arkansas,” Journal of the Arkansas Academy of Science, 62(1), 125-132. 2008.
- J. Jenness, J. J. Wynne, “Cohen’s Kappa and classification table metrics 2.0: An ArcView 3. x extension for accuracy assessment of spatially explicit models,” Open-File Report OF 2005-1363. Flagstaff, AZ: US Geological Survey, Southwest Biological Science Center, 86p, 2005.
- R. G. Congalton, “A review of assessing the accuracy of classifications of remotely sensed data,” Remote sensing of environment, 37(1), 35-46. 1991.
- K. Kitada, K. Fukuyama, “Land-use and land-cover mapping using a gradable classification method,” Remote Sensing, 4(6), 1544-1558, 2012, doi:10.3390/rs40615544.
- M. A. Ismail, A. N. M. Ludin, N. Hosni, “Comparative Assessment of the Unsupervised Land Use Classification by Using Proprietary GIS and Open Source Software,” In IOP Conference Series: Earth and Environmental Science, IOP Publishing, 540 (1), 012020), July 2020, doi:10.1088/1755-1315/540/1/012050.
- M. Schuld, “Voting and violence in KwaZulu-Natal’s no-go areas: Coercive mobilisation and territorial control in post-conflict elections,” African Journal on Conflict Resolution, 13(1), 2013.
- M. De Haas, “The killing fields of KZN.” South African Crime Quarterly, 57, 43-53, 2016, doi.org/10.17159/2413-3108/2016/v0n57a456.
- C. Higson-Smith, “Supporting communities affected by violence: A casebook from South Africa”. Oxfam, 2002.