Survey on Novelty Detection using Machine Learning Techniques

Adv. Sci. Technol. Eng. Syst. J. 6(5), 73–82 (2021);
 DOI: 10.25046/aj060510
Novelty detection affords to identify data patterns that stray strikingly from the normal behavior. it allows a good identification and classification of objects which were not known during the learning phase of the model. In this article, we will introduce an organized and comprehensive review of the study on novelty detection. We have grouped existing methods into three classes. Statistical Based techniques, Machine Learning Based techniques and Deep Learning Based techniques. In addition, we provide a discussion on application domains of novelty detection, and for each category, we have defined the novelty, cited the most used dataset, as well as a description and perspectives of the latest work carried out in this domain. Our article is developed with the aim of facilitating to researchers a better understanding of the interest of using novelty detection in the various fields mentioned in the article, as well as to clarify the different existing novelty detection methods.
1. Introduction
Novelty detection refers to the issue of deciding whether a data is in or outside the standard norm. This means identifying that the test data diverge in some way from the data was accessible over training.
Novelty detection methods covering a huge number of applications including fraud detection [1] , medical diagnosis [2], video surveillance [3], mobile robotics [4], social media [5] and among many others.
As a rule, novelty detection methods and techniques are applied when data is accessible from a particular pattern, which is typically called the “normal” class, as opposed to “abnormal” class which contains the new data.
In the literature, Novelty detection has many synonymous terms, such as anomaly, outlier or event detection [6]. In general, the expression event detection is generally utilized to indicate a diversity of detection types.
The problem of detecting abnormal forms in a data set which is not compatible with the data has drawn a lot of attention in a vast range of fields.
There are two types of classification, One-class classification and conventional multi-class classification, and the distinction between these two is that One-class classifiers during training, require nothing else than the target data, and for new instances, perform a decision of target or unknown. In the case of absence of non-target data in the training dataset, it’s favorable to use a multi-class classifier able to employ in its evaluation the negative data.
One class classification is closely related to rare event detection, outlier detection/removal, and anomaly detection. It has been applied to a huge range of learning problems like text classification [7], medical analysis [8], machine fault detection [9] etc. In addition, diverse business domains like financial credit scoring [10] and supplier selection [11] of which one class classification was applied.
The remainder of this paper is organized as follows. In Section 2, the related applications of novelty detection in the recent years. In Section 3, we present the novelty detection methods including the statistical based techniques, machine learning based techniques and deep learning based techniques. The novelty detection techniques measurements are presented in section 4. And the application domains for the novelty detection methods are discussed in Section 5. In Section 6, we provide an overall conclusion for this review and highlights the main directions of the future work.
2. Background
Distinct machine learning algorithms are used in several research works to perform novelty detection. This section mainly presents summaries of novelty detection research work carried out by a number of researchers and authors.
The authors in [6] introduced a totally new architecture which considers the transient progression of data streams in social media for detecting novelties. This novel architecture involves three new improvements. They proposed in the first a novel concept dependent on temporal windows for novelty definition. Second, to decide the quality of novelty, they proposed an expression. In addition, by using the COCO dataset and the MASK-RCNN convolutional neural network, they acquainted a novel methodology with the combination of heterogeneous data (image + text) which makes the data ready to be recognized by machine learning algorithms by transforming the data to a single data format. They used unsupervised algorithms like kNN, HBOS, FBagging, IForesting and Autoencoders since novelty detection is a task where tagged samples are scant or inexistent. The database created contains 27,494 tweets collected from Twitter, and by using this database, the results show that merging the data gives a higher classification than using only text or images as an input value.
The authors in [12] proposed a new methodology for novelty detection that utilizes kernel dependence techniques in order to make references based on the characterizations of statistical dependencies of random variables (RV). When the statistical dependencies of the RV are strong, their ignorance can lead to inaccurate inferences which are in the form of high false positive rates. In novelty detection, taking these dependencies in multivariate issues is an important challenge. The proposed method can handle problems with arbitrarily high dimensional data. For this it uses a kernel method to encode dependencies instead of using density estimation methods which are not robust with respect to dimensionality. This approach can be applied to general novelty detection problems since it does not require any prior information about the dependency structure of RVs.
In order to identify unusual patents that may give a new idea of potential opportunities, in [13], the authors developed a new methodology which allows to extract patents based on the novelty detection statistical strategy. In order to reduce the problem of vocabulary mismatch and alleviate the tedious efforts of expert keyword selection, this natural language processing technique is applied to extract hidden relations between words in patent documents. The proposed method can be applied in the telehealth industry and even can help telehealth companies to formulate their technological strategies for determining in a large data space the outliers patents which are distinct from most of the gathered patent documents collected. The authors in [14] demonstrated a methodology which includes both the classical classification of several scenarios known a priori and the innovative detection capacity of new operating modes not already accessible. It is a conditional technique applied to industrial machines and based on novelty detection. In order to optimize the performance of classification and novelty detection, a double feature reduction stage of characteristic reduction applied based on principal component analysis and linear discriminant analysis. This method is based on the temporal segmentation of the available physical quantities and on the estimation of a set of temporal statistical characteristics.
3. Novelty Detection Methods
One-class classification task is considered as a novelty detection problem that attempts to detect situations in which out of the ordinary events occur. Usually, in the database, the amount of normal data takes up most of the data set, knowing that the normal class is detected with precision and acoustic events are considered as new events located outside of the class [15]. Based on the latest research and articles on the subject of novelty detection, we can have grouped novelty detection approaches into three different categories: Statistical based techniques, Machine Learning based techniques and Deep Learning based techniques as shown in Figure 1.
3.1. Statistical Based Methods
Usually statistical approaches using statistical properties based on modelling data to appraise if a test sample comes from a similar distribution or not. To flag novelty, the probability estimate can be thresholder [16]. An additional model, can from a threshold that is based on the number of standard deviations and from the class mean, can easily find the sample distance [17], [18]. Statistical tests are used to differentiate all selections of deviations of the current behavior from the normal behavior.
In general, when designing a statistical novelty detector and to the assessment of the probability density function, there are two essential models to follow, parametric and non-parametric. The parametric approach guesses that the data comes from a group of known distributions which considering as normal distribution, the typical dissemination and certain parameters are determined to fit this distribution. Conversely in non-parametric methods, the general form of the density function is obtained from the data just as the parameters of the model, it makes no suppositions about a parametric distribution when displaying the data.
3.1.1. Parametric Approaches
In parametric technique, the ordinary information is thought to be made by the score for the anomaly of the data and parameters. Parametric approaches make a supposition that statistically as a function of the covariance and the data means, the distributions can be modeled. And they consider these distributions are Gaussian in nature.
Gaussian mixture models have been generally applied in speech and image classification, just as other comparable example acknowledgment issues [19]. GMM models general distributions assessing the density utilizing less kernels than the quantity of patterns in the training set. By maximizing the log likelihood of the training data with respect to the model, the parameters of the model are chosen. In the event that the dimensionality of the data is high, an extremely enormous number of samples are expected to train the model. In this sense, GMM experiences the scourge of dimensionality.
There are a variety of advanced parametric methods available, some of them include Gaussian Mixture Model (GMM) and Hidden Markov Models (HMM).
Hidden Markov models were proposed without precedent in the late 1960’s mid 1970’s [20]. What’s more, are stochastic models for successive data [21]. A specific HMM regroups a finite number of unobservable (hidden) states and in each state, some state-dependent events can be observed by a probability distribution. To appraise the parameters of a HMM for displaying normal system behavior, arrangements of ordinary events
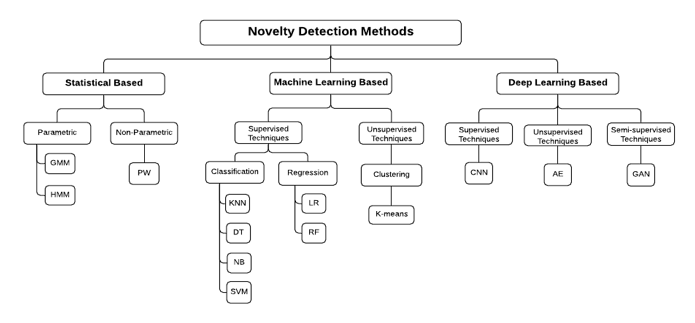 Figure 1: Classification of Novelty Detection Methods
gathered from normal system activity are utilized as training data. HMM is a specific probabilistic model broadly utilized in the field of acknowledgment particularly in speech, imagery, manually written writings and as of late in the analysis of biological sequences (DNA, proteins) [22].
3.1.2. Non parametric approaches
Non-parametric methods do not require making an assumption for the distribution of the data or the population being studied, but instead it is necessary to rely on the estimation of a distribution based on the data themselves. Frequently, Non-parametric methods solve from training data the problems that involve adaptability by modeling the system based on learned patterns [23]. The Parzen Windows approaches are among the statistical techniques used in a non-parametric model.
Parzen Window (PW) approach is generally used to estimate class-conditional probability densities for a given pattern. At the point when the size of the training dataset is during the several thousands and L is additionally enormous (a couple at least hundred), nonetheless, the PW plan can turn out to be computationally impractical. To improve the computational drawback of the PW approach, different schemes have been recommended in over years.
3.2. Machine Learning Based Methods
Generally, experimental studies use machine learning methods that integrate artificial intelligence systems. These methods have two stages, for prediction or classification, the first stage involves the study of the problem then the selection of the variables and the relevant model. And the second step involves applying the selected model to the test data and then measuring the performance of that model.
We can categorize machine learning techniques for novelty detection into two ctegories depending on the availability of the labels, supervised (Sup) which include classification and regression algorithms and unsupervised (Unsup) which include clustering algorithms.
3.2.1. Supervised Methods
The classifier in supervised learning learns the models of which combination of characteristics lead to which labeled data whose functionality is associated with their labels [24]. Supervised learning problems can be further grouped into classification and regression problems.
3.2.1.1. Classification algorithms
A classification problem is the point at which the output variable is considered as a category. It’s a technique where we categorize data into a given number of classes. The principal objective of classification-based technique is to attribute each data to the corresponding category/class. Classification can be categorized into k-Nearest Neighbors (kNN), Decision Tree (DT), Naive-Bayes (NB) and Support Vector Machine (SVM).
In conjunction with the Large Margin Nearest Neighbor (LMNN) metric learning algorithm, in [25], the authors have successfully adopted a kernelization technique in order to exploited non-linear distances learned from multi-class training data to detect novelties. They proposed a variation of the KNN classifier that utilizes the learned ideal distance which attempts to keep each known class’ examples together while pushing cases from various realized classes to remain sensibly distant. The experiments show that learned measurements are powerful in improving contrasts with different measurements.
3.2.1.2. Regression algorithms
From the data entered in the system, the regression algorithms according to the input features predict the output values. The result in this case is based on learning the model during the training phase. Some of the popular types of regression algorithms used for novelty detection are Logistic Regression (LR) and Random Forest (RF).
In order to detect anomalies of web traffic, in [26], the authors developed a LR model based on machine learning. They complete the feature extraction of the URL and train the logistic regression model by using the TF-IDF algorithm. The test results show that the model can separate abnormal traffic well for newly generated web traffic.
3.2.2. Unsupervised Methods
The training model in unsupervised techniques distinguishes unusual classes from a dataset without anyone else, whose dataset is only labelled with one label as ordinary [27].
3.2.2.1. Clustering Algorithms
Clustering based techniques are used mostly as an unsupervised learning method, they are considered as useful tools for data mining, compression, probability density estimation, and many other important tasks [28]. Clustering algorithms make it possible to recognize similar training data instance classes. Anomalies do not fit into any cluster; they can model a sparse cluster [24]. Clustering groups data instances into subsets in such a manner that similar instances are grouped together, while different instances belong to different groups [29]. And among the clustering algorithms, it is the K-means algorithm.
K-means clustering algorithm [30] serves automatically to partition a data set into k groups. It makes it possible to select k initial cluster centers and then iteratively refining them. For diverse practical applications, the k-means method is effective in producing good clustering results [31].
In the aim to improve the intrusion detection rate and decrease the false alarm rate. In [26], the authors focused on a detection method based on a K-means algorithm called MDKM to detect anomaly activities and corresponding simulation. They obtained the high-density parameters and cluster-partition parameters by calculating the distances between all sample data points and they gated the k clustering center accurately by using dynamic iterative process. The system achieves expectant aim since the results showed a higher detection rate and a lower false alarm rate.
3.3. Deep Learning Based Methods
Deep Learning is a new arising field of exploration in data science. It’s basically a blend of artificial intelligence and machine learning. Deep Learning is a machine learning procedure that learns computers to do what works out naturally to humans [32]. It’s a computerized reasoning capacity that emulates the activities of the human mind in processing data and making patterns for use in decision making [33]. There are diverse deep learning approaches that can uphold the objective of performing novelty detection or anomaly detection. Deep learning techniques can be comprehensively sorted into three categories: Supervised (Sup), unsupervised (Unsup) and semi-supervised (Semi-sup).
3.3.1. Supervised Methods
3.3.1.1. Convolutional Neural Network
Convolutional Neural Network (CNN) is the most representative model of deep learning, it’s the neural network of choice for computer vision (image recognition) and video recognition [34].
As mentioned in [35], the CNN architecture offers the possibility of optimizing together several related tasks. By benefitting from the great learning capability of deep CNNs, the problems transformed from the classic computer vision challenges that have high dimensional data have been solved from a variety of viewpoints. Due to the advantages of CNN, it has been widely applied into many research fields among them the detection of novelty and anomaly.
3.3.2. Unsupervised Methods
3.3.2.1. Auto Encoder
Auto-encoder (AE) is the nonlinear generalization of PCA that uses an adaptive, multilayer “encoder” network to transform the high-dimensional data into a low-dimensional code and a similar “decoder” network to recover the data from the code [36].
The unsupervised technique AE attempts to understand an identity function to make the input signal and the output signal as reliable as could be expected. It’s a particular neural network architecture with the objective of building as output the similar values utilized in input. As such, its goal is to get a proficient coding that considers the conditions among input values, performing a dimensionality reduction [37].
AE can potentially improve classification results by improving the capacity of learning features during training, decreasing dimensionality and extracting from original data the advanced features of abstract features. The authors in [38] proposed a deep learning method dependent on hybrid AE model formed by the blend of CAE (Contractive Autoencoder) and customary neural organization SRBM (Sparse Restricted Boltzmann Machine).
3.3.3. Semi-Supervised Methods
3.3.3.1. Generative Adversarial Network
Generative Adversarial Networks (GANs) by using alternative training techniques, estimates over a distribution density function. And it’s considered as a type of deep generative model.
The authors in [39] introduced a utilization of GAN based models to distinguish anomalies in an industrial software system to forestall system outages that can weaken system availability using semi-supervised one-class learning. For the selected industrial system, the results showed that when contrasted with the traditional GAN based anomaly detection, the utilization of a variant of GAN known as bidirectional GAN (BiGAN) efficacy.
4. Novelty Detection Techniques Measurements
In this section, we give an overview of the novelty detection techniques measurements used to evaluate techniques of novelty detection. In order to evaluate this, standard metrics such as detection rate, accuracy, precision, recall, F-score and the Area Under the Curve (AUC) [40].
4.1. Detection Rate
Detection rate is a normally used measurement to check novelty detection approaches or techniques. The result of recognition in detection rate can be grouped into four groups as following:
- True Positive is the proportion of positives that are effectively predicted.
- True Negative is the proportion of negatives that are effectively predicted.
- False Positive is the proportion of legal transaction predicted as illegal.
- False Negative is the proportion of illegal transaction predicted as legal.
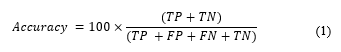
4.2. Accuracy
Accuracy metric alludes to the proportion of all effectively arranged instances either typical or abnormal. The equation beneath shows how we can have determined accuracy as a percentage:
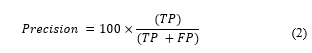
 4.3. Precision
Precision is a measure that computes the number of positive forecasts that are accurately recognized as positive. It is defined as follows:
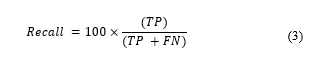
 4.4. Recall
Recall computes the number of positive instances are effectively anticipated are positive. It is otherwise called sensitivity or true positive rate. It is detailed as:
 4.5. F-score
The F-score is a measurement of accuracy that computes the weighted harmonic mean of recall and the precision. It is defined as:
 4.6. Area Under the Curve
The AUC is acquired as a graph of the rate of true positives versus false positive rates for various thresholds. It is for the most part used to show their ability in classification in slanted and covering informational data sets.
5. Applications Domains and Discussion
Novelty detection essentially based on two elements. The first element is dedicated to normal activities and present activities in order to form behavior profiles for these activities, and the second element allows to recognize any form of deviation for the profiles that are tuned in the light of various techniques.
Novelty detection is applied in different areas of applications, and it is of great importance in applications that include huge data sets gained from critical systems. Different uses of novelty detection are enumerated below:
5.1. Financial Domain
Recently, there has been a renewed interest in research on this domain. We can define fraud as unjustified deception aimed to result in financial or personal gain. Fraud prevention and fraud detection systems are considered two main mechanisms to avoid frauds and losses due to fraudulent activities.
5.1.1. Identify Novelty
A general definition of a novelty within the context of fraud detection domain is fraudulent transactions while the fraudulent transactions are partitioned into two sorts according to the article [40]: online and offline fraud. Realizing that the online misrepresentation is makes by utilizing a taken actual card at the market store e.g., while the offline fraud is submitted by taking casualty identities, for example, name of the visa holder, MasterCard numbers, expiry date, and secret phrase.
5.1.2. Datasets
Each credit card memorizes information about transaction details like account numbers, client name, exchange area, time and size of transaction, MasterCard, buy types and merchant code. To examine the anomalies that can introduce a suspect case, these details are capable of deciding if a transaction is fraudulent or legitimate by using them in various algorithms.
Among the databases used by articles located in the following part we have “European data” [41]. As a feature of an association between Worldline company specialized in money transfer service and Libre Brussels University (LBU), the “European data” was initially collected by these two research teams based on transactions from European cardholders who performed within two days in September 2013. We have also “PaySim data” [42]. it has a very low fraudulent transaction rate (< 0.2 %). By using PaySim it is built of 1048575 Credit Card Transactions CCT, and 11 ascribes (highlights) with 1142 examples addressing fraudulent transactions and 1047433 different transactions addressed as real. There are several works that used a real dataset obtained from a private bank e.g.
5.1.3. Discussion
Abdelkbir ARMEL and Dounia ZAIDOUNI, in their work [43], they managed credit card fraud detection by using the machine learning library (MLlib) of Apache Spark. And in order to distinguish between anomalies and valid transactions, they randomly generated the data used in their simulation following a normal distribution. They applied their data on four algorithms by giving a comparative analysis which shows that the RF algorithm gives the best accuracy with 98.18% among the four algorithms: Simple Anomaly detection algorithm, Decision Tree algorithm, Random Forest algorithm and Naïve Bayes algorithm.
Naoufal Rtayli and Nourddine Enneya have developed a hybrid approach for credit card fraud detection (CCFD) in their article [40]. The capacity of the proposed model to identify fraudulent transactions has been well shown in their article compared to the various studies already proposed. The Recursive Feature Elimination (RFE) for choosing the most valuable predictive feature, the GridSearchCV for Hyper-Parameters Optimization (HPO), and the synthetic Minority Oversampling (SMOTE) to defeat the imbalanced data problem are three sub-methods which build the secret of the robustness of the proposed model. To perform the model, they considered three real datasets, European data (DB1), PaySim data (DB2) and Data set 03 (DB3). In terms of accuracy, by using the datasets DB1 and DB2, the RFC (HPO, RFE) accomplishes 100%, and 99% by using the DB3 dataset. Regardless of the size of the data, this model maintains good precision performance, so it can be considered as a stable classifier model.
Table 1: Examples of application of novelty detection in financial domain
| Ref | Techniques | Dataset | Metrics of
evaluation |
Year | ||
|
[42] |
Sup | NB |
Generated randomly |
Accuracy (%) | 91.24 |
2019 |
| DT | 96.96 | |||||
| RF | 98.18 | |||||
| Simple Anomaly detection algorithm | 77.04 | |||||
|
[40] |
Sup + Unsup | RFE
+ HPO + SMOTE Synthetic |
European data | Accuracy (%) | 100
|
2020 |
| PaySim data | 100 | |||||
| Data set 03 | 99 | |||||
5.2. Video Surveillance
Video Surveillance is an application area which gives an easy checking movement in a given climate. Video Surveillance systems are utilized in different areas like military domain, it is giving an incorporated view to the environment to react to the progressing exercises.
5.2.1. Identify Novelty
Novelty can be identified by various characteristics and challenges depending on the application domain. In the field of video surveillance, novelty can be defined by several objects. It can be a pedestrians’ abnormal behavior, or abnormal movement of a vehicle or an unexpected movement of a human. The novelty differs according to the desired problem solved.
5.2.2. Dataset
Due to the limitations of real datasets of novelty detection for video surveillance, many researchers construct the data manually to evaluate their methods. In the work [44] They have collected the dataset from a collection of videos with frames labeled as “normal” or “novelty”. It is composed of three datasets which are traditional benchmarks for novelty detection problems in this domain, UCSD pedestrian dataset [45] which is composed of two subsets (Ped1 and Ped2) and Avenue Dataset [46].
The UCSD pedestrian is a video dataset was acquired by monitoring a pedestrian walkway using a stationary camera. The pedestrians are considered as normal frames and on the other hand bicycles, vehicles, skateboarders and wheelchairs passing through pedestrians are examined as anomalies. The Ped1 subassembly contains almost 8900 images with a resolution of 238 × 158 pixels of which 5500 are normal and 3400 are anomalous frames. The Ped2 subset includes 1998 images with a resolution of 360 × 240 pixels of which 364 are normal and 1652 are anomalous frames. The Avenue dataset is a video dataset captured at the Chinese University of Hong Kong campus avenue which regroup 16 video clip comprising 15,328 frames for training and 21 video comprising 15,324 frames for testing where the resolution is 640 × 360 pixels. The individuals walking by towards various directions are considered in the normal frames and the abnormal frames contain individuals running, tossing objects, and dallying.
5.2.3. Discussion
The authors in [44] used a Convolutional Auto encoder (CAE) in the novelty detection context. This method catches the 2D construction in image successions in the learning phase by applying in each frame the reconstruction error as an anomaly score. The input data was the blends of original frames and movement highlights and appearance. In order to gauge the “novelty level” of frames, they have utilized the regularized reconstruction error (RRE) and to evaluate the classification performance they have used AUC at various thresholds. The UCSD Ped, Avenue dataset and UCSD Ped2 acquired respectively the following AUC values 0.895, 0.754 and 0.547.
In the approach [47], in multiple instance learning (MIL), normal and abnormal videos were considered as bags, and instances were video segments, and to predict high anomaly scores, they learned a deep anomaly ranking model. This proposed method works better than the basic methods according to the experimental results applied to the data set which is made up of a variety of real world anomalies. He acquired an AUC measurement of 75.41.
In [48], the author proposed an approach which makes it possible to distinguish several objects of different sizes by pixel-wise foreground investigating framework. It is a technique which depends on two algorithms: Multi-layer perception recurrent neural network (MLP-RNN) and Maximally Stable Extremal Region (MSER). The proposed technique produces a segmentation guide for the same spatial objects by taking as information a reference for which the anomaly does not exist and an objective edge. Recognized anomalies are represented by featured pixels. The classification accuracy, specificity and sensitivity were reached at rates of 98.56%, 96.05% and 98.21%, respectively. These results reflect improved precision, better classification and a reduced rate of calculation errors.
Table 2: Examples of application of novelty detection in video Surveillance domain
| Ref | Techniques | Dataset | Metrics of evaluation |
Year | ||
|
[44] |
Unsup |
CAE |
UCSD Ped1 | AUC | 0.895 | 2018 |
| Avenue | 0.754 | |||||
| UCSD Ped2 | 0.547 | |||||
|
[47] |
Sup |
MIL |
Collected manually |
AUC |
75.41 |
2018 |
|
[48] |
Sup |
MLP-RNN |
Video surveillance system |
Accuracy (%) |
98.56 |
2020 |
5.3. Robotics
The use of mobile robots for several tasks is an attractive idea. Each robot is trained to identify sensory perceptions that signify potential or actual problems without requiring human intervention and can travel through environments that humans cannot. However, the technology aims to ensure that the robot does not miss any possible appearance of the problem (false negatives) while several methods and techniques of novelty detection can resolve this problem i.e. virtually impossible using conventional methods.
5.3.1. Identify Novelty
Regarding a robot’s status, robotic events can predict notable amounts of information which can be extrapolated to detect productivity, anomalies, malfunctions and used for monetization [49].
In robotic systems, the successful detection of anomalies is a key issue in order to improve their maintenance and consequently reducing economic costs and downtime. Novelty or abnormalities in this area can be identified by abnormal robot gestures or out-of-vocabulary gestures as discussed in the discussion and perspectives section.
5.3.2. Dataset
Each model or methodology must be tested on a database that corresponds to a specific domain. Among the articles discussed in the next section, there is the paper [50], The UC2017 Static and Dynamic Hand Gestures data set [51] and UC2018 DualMyo data set [52] are used to try the system proposed.
- The UC2017 data set presents the static and dynamic motion tests caught with an information glove and an attractive tracker. There are 2400 samples in the library which represent 24 classes of static gestures with a total of 100 repetitions for each of 24 classes. 19 classes among them are used to train the classifier and the 5 others are used as new models.
- The UC2018 DualMyo dataset contains 880 transactions equivalent to 8 classes of which each class includes 110 repetitions. The classifier was trained on 7 classes of which the 8th class is not banally separated from the others in an unsupervised way and was set aside to be the new model class.
5.3.3. Discussion
To addressing the issue of characterization of out-of-vocabulary motions, and by training in the Generative Adversarial Network (GAN) framework, the authors implemented in [50] a new technique utilizing Artificial Neural Networks (ANNs) in order to increase the data set online with novel created tests and the utilization of stochastic target vectors to diminish the normal prediction score. As we mentioned before, the UC2017 SG and UC2018 DualMyo data sets are used to test the model, to decide the impact of the proposed changes on the separation capacity of a neural network. According to the dataset, the classification precision was high 95.4% and 90.2% with a loss accuracy of 5% on the trained classes, this shows that the accuracy of novelty detection has been improved by the utilization of stochastic target vectors.
Table 3: Examples of application of novelty detection in robotics domain
| Ref | Techniques | Dataset | Metrics of evaluation |
Year | ||
|
[50] |
Semi-sup |
ANNs |
UC2017 SG |
Accuracy (%) |
90.2 |
2019 |
|
UC2018 DualMyo |
95.4 |
|||||
|
[53] |
Unsup |
AE |
Collected from the Gazebo simulations |
Accuracy (%) |
94.5 |
2019 |
In order to recreate the robot’s sensor data and distinguish anomalies and based on an AE architecture that use both the spatial and temporal characteristics of the sensor data, and in order to detect sensor spoofing attacks against robots, authors in [53] have proposed a method for detecting anomalies. The collection of data started when the robots began moving and closed when the entirety of the robots were certain that they had completely investigated the region and accurately merged the map. The dataset used for the test contains many unique geometries for Light Detection and Ranging LiDAR which are collected from Gazebo recreations and stored in ROSbag files [54] and also contain multiple moving objects traversing in and out of. vision. The approach has been tested against various types of attacks and the auto encoder has reached an accuracy of 0.945.
5.4. Social Media
Over the past twenty years, social media such as Facebook, Twitter or LinkedIn have seen a higher level of use by millions of users around the world, and their interaction with these social networks has affected their lives. Everyone discusses this latest news, or new technology. This information is presented on social networks in the form of text, links, images and videos.
5.4.1. Identify Novelty
Novelty detection generally presents an abnormal event. In fact, novelty is a general term used to refer to a variety of detection types according to the field of application of novelty detection. Novelty in social media domains may present sexual predators, malicious individuals, organized criminal behavior, community, fake accounts or illegal user activities.
5.4.2. Dataset
To make experiments and build the dataset for detecting fake accounts among twitter accounts, you need to get data from Twitter profiles e.g. The most used datasets in this kind of project get from ‘The fake project’ the Italian CNR dataset and Twitter API.
- The dataset @TheFakeProject is extracted from a twitter account which was created on December 12, 2012 and was used in the article [55]. This dataset contains two categories of profiles, 1950 of real accounts and 3351 of fake accounts. As mentioned in the technical report [56], the real accounts are collected from various sources like the #elezioni2013 dataset which comprised of 1481 confirmed profiles, in addition, the “Fake Project” team collected 469 verified human accounts. On the other hand, as mentioned in [57], the fake profiles were extracted from three sources http://fastfollowerz.com, http://twittertechnology.com and http://twittertechnology.com at a price of $19, $14 and $13 respectively.
- Using this API, Twitter allows us to interplay with all the attributes of these tweets. The results of requests sent to the Twitter API using a server-side scripting language are easily read since they are in JSON format. The Twitter API mainly consists of the following four objects: Tweets, Users, Entities and Places each of which contains many attributes. They have chosen some of them to add their dataset as indicated by their accessibility and appropriateness to the dataset [57]. Tweet objects that cannot be accessed by protected accounts are considered as the basic atomic building of all things.
5.4.3. Discussion
The authors in [58] introduce technique comprises two essential steps, the initial one is deciding the principle factors that impact a right detection of fake accounts, and the other step is for discovering the fake accounts by using the factors determined in the first step in a classification algorithm on Twitter accounts. This technique makes it possible to detect fake accounts that exist on Twitter social networks with maximum precision but using the minimum possible set of attributes depending on the requirement of the extended task of extraction, planning and examining features. They showed that the proposed approach allows to detect fake accounts with seven attributes from 22 attributes, even for other social networks such as Facebook with minor changes depending on the nature of the database. Among the best classification algorithms, they have applied Random Forest with accuracy equal to 91.40%, Decision Tree with accuracy equal to 90.08 %, Naïve Bayes with accuracy equal to 93.98%, Neural Network with accuracy equal to 93.80% and Support Vector Machine with the best accuracy equal to 94.26%.
Table 5: Examples of evaluation techniques
| Ref | Techniques | Dataset | Metrics of evaluation |
Year | ||
|
[58] |
Semi-sup | RF |
TFP UC2018 DualMyo |
Accuracy (%) | 91.40 |
2019 |
| DT | 90.08 | |||||
| NB | 93.98 | |||||
| NN | 93.80 | |||||
| SVM | 94.26 | |||||
|
[59] |
Semi-sup |
AE |
TFP |
Accuracy (%) |
98.44 |
2017 |
|
[60] |
Semi-sup |
CNMF
|
Collected from Sina Weibo |
Precision |
95 |
2017 |
6. Conclusion
Novelty, anomaly, outlier or exception are synonyms which present a pattern in the data that does not conform to the expected behavior. Since a machine learning system can never be trained on all possible sample classes, it must be able to recognize in the test phase the difference between known and unknown objects. Essentially for this reason, novelty detection has attracted significant attention within the research community and it’s considered as an important learning paradigm.
This review provided an updated and curated survey of research articles of the novelty detection that exists in the literature during the last decade in machine learning and deep learning literature. We have presented a background of the related topics and applications done by a number of authors in novelty detection. We observed that novelty detection algorithms can extensively be classified into three principal classes depending on the nature of the dataset, statistical based techniques, Machine learning based techniques and Deep learning-based techniques.
In addition, we have given an overview of the novelty detection techniques measurements used to evaluate techniques of novelty detection such as detection rate, accuracy, precision, recall, F-score and the Area Under the Curve (AUC).
As discussed, novelty detection methods can be applied in various application areas such as financial domain, medical diagnosis, robotics, social media, and video surveillance. In the last section of this review, for each of these areas, we have defined the novelty, cited the most used dataset, as well as a description and perspectives of the latest work carried out in this field. The future work will be a proposal for a new approach using deep learning methods for social media domain.
- M. Amorim, F.D. Bortoloti, P.M. Ciarelli, E.O.T. Salles, D.C. Cavalieri, “Novelty Detection in Social Media by Fusing Text and Image Into a Single Structure,” IEEE Access, 7, 132786–132802, 2019, doi:10.1109/ACCESS.2019.2939736.
- E. Angola, “Novelty detection of rotating machinery using a non-parametric machine learning approach,” in 2017 IEEE International Conference on Prognostics and Health Management (ICPHM), 48–54, 2017, doi:10.1109/ICPHM.2017.7998304.
- A. Armel, D. Zaidouni, “Fraud Detection Using Apache Spark,” in 2019 5th International Conference on Optimization and Applications (ICOA), IEEE, Kenitra, Morocco: 1–6, 2019, doi:10.1109/ICOA.2019.8727610.
- L.E. Baum, T. Petrie, G. Soules, N. Weiss, “A Maximization Technique Occurring in the Statistical Analysis of Probabilistic Functions of Markov Chains,” The Annals of Mathematical Statistics, 41(1), 164–171, 1970.
- J.A. Carino, M. Delgado-Prieto, D. Zurita, M. Millan, J.A.O. Redondo, R. Romero-Troncoso, “Enhanced Industrial Machinery Condition Monitoring Methodology Based on Novelty Detection and Multi-Modal Analysis,” IEEE Access, 4, 7594–7604, 2016, doi:10.1109/ACCESS.2016.2619382.
- J. Castellini, V. Poggioni, G. Sorbi, “Fake Twitter followers detection by denoising autoencoder,” in Proceedings of the International Conference on Web Intelligence, Association for Computing Machinery, Leipzig, Germany: 195–202, 2017, doi:10.1145/3106426.3106489.
- D. Chen, P. Wang, L. Yue, Y. Zhang, T. Jia, “Anomaly detection in surveillance video based on bidirectional prediction,” Image and Vision Computing, 98, 103915, 2020, doi:10.1016/j.imavis.2020.103915.
- Credit card Fraud data – dataset by raghu543, Data.World, 2020.
- S. Cresci, R. Di Pietro, M. Petrocchi, A. Spognardi, M. Tesconi, “Fame for sale: Efficient detection of fake Twitter followers,” Decision Support Systems, 80, 56–71, 2015, doi:10.1016/j.dss.2015.09.003.
- W. Dou, X. Wang, W. Ribarsky, M. Zhou, “Event Detection in Social Media Data,” 4.
- R.O. Duda, P.E. Hart, D.G. Stork, “Part 1: Pattern Classi cation,” 69, 1995.
- E. Marchi, F. Vesperini, F. Eyben, S. Squartini, and B. Schuller, “A novel approach for automatic acoustic novelty detection using a denoising autoencoder with bidirectional LSTM neural networks,” IEEE International Conference on Acoustics, Speech and Signal Processing (ICASSP), 2015.
- A. ElAzab, A. M. Idrees, M. A. Mahmoud, H. Hefny, “Fake Account Detection in Twitter Based on Minimum Weighted Feature set,” World Academy of Science Engineering and Technology, Johannesburg, South Africa, 2016.
- B. Er?ahin, Ö. Akta?, D. K?l?nç, C. Akyol, “Twitter fake account detection,” in 2017 International Conference on Computer Science and Engineering (UBMK), 388–392, 2017, doi:10.1109/UBMK.2017.8093420.
- A.B. Gardner, A.M. Krieger, G. Vachtsevanos, B. Litt, “One-Class Novelty Detection for Seizure Analysis from Intracranial EEG,” Journal of Machine Learning Research, 7(37), 1025–1044, 2006.
- M. Markou and S. Singh, “Novelty detection: a review—part 1: statistical approaches,” 2003.
- M. Graeme, P. Gareth, W. Keith, “On the Long-Term Stability of Normal Condition for Damage Detection in a Composite Panel,” Cardiff, UK, 2001.
- G. Manson, S.G. Pierce, K. Worden, T. Monnier, P. Guy, K. Atherton, “Long-term stability of normal condition data for novelty detection,” in Smart Structures and Materials 2000: Smart Structures and Integrated Systems, International Society for Optics and Photonics: 323–334, 2000, doi:10.1117/12.388835.
- X. Guo, Z. Yuan, B. Tian, “Supplier selection based on hierarchical potential support vector machine,” Expert Systems with Applications, 36(3, Part 2), 6978–6985, 2009, doi:10.1016/j.eswa.2008.08.074.
- M. Hajabdollahi, R. Esfandiarpoor, E. Sabeti, N. Karimi, S.M.R. Soroushmehr, S. Samavi, “Multiple abnormality detection for automatic medical image diagnosis using bifurcated convolutional neural network,” Biomedical Signal Processing and Control, 57, 101792, 2020, doi:10.1016/j.bspc.2019.101792.
- X. Wu, V. Kumar, J. Ross Quinlan, J. Ghosh, Q. Yang, H. Motoda, G.J. McLachlan, A. Ng, B. Liu, P.S. Yu, Z.-H. Zhou, M. Steinbach, D.J. Hand, D. Steinberg, “Top 10 algorithms in data mining,” Knowledge and Information Systems, 14(1), 1–37, 2008, doi:10.1007/s10115-007-0114-2.
- M. Hargrave, How Deep Learning Can Help Prevent Financial Fraud, Investopedia, 2020.
- M. Lasfar, H. Bouden, “A method of data mining using Hidden Markov Models (HMMs) for protein secondary structure prediction,” Procedia Computer Science, 127, 42–51, 2018, doi:10.1016/j.procs.2018.01.096.
- A. ARMEL, D. ZAIDOUNI, “Fraud Detection Using Apache Spark,” in 2019 5th International Conference on Optimization and Applications (ICOA), 1–6, 2019, doi:10.1109/ICOA.2019.8727610.
- S.R. Silva, T. Vieira, D. Martínez, A. Paiva, “On novelty detection for multi-class classification using non-linear metric learning,” Expert Systems with Applications, 114193, 2020, doi:10.1016/j.eswa.2020.114193.
- T. Liu, L. Zhang, “Application of Logistic Regression in WEB Vulnerability Scanning,” in 2018 International Conference on Sensor Networks and Signal Processing (SNSP), 486–490, 2018, doi:10.1109/SNSP.2018.00097.
- B. Liu, W.S. Lee, P.S. Yu, X. Li, “Partially Supervised Classi?cation of Text Documents,” 13, 2002.
- V. Lopes, L.A. Alexandre, “Detecting Robotic Anomalies using RobotChain,” in 2019 IEEE International Conference on Autonomous Robot Systems and Competitions (ICARSC), 1–6, 2019, doi:10.1109/ICARSC.2019.8733618.
- C. Lu, J. Shi, J. Jia, “Abnormal Event Detection at 150 FPS in MATLAB,” 2720–2727, 2013.
- L.M. Le Cam, J. Neyman, Proceedings of the Fifth Berkeley Symposium on Mathematical Statistics and Probability: Weather modification, University of California Press, 1967.
- K. Alsabti, S. Ranka, V. Singh, “An efficient k-means clustering algorithm,” Electrical Engineering and Computer Science, 1997.
- I.G. Maglogiannis, Emerging Artificial Intelligence Applications in Computer Engineering: Real Word AI Systems with Applications in EHealth, HCI, Information Retrieval and Pervasive Technologies, IOS Press, 2007.
- V. Mahadevan, W. Li, V. Bhalodia, N. Vasconcelos, “Anomaly detection in crowded scenes,” in 2010 IEEE Computer Society Conference on Computer Vision and Pattern Recognition, 1975–1981, 2010, doi:10.1109/CVPR.2010.5539872.
- R. Mohammadi-Ghazi, R.E. Welsch, O. Büyüköztürk, “Kernel dependence analysis and graph structure morphing for novelty detection with high-dimensional small size data set,” Mechanical Systems and Signal Processing, 143, 106775, 2020, doi:10.1016/j.ymssp.2020.106775.
- Z. Zhao, P. Zheng, S. Xu, X. Wu, “Object Detection With Deep Learning: A Review,” IEEE Transactions on Neural Networks and Learning Systems, 30(11), 3212–3232, 2019, doi:10.1109/TNNLS.2018.2876865.
- M. Murugesan, S. Thilagamani, “Efficient anomaly detection in surveillance videos based on multi layer perception recurrent neural network,” Microprocessors and Microsystems, 79, 103303, 2020, doi:10.1016/j.micpro.2020.103303.
- M.A. Russo, L. Kurnianggoro, K. Jo, “Classification of sports videos with combination of deep learning models and transfer learning,” in 2019 International Conference on Electrical, Computer and Communication Engineering (ECCE), 1–5, 2019, doi:10.1109/ECACE.2019.8679371.
- Z. Yang, H. Jing, “A deep learning method based on hybrid auto-encoder model,” in 2017 IEEE 2nd Information Technology, Networking, Electronic and Automation Control Conference (ITNEC), 1100–1104, 2017, doi:10.1109/ITNEC.2017.8284911.
- T. Kumarage, S. Ranathunga, C. Kuruppu, N.D. Silva, M. Ranawaka, “Generative Adversarial Networks (GAN) based Anomaly Detection in Industrial Software Systems,” in 2019 Moratuwa Engineering Research Conference (MERCon), 43–48, 2019, doi:10.1109/MERCon.2019.8818750.
- G. Muruti, F.A. Rahim, Z. bin Ibrahim, “A Survey on Anomalies Detection Techniques and Measurement Methods,” in 2018 IEEE Conference on Application, Information and Network Security (AINS), 81–86, 2018, doi:10.1109/AINS.2018.8631436.
- E. Özbilge, “Experiments in online expectation-based novelty-detection using 3D shape and colour perceptions for mobile robot inspection,” Robotics and Autonomous Systems, 117, 68–79, 2019, doi:10.1016/j.robot.2019.04.003.
- K. Pahwa, N. Agarwal, “Stock Market Analysis using Supervised Machine Learning,” in 2019 International Conference on Machine Learning, Big Data, Cloud and Parallel Computing (COMITCon), 197–200, 2019, doi:10.1109/COMITCon.2019.8862225.
- T. Pourhabibi, K.-L. Ong, B.H. Kam, Y.L. Boo, “Fraud detection: A systematic literature review of graph-based anomaly detection approaches,” Decision Support Systems, 133, 113303, 2020, doi:10.1016/j.dss.2020.113303.
- M. Ribeiro, A.E. Lazzaretti, H.S. Lopes, “A study of deep convolutional auto-encoders for anomaly detection in videos,” Pattern Recognition Letters, 105, 13–22, 2018, doi:10.1016/j.patrec.2017.07.016.
- S. Rivera, S. Lagraa, A.K. Iannillo, R. State, “Auto-Encoding Robot State Against Sensor Spoofing Attacks,” in 2019 IEEE International Symposium on Software Reliability Engineering Workshops (ISSREW), 252–257, 2019, doi:10.1109/ISSREW.2019.00080.
- rosbag, accessed: 2018-03-27 – ROS Wiki, 2020.
- N. Rtayli, N. Enneya, “Enhanced credit card fraud detection based on SVM-recursive feature elimination and hyper-parameters optimization,” Journal of Information Security and Applications, 55, 102596, 2020, doi:10.1016/j.jisa.2020.102596.
- S. Cresci, R. D. Pietro, M. Petrocchi, A. Spognardi, and M. Tesconi, “A Fake Follower Story: improving fake accounts detection on Twitter,” 2014.
- H.J. Shin, D.-H. Eom, S.-S. Kim, “One-class support vector machines—an application in machine fault detection and classification,” Computers \& Industrial Engineering, 48(2), 395–408, 2005, doi:10.1016/j.cie.2005.01.009.
- A. Shrestha, A. Mahmood, “Review of Deep Learning Algorithms and Architectures,” IEEE Access, 7, 53040–53065, 2019, doi:10.1109/ACCESS.2019.2912200.
- M. Simão, P. Neto, O. Gibaru, “Improving novelty detection with generative adversarial networks on hand gesture data,” Neurocomputing, 358, 437–445, 2019, doi:10.1016/j.neucom.2019.05.064.
- M. Simão, P. Neto, O. Gibaru, UC2017 Static and Dynamic Hand Gestures, 2018, doi:10.5281/zenodo.1319659.
- M. Simão, P. Neto, O. Gibaru, UC2018 DualMyo Hand Gesture Dataset, 2018, doi:10.5281/zenodo.1320922.
- W. Sultani, C. Chen, M. Shah, “Real-World Anomaly Detection in Surveillance Videos,” in 2018 IEEE/CVF Conference on Computer Vision and Pattern Recognition, IEEE, Salt Lake City, UT: 6479–6488, 2018, doi:10.1109/CVPR.2018.00678.
- Synthetic Financial Datasets For Fraud Detection, 2020.
- J. Wang, Y.-J. Chen, “A novelty detection patent mining approach for analyzing technological opportunities,” Advanced Engineering Informatics, 42, 100941, 2019, doi:10.1016/j.aei.2019.100941.
- What Is Deep Learning? \textbar How It Works, Techniques \& Applications, 2020.
- Y.Y. Yang, M. Mahfouf, G. Panoutsos, “Confidence Interval Assessment for Charpy Impact Energy Predictions – A Gaussian Mixture Model (GMM)-Based Approach,” IFAC Proceedings Volumes, 44(1), 11738–11743, 2011, doi:10.3182/20110828-6-IT-1002.01881.
- Yongqiao Wang, Shouyang Wang, K.K. Lai, “A new fuzzy support vector machine to evaluate credit risk,” IEEE Transactions on Fuzzy Systems, 13(6), 820–831, 2005, doi:10.1109/TFUZZ.2005.859320.
- D. Yu, N. Chen, F. Jiang, B. Fu, A. Qin, “Constrained NMF-based semi-supervised learning for social media spammer detection,” Knowledge-Based Systems, 125, 64–73, 2017, doi:10.1016/j.knosys.2017.03.025.