Emotion Mining from Speech in Collaborative Learning

Adv. Sci. Technol. Eng. Syst. J. 6(5), 90–100 (2021);
 DOI: 10.25046/aj060512
Affective states, a dimension of attitude, have a critical role in the learning process. In the educational setting, affective states are commonly captured by self-report tools or based on sentiment analysis on asynchronous textual chats, discussions, or students’ journals. Drawbacks of such tools include: distracting the learning process, demanding time and commitment from students to provide answers, and lack of emotional self-awareness which reduces the reliability. Research suggests speech is one of the most reliable modalities to capture emotion and affective states in real-time since it captures sentiments directly. This research, which is an extension of the work originally presented in FIE conference’20, analyses students’ emotions during teamwork and explores the correlation of emotional states with students’ overall performance. The novelty of this research is using speech as the source of emotion mining in a learning context. We record students’ conversations as they work in low-stake teams in an introductory programming course (CS1) taught in active learning format and apply natural language processing algorithms on the speech transcription to extract different emotions from conversations. The result of our data analysis shows a strong positive correlation between students’ positive emotions as they work in teams and their overall performance in the course. We conduct aspect-based sentiment analysis to explore the themes of the positive emotions and conclude that the student’s positive feelings were mostly centered around course-related topics. The result of this analysis contributes to future development of predictive models to identify low-performing students based on the emotions they express in teams at earlier stages of the semester in order to provide timely feedback or pedagogical interventions to improve their learning experience.
1. Introduction
Social constructs have an essential role in the learning process which highlights the importance of teamwork and improving students’ social skills in educational settings [1], [2]. Evaluating individual student’s performance in teams is a complex process, especially in low-stake teams in which the product of teamwork does not have a large contribution to the students’ grade [3]. In such teams, the main goal of teamwork is peer learning and developing interpersonal skills [1], [4]. Practicing low-stake teams is common in collaborative active learning classes [3].
In collaborative active learning, class time is utilized to create an engaging learning experience for students and improve their social skills [5]. There are multiple types of pedagogy that could be classified as active learning, such as team-based learning (TBL) [6], cooperative learning [7], [8], collaborative learning [5], problem-based learning [5], or studio-based learning [9]. Most forms of active learning emphasize collaboration and the social construction of knowledge. During the past decade, active learning has been applied more often in higher education, and it highlights the importance of having structured protocols for team formation, team size, and assessment [10], [11]. The inherently complex nature of teamwork in active learning calls for methods to assess students’ performance at both individual and team levels [12], [13]. This is more critical in low-stake teams which are used in introductory-level courses. To address this evaluation issue theories on team performance, converge in identifying attitude components such as emotional states that influence team performance [13]-[18].
Here the question is how to operationalize attitude constructs as factors to be measured. Research shows that a survey is commonly used for this purpose [13]. Attitude has been traditionally measured by having students fill out self-report forms, typically using a Likert scale to express their feelings towards a specific subject [13]. However, the self-report tools have some drawbacks such as: lack of student commitment to fill them out, not providing precise answers, and lack of awareness about their emotion at the moment. More advanced tools exist to allow researchers to retrieve emotional information by observing facial expressions, gestures, posture, and periods of silence [19]-[22]. Although these tools may provide more precise results on capturing emotion compared to self-reports, still they are not error-free, and deploying such tools requires both technical and human resources which may not be cost-effective. These drawbacks as well as the potential distraction of the learning process can make such tools less practical in educational settings and classrooms. Researchers suggest speech is a very good source to identify emotion, however because of challenges such as environmental noise level it is not commonly practiced [23].
This paper focuses on emotion analysis as a subset of affect and measures the correlation between the emotions that students express in low-stake teams with their performance in the course. We identify students’ emotions as they work in dyad teams by recording their verbal conversations and analyze how emotional states correlate with their performance. Identifying these relationships can help us in developing tools to monitor students’ emotions and identify at-risk individuals at earlier stages of the semester.
In the next section, we discuss different dimensions of teamwork and methods of evaluating students’ performance at both team and individual levels in educational settings and introduce emotion as an attitude construct that is associated with team performance. In section 3, we present our methodology, study design, and data collection protocol followed by the results of data analysis. Finally, we conclude by discussing the takeaways and the plan for future work.
2. Background
Evaluating students’ involvement in teams and providing timely feedback are key components to a good team experience. Researchers have proposed different tools and insights on evaluating team performance over the past 30 years. The review of the literature of teamwork assessment shows there are four primary ways to collect data on team performance: 1) self-report, 2) peer assessment, 3) observation, and 4) objective outcomes. For optimal results, it is suggested to combine both qualitative and quantitative data collection [13]. For a comprehensive teamwork evaluation, we need to collect information from different sources [13]. Gathering the necessary information from all perspectives of teamwork requires a group of team observers [24]. In general, it is not easy for instructors to evaluate team dynamics inside and outside the classroom to verify a fair and successful team experience for every individual. For this reason, peer and self-evaluation are common methods of assessing individuals’ contributions in teamwork. Surveys are employed for this kind of assessment and these surveys can include Likert scales, partner ranking, descriptive word matching, short answers about peers, and journaling about their effort and experiences [25]. Finally, the weight of the grade is either provided by the instructor in the form of a standard rubric, or the weight of each component is negotiated between the instructor and the students [26]. Teams have outcomes at both team and individual levels, therefore measuring teamwork at the individual level is important. The team-level outcome is the final product which is the result of the effort of all team members, while at the individual level the outcome can be the team member’s attitude or contribution to the teamwork process [13].
In low-stake teams, no significant team-level final product is produced to be evaluated as a team performance metric. In these types of teams, students do not have assigned roles, and since teamwork activity has a low contribution to final grades, there is a high chance that students rely on their partners and don’t participate in team activity as expected. This situation has severe consequences in collaborative active learning since students will not utilize the class time to learn course material through team activities. In such cases, the emphasis of the team evaluation should be more at the student level and their attitude towards teamwork, in order to provide timely feedback to them.
Lack of quantitative and objective measures of teamwork at the individual level is a barrier for evaluating teams’ performance and assembling effective teams [27]. Most metrics to evaluate individuals in teams rely on experts who observe and rate teams by using rubrics or based on qualitative dimensions like leadership and team structure [27]. Here the question is what data needs to be collected and what factors should be used for evaluating individuals in low-stake teams. Recent research shows that attitudinal factors in teamwork can determine team effectiveness [28]. In this research, the first step is to identify the attitude that individuals pose in teams [29]. In the following section, we discuss how the affect (combination of emotion and mood) as attitudinal dimension is associated with performance in the educational setting and discuss the methods for measuring emotional states.
2.1. Affect and Emotion
Affect as an attitudinal attribute plays an important role in students’ learning in educational settings [30]. The affective domain which includes both emotions and moods shows how much a person values the learning process, their willingness to contribute to learning new things, their ability to make a decision, and how generally one behaves in different situations [31], [32]. Emotional obstacles can negatively impact students’ learning process while positive feelings of joy, happiness, and satisfaction positively influence students’ learning [33]. Research shows that students who experience emotional difficulties that are not identified early may not receive appropriate feedback and can result in lower performance [34]. Furthermore, affective states not only impact the performance but also, influence the interpersonal relationships in teams in educational settings [32]. Therefore, considering affective states and emotional awareness is important for both students and instructors [35]. For students, emotional awareness empowers them with the required skills to manage their emotions and establish positive relationships with peers and handle challenging situations effectively [32]. This is critical in collaborative active learning in which the learning and cognitive process are integrated into teamwork [35]. Identifying students’ emotional state is important for instructors since it can lead to both cognitive and affective scaffolding, which can improve social knowledge construction [35].
Psychologists claim a person can be known based on three domains called the ABCs of attitude which is: Affect, Behavior, and Cognition [36]. Cognition can be measured based on the learning outcome and behavior can be observed, but affect is not directly observable and is more challenging to measure [31]. There is a wide range of methods for measuring affective states. These methods vary from psychological measures such as heart rate, diagnostic tasks, self-reports, facial expressions, and knowledge-based methods to derive affective state in a given context like time of day and length of the task and individual journals [23]. The most common form of measuring affect is using self-report surveys [13] which has certain drawbacks as discussed in the previous section. More advanced tools such as EEG technology have been applied to capture emotional states through brain signals or by observing facial expressions, gestures, posture, and periods of silence [37]-[27]. Although these tools provide better results on capturing emotion compared to individual surveys and self-reports, still they are not error-free, and deploying these tools and using experts as observers is demanding in the educational domain for a large number of students.
To date, most of the existing tools to identify learners’ emotional states use self-report instruments such as the Achievement Emotions Questionnaire (AEQ) [35], [40]. Fewer researchers recognize emotional states by doing sentiment analysis on students’ journals and learning diaries or from their conversations in forums or other asynchronous textual data [41]. These methods are applied to either identify the polarity of students’ emotions or the expressions of six fundamental emotions of anger, trust, surprise, sadness, joy, fear, disgust, and anticipation [41]. Although sentiment analysis is more promising to evaluate emotion, it has not been widely applied in the educational domain compared to the social media or e-commerce review corpora due to data limitations [33], [41].
Researchers claim speech is one of the best tools to extract information about emotion, however because of challenges in data collection it is not widely used in the educational domain [23]. The selection of a suitable method for emotion analysis depends on different factors such as the type of emotions to be identified. the resources required to collect data, and the context in which the task is performed [23]. For example, in some contexts using self-reports may be more appropriate than using sensors, since sensors can cause interference with the task being performed by the students [23].
One of the innovations of this research is assessing students’ emotions based on their verbal speech in teams. The advantage of this approach is that emotion is captured directly, it minimizes distraction during the learning activity, and data collection can be done at a large scale. In the next section, we introduce our methodology to operationalize emotional states and elaborate on how we design the study.
3. Methodology
In this research, we identify correlations between emotion and students’ performance in low-stake teams. We further conduct aspect-based sentiment analysis to identify the topics in which the students expressed the most positive or negative emotion. The result of this analysis can help us identify the areas in which students have more challenges and apply pedagogical interventions. We formulate the following null hypothesis:
H0: There is no correlation between a student’s positive sentiment in low-stake teams and their individual performance in the course.
In our study, speech is the modality of data collection for measuring and analyzing students’ emotions. We recorded students’ speech as they talked in teams during the class activity throughout the semester. The recorded audio files were then transcribed for text mining and emotion analysis. The data processing phase includes the following steps: 1) noise reduction by applying filters on the audio to improve the quality, 2) audio transcription, 3) assigning IDs to each individual based on the voice recognition, and 4) removing the speech utterances from the third person (i.e., speakers other than the team members). As a result, the transcription of all speech utterances of every participant was stored as one data point. This resulted in 28 datasets to feed into the text mining and sentiment analysis algorithms. This process is illustrated in Figure 1.
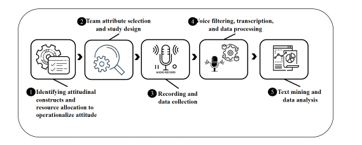 Figure 1: Data Collection and Analysis Process
We used different methods to analyze students’ sentiments in speech and identified their correlation with performance. First, was measuring the polarity, frequency, and intensity of the sentiments in three classes of positive, negative, and neutral. Next, different classes of emotion were extracted.
Finally, we performed thematic analysis of the sentiments (aspect-based sentiment analysis) to explore the context and themes in which students expressed more positive sentiment as they spoke in the class. In the following, we explain how each method for sentiment analysis was conducted in this study.
3.1. Polarity Sentiment Analysis
The first step for polarity sentiment analysis was the segmentation of the datasets so that each vector is the speech initiation point, meaning each vector consists of the speech of a participant until it is finished or interrupted by the other teammate. As a result, the number of vectors in each dataset denotes the number of times a participant initiated the speech either in an active or reactive mode. The visualization of the text-mining algorithm for polarity and intensity sentiment analysis is presented in Figure 2.
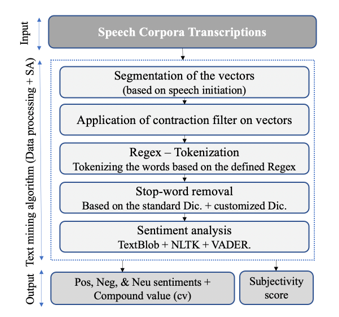 Figure 2: Algorithm for Polarity and Intensity Sentiment Analysis
After applying the contraction filtering on the vectors, we developed a regular expression for tokenizing the vectors and eliminating extra characters which did not impact the sentiment score. We used both the standard English dictionary and also created a custom dictionary to remove the stop words and as well as the redundant words that speakers used habitually and didn’t impact the sentiment score. For developing the customized dictionary, we measured the frequency of unigrams in each dataset, and the most frequent common unigrams across all datasets were included in the dictionary to be removed from the corpora. Examples of such words are ‘yeah’, ‘ok’ that students uttered repeatedly.
Finally, we analyzed the sentiments from the processed data by applying lexicon-based and rule-based NLP python tools; TextBlob, NLTK, and VADER. The VADER algorithm was applied due to its higher precision and accuracy on short tokens at string-level compared to other sentiment analysis tools [42]-[44]. Moreover, many sentiment analysis tools are either polarity-based or valence-based but VADER measures both the polarity and valence of the input. VADER outputs four classes of ‘Negative’, ‘Neutral’, ‘Positive’, and ‘Compound’ with values between -1 to 1. The compound score is the adjusted normalized value of the sum of valence scores of each word in the lexicon. The equation of compound value is presented in Equation (1) [45]:
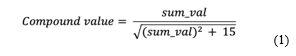 where sum_val is the sum of the sentiment arguments passed to the score_valence() function in the VADER algorithm.
We used compound value (cv) as a metric for the unidimensional measure of sentiment. The threshold for classifying positive, negative, and neutral sentiments can vary based on the context. The typical thresholds are [12][46]:
Positive sentiment: cv >= 0.05
Neutral sentiment: -0.05 < cv < 0.05
Negative sentiment: cv <= – 0.05
In this study, we conducted the k-means clustering on the compound values to determine the right threshold for the data. The Elbow method was used to identify the optimum number of clusters. The Elbow method explains the percentage of the variance as a function of the number of clusters meaning the optimum number of clusters is defined such that adding one more cluster does not provide better modeling of the data [47]. The best number of clusters is chosen based on the ‘Elbow criterion’, which is shown as an angle in the graph (Figure 3.a) [47]. The Elbow criterion determines three as the optimum number of clusters. The 3-means clustering of data shows the most density of compound values in the cluster with cv= 0 as shown in Figure 3.b.
| 3.a. Elbow Criterion | 3.b. 3-Means Clustering |
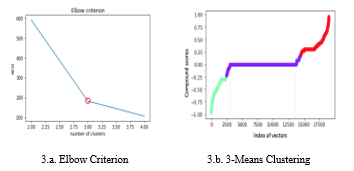 Figure 3: Elbow Criterion and 3-Means Clustering of cv
As a result, we considered zero as the threshold for classifying cv into positive, neutral, and negative sentiments. This means any vector with cv < 0 was labeled as negative, vectors with cv > 0 were considered as positive, and vectors with cv = 0 were treated as neutral sentiment classes.
Next, we identified multiple classes of sentiments from speech corpora. The methodology for doing so is described in the following section.
3.2. Multi-class Sentiment Analysis
In addition to analyzing the polarity of the sentiments, we analyzed how different types of emotions contributed to students’ performance. For extracting multiple classes of emotions, we applied the LIWC (Linguistic Inquiry and Word Count) which is an efficient text analysis tool for analyzing diverse emotional and cognitive components in verbal or written speech corpora [48]. The core of the LIWC is the LIWC2015 dictionary which includes
almost 6400 word-stems and selected emotions. In this tool, a single word such as “cry” that carries emotion can belong to different categories such as sadness, negative emotion, and overall affect [48]. Each category of LIWC2015 includes a list of dictionary words that define the relevant scale. The complete list of scales and scale words can be found in the LIWC2015 Development manual [48].
In this study, we selected specific dictionary categories to identify which emotions more contribute to individuals’ performance. The total number of 93 dimensions in all 4 sub-dictionaries exist in the LIWC2015, out of which we identified 63 dimensions to be most relevant to the context of this study. These dimensions exist in the four sub-dictionaries of 1) psychological processes, 2) Linguistic processes 3) punctuation, 4) other grammar. The proportion of selected dimensions in each sub-dictionary were 67% psychological processes, 24% linguistic processes, 6% other grammar, and 3% punctuations. The scale score of each 63 dimensions is a numerical value measured by using the LIWC framework.
In the next step, we applied Principal Component Analysis (PCA) technique to conduct factor analysis. PCA is an unsupervised statistical method to reduce the dimensionality of large and complex data [49]. It identifies the interrelation between features and reduces the number of features by creating a new feature (component) based on the linear combination of initial features. The main steps of PCA are 1) removal of the target feature and class labeling by creating a d-dimensional matrix, 2) calculating the covariance matrix of the whole dataset, 3) computing eigenvectors (e1, e2, …ed) and corresponding eigenvalues (λ1, λ2, …, λd), 4) sorting the eigenvectors by decreasing eigenvalues and choose k eighteen vectors with the larger eigenvalues to form a d*k dimensional matrix (in this study, we considered the threshold of 1 and chose the number of components (k) with eigenvalues > 1), 5) using the d*k eigenvector matrix to transform the samples onto the new subset.
The PCA method is widely applied in developing predictive models. After dimensionality reduction, the dataset is divided to test and train datasets to fit the data into the training algorithm. In this study, the goal is to identify the correlation of different emotions with performance and identify the ones that most contribute to performance. However, the development of the predictive models is not the focus of this study and will be done in future research. The next step of analyzing emotions is aspect-based sentiment analysis, which is described in the following section.
3.3. Aspect-based Sentiment Analysis
The last step of sentiment analysis in this study was the aspect-based analysis and exploring the themes of the positive sentiments. We applied word frequency analysis and measured the frequency of the tokens both unigrams and bi-grams in the positive sentiment corpora. After identifying the most frequent word tokens we identified the proportion of course-related tokens among them.
3.4. Data Collection
The data for this study was collected from an active learning CS1 class in which students worked in low-stake teams to do the class activities. Based on the research [13] and our empirical evidence, in order to improve students’ engagement, we decided to form teams of two students. Team formation was done subjectively, and they were mixed of both males and females with diverse backgrounds. We formed the teams at the beginning of the semester by a gamified activity in which students were paired based on their month of birth. Since students were mostly involved in the team formation game, we noticed high levels of satisfaction between teammates throughout the semester.
The class included 65 students among which 48 participated in this study. We collected the recorded speech of 48 participants throughout the whole semester, however, due to some technical issues or absence of students during some sessions, the recording of 28 individuals (14 teams of two students) was considered in this study due to their consistent pattern of attendance in the class.
The class was held for 75 minutes during two days of the week. In each class, the first 15-20 minutes was dedicated to resolving student’s misconceptions from the previous session followed by a low-stake clicker quiz and a 15-minute mini-lecture. The remaining class time (about 40 minutes) was dedicated to peer learning class activities in the form of low-stake teamwork.
During data collection, we faced multiple environmental and technical issues or human errors which made the data unavailable for analysis. For example, sometimes students pressed the stop button on the recorder accidentally, or sometimes it was the battery or hardware issue which led to the loss of data. On top of that, environmental noise level and cross talk in class when all team members were talking at the same time was a challenge in data collection. We employed some protocols to overcome these challenges such as training specific TAs for the recording-related tasks or encouraging students to sit in certain locations to minimize the noise level and improving the quality of the recording. To overcome the hardware-related challenges, we identified recording devices that had features like bidirectional paired microphones, built-in noise cancellation, lasting battery, high-level user-friendliness, and low cost. In the next section, the result of the data analysis is presented, and the null hypothesis is evaluated.
4. Data Analysis
The main goal of data analysis is to identify the correlation between positive emotions and students’ performance and identifying emotions that can serve as predictive metrics.
The performance metric is considered to be students’ grades in the course. Students’ performance was assessed in a formative style during the semester by three major assignments, three lecture tests, and three lab tests. Each milestone had a certain contribution to the final grade: assignment 20%, lecture test 30%, and lab test 30%. Participants’ grade distribution is presented in Figure 4.
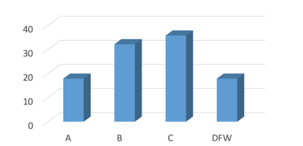 Figure 4: Grade Distribution of the Participants
The linear regression analysis of the performance scores over time determines the slope of trendlines (i.e., the ratio of change over time). Accordingly, the participants were categorized into three groups; upward trend (slope >0): 57%, downward trend (slope <0): 28%, no trend (slope = 0): 14%.
The data shows that most of the participants had an upward trend which means their performance increased during the semester. In the rest of this section, we present the analysis result.
4.1. Polarity and Intensity of Sentiments
To analyze the polarity of the sentiments NLTK and VADER algorithms were applied on the 28 datapoints to classify each vector into four classes of Positive (Pos), Neutral (Neu). Negative (Neg) and Compound (Comp). As described in the methodology section, the vectors with cv > 0 are considered to be positive sentiments. The intensity and frequency of positive sentiments were normalized based on the amount of speech. Frequency refers to the number of vectors with cv > 0 and intensity refers to the actual score of cv in each vector. Equations (2) and (3) show how the mean frequency and intensity scores are measured.
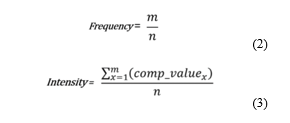 where:
n= total number of vectors in each dataset
Vectors with positive comp_value= {1,2, …m}
We identified a homogeneous pattern between frequency and intensity of positive sentiments (cv > 0), based on the linear regression analysis. This means the students with higher frequency of positive sentiments had higher levels of intensity in their positive emotions. The linear regression plot of the frequency and intensity of positive sentiments is presented in Figure 5.
The Spearman’s rank correlation coefficient was applied to identify if there is a positive relationship between students’ positive sentiments (intensity and frequency) and their performance. Spearman’s rank correlation coefficient is a nonparametric (distribution-free) rank statistic for measuring the strength of an association between two variables [50]. It evaluates how the relationship between two variables can be described using a monotonic function, without making any assumptions about the frequency distribution of the variables [50]. The coefficient value (rs) can be anywhere between -1 and 1, and the closer rs is to +1 and -1, the two variables have a stronger monotonic relationship. The rs value is calculated using equation (4) and the strength of the correlation is interpreted based on the absolute value of rs; rs = 00-.19 “very weak”, rs =.20-.39 “weak”, rs = .40-.59 “moderate”, rs = .60-.79 “strong”, rs = .80-1.0 “very strong” [51].
 where di is the difference in ranks for variables and n is the number of cases. The calculated rs values are presented in Table 1.
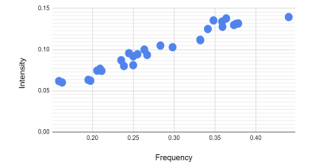 Figure 5: Linear Regression of Frequency and Intensity of Positive Sentiments
Table 1: Coefficient Values of Positive Sentiments and Performance
| Coefficient Value (rs) | ||
| Frequency and performance | .61 | Strong positive correlation |
| Intensity and performance | .64 | Strong positive correlation |
The coefficient values of both intensity and frequency of positive sentiments show that both have a strong positive correlation with performance.
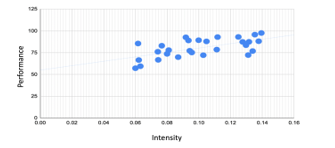 Figure 6: Regression plot of the Intensity of Positive Sentiment vs Performance
The linear regression plot of intensity and frequency of positive sentiments vs performance are presented in Figures 6 and 7. In these plots, the horizontal axis shows the intensity and frequency of positive sentiments, and the vertical axis shows the performance score.
To test the null hypothesis (H0), we applied the chi-square test and measured the two-tailed p-value with the confidence level of 0.05. The Null hypothesis states: There is no correlation between students’ positive sentiment in low-stake teams and their individual performance in the course.
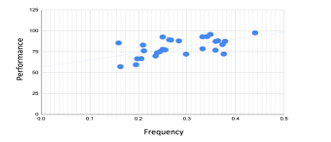 Figure 7: The Regression Plot of Frequency of Positive Sentiment vs Performance
The calculated p-value for the intensity of positive compound value is 0.002 and the p-value for the frequency of compound value is 0.001. The p-values for both the intensity and frequency of positive sentiments are less than the confidence level (0.05), therefore the null hypothesis is rejected which confirms that there is a statistically significant correlation between intensity and frequency of positive sentiment and students’ performance. The calculated two-tailed p-values are presented in Table 2.
Table 2: Two-tailed p-values of Positive Sentiment and Performance
| Tow-tailed p-value | ||
| Frequency and performance | .001 | Statistically significant correlation |
| Intensity and performance | .002 | Statistically significant correlation |
The next step in our analysis is classifying students’ sentiments into multiple classes beyond positive, negative, and neutral to investigate which classes can be used as predictive metrics for performance as the target value. The result of multiclass sentiment analysis is presented in the following section.
4.2. Multi-class sentiment analysis
The LIWC text analysis tool was applied to extract sentiment class from the corpora. The selected 63 dimensions of LIWC are in psychological, affective, and cognitive domains. The output features of each domain scale differently, in other words, the range of features in one domain might be greater than the features in another one. For example, the word count (WC) features are greater than the affective features such as negative emotion (negemo). To standardize the distribution of the data we applied the StandardScaler() algorithm from the SKLEARN library. This algorithm standardizes the features by removing the mean and scaling to the unit variance as shown in equation (5) [52]:
z = (x-u)/s (5)
where u is the mean and s is the standard deviation of the training sample.
The output features of LIWC have very high dimensionality, which makes it challenging to interpret the features and identify the main ones for developing predictive models. In order to reduce the dimension of the feature space to the most critical ones and preserving as much ‘variability’ (i.e., statistical information) as possible, we used the Principal Component Analysis (PCA) method. To determine the minimum number of principal components, we calculated the cumulative proportion of variances that the components explain. The acceptance level of cumulative variance can vary from 80% to 95% depending on the application. We identified 14 principal components with 92% variance which is an acceptable number to represent data. Figure 8 shows the Scree plot of the LIWC features.
The heatmap visualization of the 14 principal components and the 63 LIWC features is presented in Figure 9. The horizontal axis shows the total of 63 original features, the vertical axis denotes the identified 14 principal components and the color bar on the right side represents the correlation between the original features and the principal components. The lighter color indicates a more positive correlation exists between the features and the principal component and the darker colors show a negative correlation.
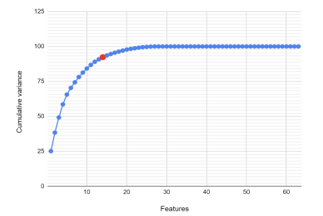 Figure 8: Scree Plot of LIWC Dimensions
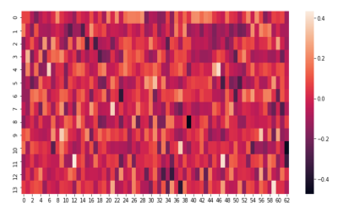 Figure 9: The Heatmap Visualization of Principal Components vs. Features
Table 3: Mapping of Principal Components (PCs) to the Original LIWC Features
| PCs | LIWC Feature | PCS | LIWC Feature |
| PC_1 | Anxiety | PC_8 | Negative emotion |
| PC_2 | Negations (e.g., no, not, never) | PC_9 | Perceptual process (hear) |
| PC_3 | Common verbs | PC_10 | Personal pronounce (she/he) |
| PC_4 | Analytical thinking | PC_11 | Exclamation marks |
| PC_5 | Drives (including affiliation, achievement, power, reward focus, risk focus) | PC_12 | Auxiliary verbs
|
| PC_6 | Insight (e.g., think, know, consider) | PC_13 | Certainty |
| PC_7 | Anger | PC_14 | Non-fluencies (e.g., Er, hm, umm) |
To interpret each principal component in terms of the original variables, we measured the magnitude of the coefficients for the original variables such that larger absolute values of coefficients confirm corresponding variables have more importance in calculating the component. The maximum absolute values of the coefficients are mapped to the original LIWC features in Table 3.
The table 3 lists the most principal features that determine the target value which is students’ performance.
The identified features can be applied to train the predictive algorithms to predict student’s performance based on their psychological, affective, and cognitive behaviors. Fitting the sample data into predictive models is not the scope of this study and will be considered in future work. In the next section, the result of thematic analysis (aspect analysis) on students’ positive sentiments is presented.
4.3. Aspect-based sentiment analysis
After identifying the correlation between the positive sentiments and the performance we explore the theme of the positive sentiments to identify whether students expressed a more positive emotion toward the course content or any other topic or experience. In order to identify the themes, we applied word frequencies algorithms to parse the positive sentiment vectors and extract unigrams and bigrams tokens. The frequency of unigrams and bigrams determines the dominant theme in students’ positive sentiments.
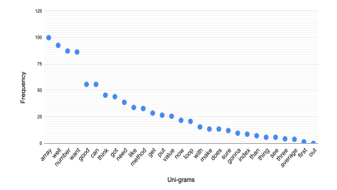 Figure 10: Frequency of Unigrams in Positive Sentiment Vectors (Comp>0)
Figures 10 and 11 plot the normalized frequency of the top 30 unigrams and bigrams of vectors with cv > 0. Based on these plots the dominant theme of word tokens that most frequently were uttered in students’ speech is specifically about the course content (i.e., Array, random number).
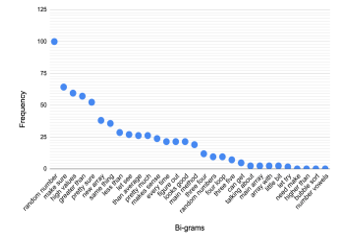 Figure 11: Frequency of Bi-Grams in Positive Sentiment Vectors (Comp>0)
The proportion of course-specific unigrams and bi-grams tokens in the vectors with cv>0 is presented in Figures 12 and 13.
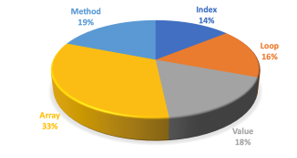 Figure 12: Course-Specific Unigrams in the Vectors with cv>0
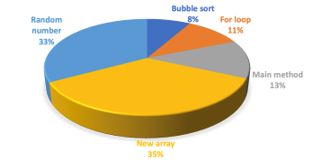 Figure 13: Course-specific Bi-Grams in the Vectors with cv>0
Based on the frequency analysis we conclude that students’ positive sentiments were mainly centered on course-related topics. This finding also confirms that the course design was effective in engaging the students in the teamwork activity since they were timed activities that allowed the well-prepared students to finish them within 35-40 minutes and they did not have extra time to discuss the topics outside the course content.
5. Discussion
The k-means clustering of the output sentiments showed that most vectors fall into the neutral class which is the cluster where cv=0 (figure 3.b). We further analyzed students’ speech to identify the correlation between the neutral sentiments (cv = 0) as well as the subjectivity level in their speech and their performance. We further conducted a thematic analysis on the negative sentiments’ corpora (vectors with (cv<0) to identify the themes in which students expressed negative emotions.
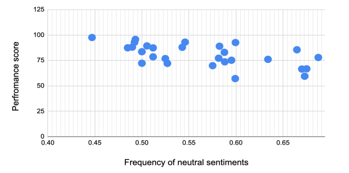 Figure 14: Frequency of Neural Sentiments vs Performance Score
To identify the correlation between neutral sentiments and performance we applied the VADER tool to extract neutral sentiments (cv =0). The regression plot of the frequency of neutral sentiments vs performance is presented in Figure 14. In this figure, the horizontal axis is the frequency of the neutral sentiments, and the vertical axis is the performance. We observe a homogeneous pattern in which by decreasing the performance the frequency of neutral sentiments increases.
The Spearman’s rank correlation coefficient was conducted and the calculated rs value is -0.61. It confirms there is a strong negative correlation between these two variables of neutral sentiments and performance.
Next, we analyzed the speech to identify the correlation between the level of subjectivity and performance. We applied TextBlob which is a rule-based sentiment analysis tool to extract the subjectivity metric [53]. The output subjectivity score is a float number between 0.0 and 1.0 where 0.0 is very objective and 1.0 is very subjective [54]. We applied Equation (6) to calculate the subjectivity score of each participant.
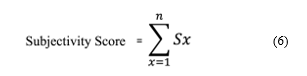 where, Sx is the subjectivity score of each vector (0<=Sx<=1), and n is the total number of vectors in each dataset.
The subjectivity level vs. performance score is plotted in Figure 15, where the vertical axis is the performance score, and the horizontal axis is the subjectivity score.
Based on Spearman’s rank correlation coefficient the calculated rs value is -.02, which shows a very weak negative correlation exists between the level of subjectivity and students’ performance.
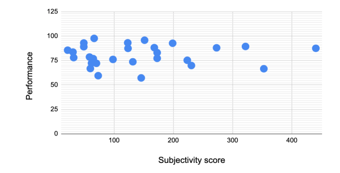 Figure 15: The Regression Plot of Subjectivity vs Performance Score
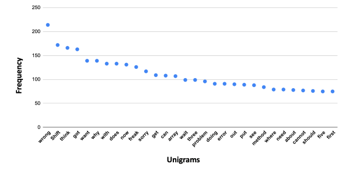 Figure 16: Frequency of Negative Sentiment Unigrams
Next, we conducted a thematic analysis on negative sentiment vectors (cv < 0) by calculating the frequency of unigrams. The result shows that students expressed more negative sentiments when they made mistakes and faced a problem in solving the problems in the class activities. For the purpose of this study, we have replaced the swear words with “shift” and “freak”.
The scatter plot of the frequency of the unigrams in the negative sentiment vectors (cv<0) (Figure 16) shows the most frequent token in negative sentiments is the word “wrong”.
And finally, it is worth mentioning that we did not find a statistically significant correlation between vectors with cv <0 and the performance score in this study.
6. Conclusion
Teamwork and collaboration are critical aspects of cognition and learning. In low-stake teams, students don’t have assigned roles and tasks since they are more focused on formative learning tasks than final artifact production. This might lead to a lack of contribution from some team members which as a result may lead to poor peer learning and performance. Assessing student’s contribution and performance in low stake teams is thus challenging for instructors. We posit that attitude constructs and individuals’ emotions can be assessed as an indicator of performance.
In the existing literature, emotion is mainly operationalized in the form of surveys and self-reports [13] which have their own challenges and may not necessarily provide reliable results. A major drawback of surveys is the lack of commitment from participants to provide responses.
Text analysis methods are another way to operationalize sentiments and have been applied to students’ textual conversations on discussion forums or blogs [41]. The drawback of these methods is that they are conducted on asynchronous conversations and don’t provide sentiment analysis in a real-time context. Speech is an alternative to capture emotional states. Recording and speech analysis have their own challenges, such a being demanding in terms of time, effort, and resources. Due to the environmental noise level, this method of data collection is not often used in educational settings.
In this article, we proposed a novel approach to operationalize students’ sentiments by recording their real-time speech in low-stake teams during class. Finding the correlation between different emotions and students’ performance can help in developing models to predict students’ performance at earlier stages of the semester to provide timely feedback to them and apply pedagogical interventions. The main goal of this research is to identify the correlation between students’ positive emotions as they work in teams during class with their performance.
The novelty of our research is sentiment analysis based on speech. This method has minimum distraction for students during the class activity and does not require additional time to answer the surveys. We implemented our method in a CS1 class during one semester with 28 participants. The result of data analysis showed the students who had higher scores in frequency and intensity of positive sentiments performed better in the course. On the other hand, the students who had more frequency in their neutral sentiments had lower performance scores in the course. We did not identify a statistically significant correlation between negative sentiments and students’ performance. The result of thematic analysis on the positive sentiments confirms that the theme of the students’ positive emotions were the topics related to the course content.
This study was conducted on 28 samples thus the results of the data analysis may not generalize to other courses or other populations of students. However, the results provide a basis for future research to analyze larger samples of data and for developing predictive models.
The result of this research can benefit both students and instructors. Instructors can identify at-risk students in earlier stages of the semester and help them develop their social skills and learning experience.
6.1. Future work
In the next phase of this research, we aim to collect more samples to study the correlation of positive emotion with performance. In this research, the principal components from multiple features (classes of emotion) were identified that determine the performance. In future work, we will fit these principal features to train machine-learning algorithms to predict performance.
Another future direction is to develop algorithms for automatic and real-time transcriptions of the speech to be able to provide real-time analysis as students work in teams. The development of such a system that provides emotional feedback to both instructors and students as they work in teams helps students to develop emotional awareness and adjust their behavior and interaction with peers. This system can also enable the instructor to observe the climate of different teams and cue them to provide timely feedback to students.
- N. Dehbozorgi, M. Lou Maher, M. Dorodchi, “Sentiment analysis on conversations in collaborative active learning as an early predictor of performance,” in 2020 IEEE Frontiers in Education Conference (FIE), IEEE: 1–9, 2020. DOI: 10.1109/FIE44824.2020.9274119
- G. Salomon, D.N. Perkins, “Chapter 1: Individual and social aspects of learning,” Review of Research in Education, 23(1), 1–24, 1998. https://doi.org/10.3102/0091732X023001001
- C. Latulipe, N.B. Long, C.E. Seminario, “Structuring flipped classes with lightweight teams and gamification,” in Proceedings of the 46th ACM Technical Symposium on Computer Science Education, 392–397, 2015. https://doi.org/10.1145/2676723.2677240
- N. Dehbozorgi, S. MacNeil, “Semi-automated Analysis of Reflections as a Continuous Course,” in 2019 IEEE Frontiers in Education Conference (FIE), IEEE: 1–5, 2019. DOI: 10.1109/FIE43999.2019.9028636
- M. Prince, “Does active learning work? A review of the research,” Journal of Engineering Education, 93(3), 223–231, 2004. https://doi.org/10.1002/j.2168-9830.2004.tb00809.x
- M.K. Smith, W.B. Wood, W.K. Adams, C. Wieman, J.K. Knight, N. Guild, T.T. Su, “Why peer discussion improves student performance on in-class concept questions,” Science, 323(5910), 122–124, 2009. https://doi.org/10.1126/science.1165919
- B.J. Millis, P.G. Cottell Jr, Cooperative Learning for Higher Education Faculty. Series on Higher Education., ERIC, 1997.
- P.D. Feden, R.M. Vogel, Methods of teaching: Applying cognitive science to promote student learning, McGraw-Hill Humanities, Social Sciences & World Languages, 2003.
- N.H. Narayanan, C. Hundhausen, D. Hendrix, M. Crosby, “Transforming the CS classroom with studio-based learning,” in Proceedings of the 43rd ACM technical symposium on Computer Science Education, 165–166, 2012. https://doi.org/10.1145/2157136.2157188
- N. Dehbozorgi, “Active learning design patterns for CS education,” in ICER 2017 – Proceedings of the 2017 ACM Conference on International Computing Education Research, 2017, doi:10.1145/3105726.3105741.
- N. Dehbozorgi, S. MacNeil, M. Lou Maher, M. Dorodchi, “A comparison of lecture-based and active learning design patterns in CS education,” in 2018 IEEE Frontiers in Education Conference (FIE), IEEE: 1–8, 2018. https://doi.org/10.1109/FIE.2018.8659339
- L. Liu, J. Hao, A.A. von Davier, P. Kyllonen, J.-D. Zapata-Rivera, A tough nut to crack: Measuring collaborative problem solving, IGI Global: 344–359, 2016. https://doi.org/10.4018/978-1-4666-9441-5.ch013
- E. Salas, D.L. Reyes, A.L. Woods, The assessment of team performance: Observations and needs, Springer: 21–36, 2017. https://doi.org/10.1007/978-3-319-33261-1_2
- D.R. Ilgen, J.R. Hollenbeck, M. Johnson, D. Jundt, “Teams in organizations: From input-process-output models to IMOI models,” Annu. Rev. Psychol., 56,517–543,2005.https://doi.org/10.1146/annurev.psych.56.091103.070250
- S.W.J. Kozlowski, B.S. Bell, “Work groups and teams in organizations.,” Handbook of psychology: Industrial and organizational psychology (Vol. 12, pp. 333–375). London, England: Wiley, 2013. https://doi.org/10.1002/9781118133880.hop212017
- S.W.J. Kozlowski, D.R. Ilgen, “Enhancing the effectiveness of work groups and teams,” Psychological Science in the Public Interest, 7(3), 77–124, 2006. https://doi.org/10.1111/j.1529-1006.2006.00030.x
- J. Mathieu, M.T. Maynard, T. Rapp, L. Gilson, “Team effectiveness 1997-2007: A review of recent advancements and a glimpse into the future,” Journal of Management, 34(3), 410–476, 2008. https://doi.org/10.1177/0149206308316061
- L.A. DeChurch, J.R. Mesmer-Magnus, “The cognitive underpinnings of effective teamwork: a meta-analysis.,” Journal of Applied Psychology, 95(1), 32, 2010. https://doi.org/10.1037/a0017328
- S. Anders, J. Heinzle, N. Weiskopf, T. Ethofer, J.-D. Haynes, “Flow of affective information between communicating brains,” Neuroimage, 54(1), 439–446, 2011. https://doi.org/10.1016/j.neuroimage.2010.07.004
- M.B. Schippers, A. Roebroeck, R. Renken, L. Nanetti, C. Keysers, “Mapping the information flow from one brain to another during gestural communication,” Proceedings of the National Academy of Sciences, 107(20), 9388–9393, 2010. https://doi.org/10.1073/pnas.1001791107
- K. Shockley, M.-V. Santana, C.A. Fowler, “Mutual interpersonal postural constraints are involved in cooperative conversation.,” Journal of Experimental Psychology: Human Perception and Performance, 29(2), 326, 2003. https://doi.org/10.1037/0096-1523.29.2.326
- R. Stevens, T. Galloway, J. Lamb, R. Steed, C. Lamb, Linking team neurodynamic organizations with observational ratings of team performance, Springer: 315–330, 2017. https://doi.org/10.1007/978-3-319-33261-1_20
- E. Hudlicka, “To feel or not to feel: The role of affect in human–computer interaction,” International Journal of Human-Computer Studies, 59(1–2), 1–32, 2003. https://doi.org/10.1016/S1071-5819(03)00047-8
- T.L. Dickinson, R.M. McIntyre, A conceptual framework for teamwork measurement, Psychology Press: 31–56, 1997.
- D.E. Wilkins, P.B. Lawhead, “Evaluating individuals in team projects,” ACM SIGCSE Bulletin, 32(1), 172–175, 2000. https://doi.org/10.1145/331795.331849
- L.K. Michaelsen, M. Sweet, “The essential elements of team?based learning,” New Directions for Teaching and Learning, 2008(116), 7–27, 2008. https://doi.org/10.1002/tl.330
- R. Stevens, T. Galloway, J. Lamb, R. Steed, C. Lamb, Linking team neurodynamic organizations with observational ratings of team performance, Springer: 315–330, 2017. https://doi.org/10.1007/978-3-319-33261-1_20
- E. Salas, C.S. Burke, J.E. Fowlkes, “Measuring team performance in the wild: Challenges and tips”, Psychology Press: 263–290, 2014.
- J.E. Driskell, E. Salas, S. Hughes, “Collective orientation and team performance: Development of an individual differences measure,” Human Factors, 52(2), 316–328, 2010. https://doi.org/10.1177/0018720809359522
- P.A. Schutz, R. Pekrun, G.D. Phye, “Emotion in education”, Elsevier, 2007.
- D.B. McLeod, “Research on affect in mathematics education: A reconceptualization,” Handbook of Research on Mathematics Teaching and Learning, 1, 575–596, 1992.
- A.C. Araújo-Simões, S.M. Guedes-Gondim, “Performance and affects in group problem-solving,” Revista de Psicología Del Trabajo y de Las Organizaciones, 32(1), 47–54, 2016. https://doi.org/10.1016/j.rpto.2015.09.001
- M. Munezero, C.S. Montero, M. Mozgovoy, E. Sutinen, “Exploiting sentiment analysis to track emotions in students’ learning diaries,” in Proceedings of the 13th Koli Calling International Conference on Computing Education Research, 145–152, 2013. https://doi.org/10.1145/2526968.2526984
- P. Maras, P. Kutnick, “Emotional and behavioural difficulties in schools: Consideration of relationships between theory and practice,” Social Psychology of Education, 3(3), 135–153, 1999. https://doi.org/10.1023/A:1009618701899
- M. Arguedas, T. Daradoumis, F. Xhafa, “Towards an emotion labeling model to detect emotions in educational discourse,” in 2014 Eighth International Conference on Complex, Intelligent and Software Intensive Systems, IEEE: 72–78, 2014. https://doi.org/10.1109/CISIS.2014.11
- D.T. Mizokawa, N. Hansen-Krening, “The ABCs of attitudes toward reading: Inquiring about the reader’s response,” Journal of Adolescent & Adult Literacy, 44(1), 72–79, 2000.
- S. Anders, J. Heinzle, N. Weiskopf, T. Ethofer, J.-D. Haynes, “Flow of affective information between communicating brains,” Neuroimage, 54(1), 439–446, 2011. https://doi.org/10.1016/j.neuroimage.2010.07.004
- M.B. Schippers, A. Roebroeck, R. Renken, L. Nanetti, C. Keysers, “Mapping the information flow from one brain to another during gestural communication,” Proceedings of the National Academy of Sciences, 107(20), 9388–9393, 2010.
- K. Shockley, M.-V. Santana, C.A. Fowler, “Mutual interpersonal postural constraints are involved in cooperative conversation.,” Journal of Experimental Psychology: Human Perception and Performance, 29(2), 326, 2003. https://doi.org/10.1037/0096-1523.29.2.326
- R. Pekrun, T. Goetz, A.C. Frenzel, P. Barchfeld, R.P. Perry, “Measuring emotions in students’ learning and performance: The Achievement Emotions Questionnaire (AEQ),” Contemporary Educational Psychology, 36(1), 36–48, 2011. https://doi.org/10.1016/j.cedpsych.2010.10.002
- H. Tarmazdi, R. Vivian, C. Szabo, K. Falkner, N. Falkner, “Using learning analytics to visualise computer science teamwork,” in Proceedings of the 2015 ACM Conference on Innovation and technology in computer science education, 165–170, 2015. https://doi.org/10.1145/2729094.2742613
- T. Ahmed, A. Bosu, A. Iqbal, S. Rahimi, “SentiCR: a customized sentiment analysis tool for code review interactions,” in 2017 32nd IEEE/ACM International Conference on Automated Software Engineering (ASE), IEEE: 106–111, 2017. https://doi.org/10.1109/ASE.2017.8115623
- K. Hood, P.K. Kuiper, “Improving student surveys with natural language processing,” in 2018 Second IEEE International Conference on Robotic Computing (IRC), IEEE: 383–386, 2018. https://doi.org/10.1109/IRC.2018.00079
- C. Hutto, E. Gilbert, “Vader: A parsimonious rule-based model for sentiment analysis of social media text,” in Proceedings of the International AAAI Conference on Web and Social Media, 2014.
- A. Amin, I. Hossain, A. Akther, K.M. Alam, “Bengali vader: A sentiment analysis approach using modified vader,” in 2019 International Conference on Electrical, Computer and Communication Engineering (ECCE), IEEE: 1–6, 2019. https://doi.org/10.1109/ECACE.2019.8679144
- V. Bonta, N.K.N. Janardhan, “A comprehensive study on lexicon based approaches for sentiment analysis,” Asian Journal of Computer Science and Technology, 8(S2), 1–6, 2019. https://doi.org/10.51983/ajcst-2019.8.S2.2037
- P. Bholowalia, A. Kumar, “EBK-means: A clustering technique based on elbow method and k-means in WSN,” International Journal of Computer Applications, 105(9), 2014.
- Y.R. Tausczik, J.W. Pennebaker, “The psychological meaning of words: LIWC and computerized text analysis methods,” Journal of Language and Social Psychology, 29(1), 24–54, 2010. https://doi.org/10.1177/0261927X09351676
- A.S. Hess, J.R. Hess, “Principal component analysis,” Transfusion, 58(7), 1580–1582, 2018. https://doi.org/10.1111/trf.14639
- J. Hauke, T. Kossowski, “Comparison of values of Pearson’s and Spearman’s correlation coefficient on the same sets of data,” 2011. https://doi.org/10.2478/v10117-011-0021-1
- M.M. Mukaka, “A guide to appropriate use of correlation coefficient in medical research,” Malawi Medical Journal, 24(3), 69–71, 2012.
- https://scikit-learn.org/
- A. Hasan, S. Moin, A. Karim, S. Shamshirband, “Machine learning-based sentiment analysis for twitter accounts,” Mathematical and Computational Applications, 23(1), 11, 2018. https://doi.org/10.3390/mca23010011
- S. Loria, “textblob Documentation,” Release 0.15, 2, 269, 2018.