Electrification of a Bus Line in Savona Considering Depot and Opportunity Charging

Adv. Sci. Technol. Eng. Syst. J. 6(5), 213–221 (2021);
 DOI: 10.25046/aj060523
A transition towards electrification of the public transport sector is ongoing in many cities around the world, as a response to global warming and pollution. However, the question is whether the current state of technology is already sufficient to replace the conventional buses with electric ones and if the existing charging facilities are appropriate to ensure the smooth operation of the buses. Therefore, this work aims to verify the technical feasibility of the electrification of an existing urban line. The purpose is achieved by evaluating a case study on a public transport bus line in the city of Savona, Italy. The average energy consumption of an electric bus operating in the considered line path is estimated in order to investigate the possible locations and sizes of the charging systems to install. The results show that the correct service operation of the electric buses can be achieved by installing one opportunity charger of at least 300 kW in one of the terminals or by installing three 43 kW charging ports in the depot.
1. Introduction
With the Paris Agreement in 2015, the members of the UNFCCC (United Nations Framework Convention on Climate Change) agreed to undertake ambitious efforts to keep the global average temperature rise well below 2°C above pre-industrial levels and to strive for an increase of less than 1.5°C within this century [1]. To reach this ambitious long-term goal, the nations must take action and reduce their overall carbon dioxide (CO2) emissions drastically. Regarding the European Union (EU) total emissions, the transportation sector makes a share of 21%, whereas road buses in combination with other heavy-duty vehicles contribute to 6% of the total emitted CO2 [2]. Following the electrification of the public transport sector could have a significant role in the transition towards more sustainable mobility. Evaluating the trend in the last years is quite clear how electric buses continue to witness a dynamic development with more than 460 000 vehicles on the world’s road in 2018, almost 100 000 more than in 2017 [3]. The electrification of public transport is not just an important step towards a free-CO2 transport sector, but it also entails positive effects on the living conditions of the inhabitants of the city. Indeed, it enhances air quality as well as noise pollution. [4]. Therefore, the transformation of the public transport sector is not just an important step towards sustainability but also an important sign to the future generation as a livable city of the future.
This electric transition however is bringing, opportunities as well as challenges. As a matter of fact, this technology, in addition to having very high capital costs, also required the installation of a proper design charging infrastructure [5]. In this global context, this paper proposes the electrification of a currently operated bus line in Savona, a small city in the northern part of Italy. More in detail, the different possible charging infrastructures that can be used to correctly electrified the line are evaluated. To achieve this scope, first of all, the energy consumed by an electric bus running on the considered line must be carried out. In the literature, the estimation of an electric bus energy consumption along a route is typically obtained considering standard driving cycles, for instance in [6] the energy consumption of city transit electric buses is computed using four international driving cycles. However, these general driving cycles do not take into account all the statistical uncertainties of the studied bus route. In other works, driving cycles are developed from real-world data, as reported in [7] presents a freeway driving cycle developed based on the traffic information in California. In the present work, instead, the energy consumption is found by simulating the driving cycle of an electric bus on two different sections of the considered line. The test sections are chosen to represent the entire characteristics of the road structure in the overall line. Therefore, this method allows us to develop a very precise driving cycle for the studied route, which considers also factors such as road slope and signs.
This paper is organized as follows. In section 2 the methodology used to estimate the consumption of electric buses along the considered lines is proposed. The methodology is applied to the case study in section 3 and the energy consumption of the line is estimated based on the previous considerations. In section 4 the possible charging systems solutions are discussed. Finally, in section 5 the conclusions are presented.
2. Methodology to assess the energy consumption
The overall energy consumption is determined by different factors. Not only the technical characteristics of the bus itself define the consumption of the bus, but also external factors and the characteristic of the route have a huge influence [8]. The following section describes the technical properties of the chosen bus, as well as the assumptions and equations used to calculate the overall energy consumption.
2.1. Test conditions
To get a proper assessment of the e-bus consumption, it is necessary to define the operating conditions assume for this study, such as vehicle occupancy level, service constraints, and climatic conditions.
- Occupancy rate: the e-bus is assumed to be ballasted at 2/3 of its payload which means it is transporting about 60 passengers ( ). Therefore, the overall mass of the loaded vehicle (m) is obtained in (1), by adding to the mass of the vehicle ( ), the mass due to the presence of passengers, assuming an average weight of 70 kg for each passenger ( .
 The external temperature is assumed to be equal to 5°C (average minimum temperature in Savona). This choice has been made to consider the worst-case scenario in terms of auxiliary power consumption, as a matter of fact, it has been widely proved in the literature that the highest secondary is achieved by the heating system.
- The actual existing service provided by TPL (Trasporto Pubblico Locale) for Line 6 cannot be degraded by the electrification of the line.
2.2. Energy consumption computation model
In the following the model and the equations necessary to evaluate the speed, power, and energy consumption profiles of the e-bus over the chosen route are described. The theoretic model used is based on the motion equation reported in (2) [9].
![]() where ? is the resultant of active forces, we will refer to this quantity as tractive effort, ? is the resultant of passive forces also called resistances, is the equivalent mass and ? is the vehicle acceleration.
where ? is the resultant of active forces, we will refer to this quantity as tractive effort, ? is the resultant of passive forces also called resistances, is the equivalent mass and ? is the vehicle acceleration.
Through (3) the equivalent mass of the e-bus is calculated. Therefore, the equivalent mass is the gross mass of the vehicle augmented by a factor which must weigh up the inertial momentum of all the rotating masses inside the vehicle such as wheels, shafts, and axles [10].
![]() As regards the total resistance to the bus motion, in the present analysis three terms have been taken into account: the rolling resistance, the aerodynamic resistance, and the grade resistance shown respectively in (4), (5), and (6).
As regards the total resistance to the bus motion, in the present analysis three terms have been taken into account: the rolling resistance, the aerodynamic resistance, and the grade resistance shown respectively in (4), (5), and (6).
The rolling resistance is due to the continuous deformation of the tire/wheel during its rotation and is computed through (4).
![]() where is the pressure of the wheels in bars, is the speed in m/s, is the vehicle mass in kg and, g is the acceleration of gravity in m/s2.
where is the pressure of the wheels in bars, is the speed in m/s, is the vehicle mass in kg and, g is the acceleration of gravity in m/s2.
The aerodynamic resistance represented in (5), also called wind or air resistance, depends on the square of the vehicle speed ( ), the density of the medium in which the vehicle is moving which in this case is air ( ), on the frontal area of the vehicle ( ) and its shape, considered through a drag coefficient ( ). In the calculations, for reasons of simplicity, the air density is assumed constant and the wind speed equal to zero.
![]() Finally, the grade resistance appears when the vehicle is traveling over a surface with a positive or negative slope ? and it is computed by (6).
Finally, the grade resistance appears when the vehicle is traveling over a surface with a positive or negative slope ? and it is computed by (6).
![]() Regarding the analysis of the power consumption of the bus, the formula varies depending on the sign of the tractive effort. If a positive tractive effort is applied by the motors to the wheels, it means that the vehicle is accelerating, on the contrary, a negative tractive effort corresponds to a braking condition; finally, a nil tractive effort implies that the motor is turned off (or decoupled from the wheels) and the vehicle naturally decelerated because of the external resistances. Equations (7) and (8) describe the interrelations that apply in each case in order to compute the electric power provided by the motor.
Regarding the analysis of the power consumption of the bus, the formula varies depending on the sign of the tractive effort. If a positive tractive effort is applied by the motors to the wheels, it means that the vehicle is accelerating, on the contrary, a negative tractive effort corresponds to a braking condition; finally, a nil tractive effort implies that the motor is turned off (or decoupled from the wheels) and the vehicle naturally decelerated because of the external resistances. Equations (7) and (8) describe the interrelations that apply in each case in order to compute the electric power provided by the motor.
 Where is the value of the tractive effort, v is the speed, represents the efficiency in traction, is the value of the power absorbed by the auxiliaries, is the efficiency in braking and represents the amount of recoverable energy. Since during braking the value of the tractive effort is negative, consequently the value of the power is also negative and this means that there is a recovery of energy in that instant of time.
The value of the current provided by the supply system (in this case the battery) is calculated in (3), where V is the supply battery voltage.
![]() Lastly, the cumulative energy required by the bus is obtained by taking the integral of the electric power over time. However, since in this study, the procedure is based on discrete-time values with a time interval of 1 s, for the energy computation a backward integration is used and reported in (10).
Lastly, the cumulative energy required by the bus is obtained by taking the integral of the electric power over time. However, since in this study, the procedure is based on discrete-time values with a time interval of 1 s, for the energy computation a backward integration is used and reported in (10).
![]() where n is the discretization index and indicates the electric power exchanged at the n time instant.
where n is the discretization index and indicates the electric power exchanged at the n time instant.
2.3. Characteristics of electric bus
The chosen electric bus model, for the analysis, is the eCitaro developed by Mercedes-Benz. This model is a 12 m long bus with a mass of 15800 kg. It is completely electric and equipped with an onboard lithium-ion battery composed of 15 modules, each one made of 12 battery cells. The nominal maximum power this bus model can provide is 250 kW, while the supply battery voltage is 400 V. The traction battery must provide the energy also to supply the consumption of the auxiliary service, i.e., rear and front lights, climatization, and radio [11]. The maximum amount of recoverable energy through the regenerative braking system is set equal to 65 %, while the efficiency in traction and braking are considered both equal to 80% in order not to have unbalanced distributions of power between the acceleration mode and the deceleration one. The mass of the vehicle, with the assumed number of passengers declared previously, is 20 t, thus leading to a value for the equivalent mass equal to 23.2 t. For safety and comfort reasons, the maximum acceleration of the bus is limited to 0.8 m/s2 while for braking deceleration the constraint is less restrictive, and its value can reach values up to 1.5 m/s2. Given the values of the equivalent mass and maximum acceleration, it is possible to compute the maximum tractive effort at the starting phase by (11), which is equal to 18.56 kN.
![]() Lastly, the obtained maximum tractive effort must be compared with the maximum adherence force, which is a limit of the tractive effort which must not be overcome otherwise slippage occurs. However, since the speed of the bus is rather small because it is limited to 50 km/h by the Italian laws about speed limits in the urban environment, and because the value of adhesion coefficient is high (equal to 0.6) due to the contact between the tires and the street, the adhesion limit value is never reached and so the bus will never work in slip conditions.
Lastly, the obtained maximum tractive effort must be compared with the maximum adherence force, which is a limit of the tractive effort which must not be overcome otherwise slippage occurs. However, since the speed of the bus is rather small because it is limited to 50 km/h by the Italian laws about speed limits in the urban environment, and because the value of adhesion coefficient is high (equal to 0.6) due to the contact between the tires and the street, the adhesion limit value is never reached and so the bus will never work in slip conditions.
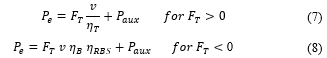
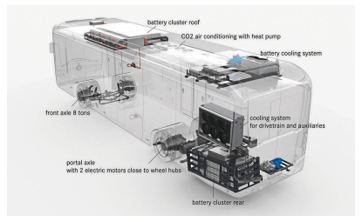 Figure 1: e-Citaro scheme [11].
The eCitaro manufactured by Mercedes-Benz has been considered in this study, since during the last two years, this model has taken over the market of electric buses and it is common in different European countries like Germany, Luxembourg, Sweden, and Norway [12]. Moreover, it has the most similar characteristics to the conventional bus currently employed by TPL in the selected line. Indeed, the buses currently working in Savona for the public transport services are the Citaro C2 models, produced by Mercedes-Benz too. They are gasoline buses having an internal combustion engine able to provide a nominal power of 220 kW.
The main advantages of choosing an electric bus fleet instead of a gasoline one are the reductions in pollution and fuel costs. Furthermore, the electric motors are less loud than the internal combustion engine and if well-displayed, the recharging process for an electric bus is more efficient and safer than the gasoline one in terms of reliability. The feature of regenerative braking must not be forgotten as it represents a great advantage compared to the conventional buses which are not able to recover energy braking. All these advantages combined confirm that if a modernization of the bus lines is needed, one better option will be to replace the gasoline buses with electric ones.
All the parameters value necessary for the simulation are reported in Table I. Using an Excel Spreadsheet, the overall electric energy consumed by the vehicle along the chosen sections was estimated.
Table 1: Simulation values
| Bus length | 12 m | |
| Mass vehicle | 15 800 kg | |
| Maximum number of passengers | 85 | |
| Average mass of passengers | 70 kg | |
| Maximum comfortable deceleration | -1.5 m/s2 | |
| Maximum comfortable acceleration | 0.8 m/s2 | |
| Maximum motor power | 230 kW | |
| Battery voltage | 400 V | |
| Percentage of recoverable energy | 65% | |
| β | Equivalent mass factor | 0.16 |
| Braking efficiency | 80% | |
| Traction efficiency | 80% | |
| Maximum tractive effort | 18.56 kN | |
| Power absorbed by auxiliaries | 22 kW | |
| Shape coefficient | 0.6 | |
| Overall mass of the vehicle (considering 60 passengers) | 20 000 kg | |
| Frontal area | 8.7 m2 | |
| Tyre pressure | 9 bar |
3. Energy consumption estimation
The considered Line 6, depicted in Figure 2, connects the bus stations in Porto Vado to “Via Alessandria” in Savona for an overall trip 7.9 km long. While the first part of the line is passing through the city center, the other and longer part of the line heads to the west following the seafront of Savona. For the energy consumption estimation, two representative and very different sections in terms of ground characteristics have been analyzed. We will refer to the first one (between the yellow pointers) as Section A and to the second one (between the red pointers) as Section B.
 Figure 2: Bus Line 6: From Porto Vado to Via Alessandria in Savona (Italy).
3.1. Analysis of Section A
The section analyzed in the following paragraph is an extract from the downhill part of Line 6 TPL, starting from Via Paolo Boselli and reaching its destination of “Via XX Settembre”, with an intermediate stop in “Piazza del Popolo” after 300 m. In the 700 m long section, some crossings and turnings are present. Therefore, to make the simulation more realistic and consequently much more consistent and reliable, some braking sections are considered in correspondence of pedestrians crossing and traffic lights. For instance, as can be seen from the speed profile reported in Figure 4, 3 deceleration and 2 complete stops are simulated along the section. The first deceleration is performed after 140 m from the beginning, and it is due to the fact that the bus must decrease its speed to perform a right turn. Then it accelerates until it reaches a speed of about 40 km/h but at that moment another deceleration phase starts after 270 m because the bus must stop at the intermediate station of “Piazza del Popolo”. The stopping time at this station has been set equal to 20 sec. After few seconds from the restart, the bus must stop again at a red traffic light. This second stopping time is set equal to 5 seconds. Finally, in the last part of Section A, the driver can reach the maximum speed of 50 km/h and keep it for a few seconds before arriving at the final stop of this section.
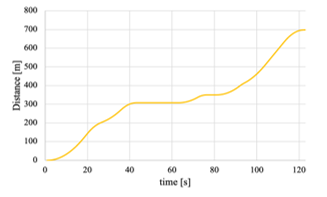 Figure 3: Space Profile of Section A
In Figure 3 the space profile of the section is shown, and we can see that the total time spent to complete the path is equal to 123 seconds.
In Figure 5 the evolution of the electric power as a function of time, from which the electric energy consumption is derived. As expected, in the first part electric power increases up to its maximum value since at this moment the motor must provide the highest tractive effort to let the vehicle reach the speed limit of 50 km/h. Instead, negative values of electric power indicate that at that moment the regenerative braking phase is ongoing.
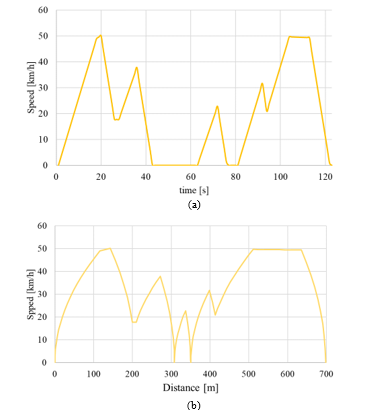 Figure 4: Speed Profile of Section A a) speed vs time and b) speed vs distance.
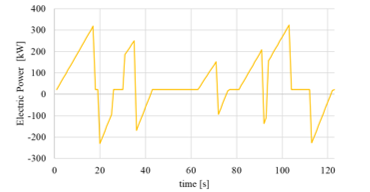 Figure 5: Electric Power profile of Section A
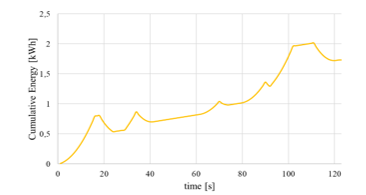 Figure 6: Cumulative energy consumption in Section A.
Finally, the total energy required by the bus is reported in Figure 6 and it can be concluded that to cover the 700 m related to Section A, 1.73 kWh are necessary, which correspond to consumption of about 2.47 kWh per km, in line with that find in [13].
3.2. Analysis of Section B
The second considered section of Line 6 TPL goes from the bus stop Villa Zanelli to Via Nizza (Camping) until the final destination Via Nizza 126. This path differs from section A primarily because of its location along the seaside, on Strada Statale 1 Via Aurelia (SS 1), instead of the city center. Consequently, Section B is flatter and characterized by a straight path on which, however, the speed limit is 50 km/h, since it is always an urban road [14]. The whole Section B has a total length of 1,450 m and the middle bus station Via Nizza (Camping) is located after 270 m starting from the first bus station Villa Zanelli.
The whole Section B lays on a priority road with no traffic lights intersections but with two rotaries and several crosswalks. Within the model, a deceleration down to 20 km/h is assumed before entering the rotaries that are located after 200 m and 968 m starting from the first bus stop ‘Villa Zanelli’. In the whole path of Section B, there are ten crosswalks on which the bus has to decelerate in case of a pedestrian wants to cross the street. However, since the path does not have any curves, the driver of the vehicle has a wide forward view on the road, therefore, in the computation, it is not assumed to stop on every crosswalk but only to slow down to 10 km/h or less. Finally, before the final bus stop, the bus must pass a fork in the road. However, as the bus has the right of way the intersection is not taken further into account.
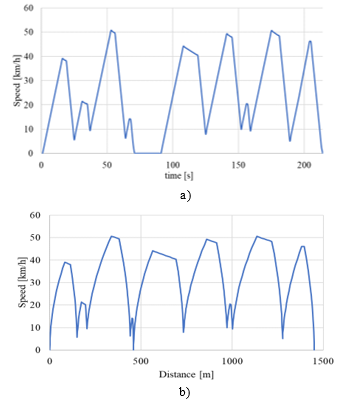 Figure 7: Speed profile in Section B a) speed vs time and b) speed vs distance.
An approximated gradient profile is included in the calculation, even though the slope is very low. The complete profile is generated by Google Earth and then is approximated with a positive value of 0.23% for the first 1300 m and a negative value (which represent a downhill) of 0.67% for the resting 300 m. Finally, the bus is assumed to stop at ‘Via Nizza (Camping)’ for 20 seconds.
From the results reported from Figure 7 to Figure 9, it is possible to conclude that the bus needs 3 min and 34 seconds to cover this section. In particular, the bus reaches Via Nizza (Camping) after 1 min and 11, and after a 20 second stop, it takes another 2 minutes to run the last part. The speed profile in Figure 7 is characterized by many peaks, which means many changes in velocity caused by the rotaries and crossings the bus is passing by. The maximum speed of 50 km/h is reached three times.
Overall it is visible, that due to the number of crossings and rotaries, the bus does not have the driving distance in between the traffic interactions to accelerate much further than 50 km/h. Regarding the fact that the road is located close to the beach and right next to camping opportunities, it can be assumed that it is a rather touristic area that many walkers pass. Additionally, the fact that there is a cycle path right next to the road clarifies that driving faster than 50 km/h would bring dangers with it.
As Figure 8 shows, the electric power taken by the supply system (the battery) is strongly varying over the path. The fluctuation can be traced back to the situation, whether the bus is in traction (tractive effort > 0) or braking (tractive effort < 0) – as it can be observed in Figure 9. If the bus is in traction mode, the supply system is providing not only the needed power for the wheels but also the power absorbed by the auxiliaries. The bus is always consuming the power needed for its climate system and other extra facilities, even though the tractive effort is zero or the bus is not moving (speed = 0 km/h). The electric power assumes negative values when the bus is braking because in those moments a percentage of energy is sent back from the wheels to the battery thanks to the regenerative braking technology. However, due to technical limitations, there is no regenerative braking when electric vehicles are running at low speed; in this study, this limit is set at 10 km/h.
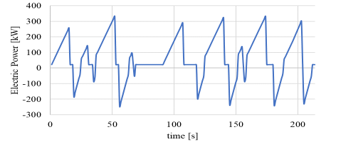 Figure 8 Electric power along Section B.
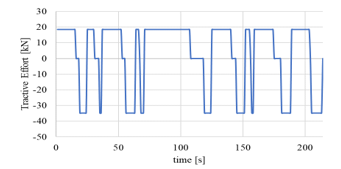 Figure 9: Tractive effort along Section B.
As can be seen from Figure 10, the overall energy consumption along Section B is 3.8 kWh which corresponds to 2.62 kWh per km. Compared to the average energy consumption of 2 kWh/km found in [15], it is a quite higher result which can be justified by the presence of many influencing factors. First of all, as already mentioned, the bus is consuming power, even when it is stopped at the bus station because it has to supply the auxiliaries (22 kW). For instance, the 20 seconds stopping time at the station Via Nizza (Camping) results in power consumption of 0.12 kWh. Additionally, the high number of crossings and rotaries present along the path forces the bus to continuously decelerate and accelerate. The high power required to accelerate leads to high energy consumption. A smoother driving style that reduces the deceleration and acceleration rates could lead to energy savings.
In order to extrapolate the energy consumption of the entire line, a weighted average of the two energy consumptions found for Section A and Section B is computed. Since the line is prevalently located along the seaside rather than in the center of the city, for the computation of the overall consumption Section B weights more (75%) than section A (25%). Therefore, the total energy consumed along the 7.9 km trip between Porto Vado and Via Alessandria is estimated to be about 20.3 kWh. The results coming from this section are summarized in Table.
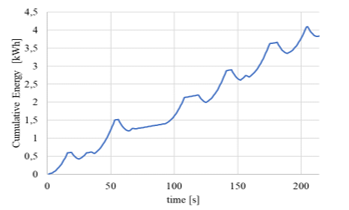 Figure 10: Cumulative energy consumption at section B.
Table 2: Average energy consumption
| Section | Length | Request
[kWh/km] |
% overall path | Weighted Average
[kWh/km] |
| A | 700 | 2.47 | 25% | 2.57 |
| B | 1 450 | 2.62 | 75% |
4. Charging Systems Sizing
An electric bus can be charged with two main charging technologies: depot and opportunity charging. Depot charging technology fills the fleet of electric buses at the depot through plug-in connectors [16]. The charging power for each connector ranges from 40 up to 150 kW. The rated power of this charging system mainly depends on whether AC or DC charging system is installed. If an AC technology is chosen, the onboard charger of the vehicle must be used to operate the AC-DC conversion, and the off-board structure will only include power and communication cables, metering, and protection devices. AC charging systems can provide a maximum power of 43 kW (86 kW if two Type2 plugs are inserted in the vehicle). If higher charging rates are necessary or if the electric buses which compose the fleet are not equipped with the onboard charger, a DC charging system (mode 4) must be used. In this case, the conversion stage is performed offboard the vehicle, inside the charging system. On one side this will result in higher achievable power rates on the other hand this will lead to higher investment costs. In DC charging systems, the power limit is mainly imposed by the cable and the connector; as a matter of fact, the Combo 2 (CCS2) connector can provide a maximum of 200 A without the need for special and expensive liquid cooling systems. To not have a too high impact on the public utility grid, the output current is limited to 150 A, which corresponds to a nominal power of about 100 kW considering the average battery voltage of the actual electric buses on the market. It can occur that to complete and provide a proper service electric buses require additional occasional recharges that take advantage of the halt times at the terminus and/or at the stops. The charging system which provides this type of facility takes the name of opportunity charging. The opportunity charging uses overhead pantographs which can support charging powers up to 600 ÷ 750 kW [17].
In this paragraph, the two charging technologies for the chosen electric buses of Line 6 TPL will be sized. The most important data necessary to display the analysis are the total energy consumption on the entire line, its timetable, and the battery and charging characteristics of the vehicle.
Following the information found on the timetable of Line 6 TPL, it can be understood that to ensure the service 3 buses must be used at the same time. In the following, we will refer to these three buses as Bus 1, Bus 2, and Bus 3. All the buses start and end in the two stations of Via Alessandria and Porto Vado, however, some of them perform small deviations along the day. The total number of one-way trips between Porto Vado and Via Alessandria for these three buses are respectively equal to 32, 30, and 25.
The eCitaro buses are provided with lithium-ion batteries having different levels of battery capacity: 150, 200, and 250 kWh, in fact, they are made of a variable number of modules ranging from 6 up to 10. The standard charging system for eCitaro buses is the Combo2 plug-in system, but there is also the possibility to adopt the pantograph system which is sold as special equipment.
4.1. Depot charging
In this section, the charging system that must be installed in the depot in order to assures a correct service of Line 6 is analyzed. An example of the layout that the depot charging infrastructure can assume is shown in Figure 11 b). In Figure 11 a), instead, the energy distribution scheme is sketched.
TPL already rents a depot in a public area installed in Via Valletta San Cristoforo, Savona, approximately located in the midpoint of the trip. Therefore, this depot will be the location of the charging system. Since the depot is located in a public area, some technical issues are to be discussed properly [13]. First, it must be considered that other large consumers may also take energy from the same grid thus limiting the amount of energy that can be used to recharge the fleet. Then, the European Union stated restrictions on the maximum power to be installed in a charging depot and this threshold cannot be overcome for legal reasons. Consequently, in the depot, it will be installed an AC charging system with rated power for each port equal to 43 kW.
To not oversize the number of required charging ports, and hence to not waste money, the schedule of all the electric buses recharging times becomes a crucial feature of this study. In order to size the depot charging, the following assumptions are made:
- All the electric buses of the fleet made have the same battery capacity which in the first case is set at 250 kWh, then to 200 kWh, and finally to 150 kWh.
- A safety SoC threshold has been set at 20%, and this amount of energy is necessary for example to return to the depot in case of emergency conditions.
- All buses leave the depot fully charged (SoC 100%).
- The buses rely only on the depot charging for the operation.
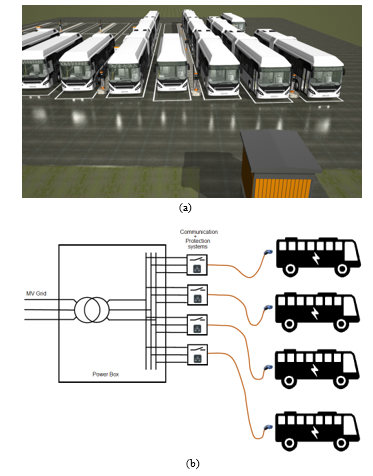 Figure 11: Example of depot charging infrastructure a) layout and b) electric scheme.
CASE 1: The buses are equipped with a 250 kWh battery. Under the before-mentioned assumptions, a single bus is able to do nine one-way trips before reaching a battery percentage level below the threshold of 20%. As a bus can approximately drive four hours before having to drive back to the depot, another bus can use this time for charging its battery. Within that time, the battery level of the bus can reach values up to 80%, considering that the bus arrives at the depot having 20% of battery and the depot has a recharging system of 43 kW with a charging efficiency equal to 88%. So, after the second bus has covered its part of the runs, the bus that was waiting at the depot becomes the one in service while the other heads to the depot to recharge its batteries. By keeping this alternate on during the whole day, two electric buses for each currently employed diesel bus are needed, so the fleet will be composed of six electric buses in total. Three charging ports must be installed in the depot, one for every two electric buses.
CASE 2: The battery capacity is decreased at 200 kWh. In this case, a bus can cover only seven trips without reaching the level of 20% of battery and according to the timetable, this means a service time equal to three hours. By repeating the same calculations as in the previous case, the fleet will be composed of thirteen buses. If instead the daytime charging at the depot is allowed, the number of buses needed will decrease as described. In three hours, the battery of 200 kWh can recharge to a level of 80% by making the same assumption made before for a battery of 250 kWh. So, after the second block of three hours, the two buses overlap and this continuous cycle is repeated throughout all the daytime, leading to the conclusion that again two electric buses for each currently employed diesel bus are needed. Therefore, even using electric buses equipped with batteries having a capacity of 200 kWh, the electric fleet must be composed of six vehicles.
CASE 3: finally, the case of batteries with a capacity of 150 kWh is brought into the analysis. In this case, a single bus can cover five trips with a corresponding amount of time of two hours. Therefore, a bus can recharge up to 70% of its battery at the 43kW charging pole at the depot with an efficiency of 88%. Since the battery capacity is very low, the overlapping of two buses is not fitting for the case, as the iterative decrease of the battery percentage during the service for the two buses leads to an incompletion of the daytime service (two buses are able to cover only 65% of the daytime service). For this reason, three buses are needed, with two buses recharging simultaneously while the other one is providing the service. In this case, the buses can always run into service having a 100% battery capacity, thanks to the fact that having two buses waiting in the depot, the overlapping of one of the two with the exhausted one enables the second bus to further recharge its batteries for supplementary two hours. By extending this observation to the three currently employed buses, the result is an electric fleet composed of nine buses, which means 3 electric buses for each diesel one.
Table 2: Results depot charging
| #Case | Battery Capacity | # necessary
e-buses |
# installed 43 kW charging ports |
| Case 1 | 250 kWh | 6 | 3 |
| Case 2 | 200 kWh | 6 | 3 |
| Case 3 | 150 kWh | 9 | 3 |
In conclusion, the battery capacity has a significant impact on the number of buses needed to substitute a conventional bus if the electrification relies only on the depot charging technology.
4.2. Opportunity charging
As an alternative to the traditional depot charging system, opportunity charging is gaining in popularity. The difference between the two charging technologies can be simplified in a way that opportunity charging is taking place during the service at on-street charging stations [18]. Given the higher power level, this charging system can provide, it follows that the charging duration gets significantly shortened [17]. The main components of an opportunity charging system are sketched in Figure 12.
Regarding the timetable of the 3 routes of Line 6 TPL, the vehicles are having regular breaks between five and twenty minutes at the bus station Porto Vado. The parking area in that bus station is spacious, and hence the buses can take their break without disturbing the traffic. Therefore, the installation of a pantograph for opportunity charging at this place is technically possible. To electrify the routes, without passengers noticing a change in the schedule of Line 6 TPL, the break at Porto Vado is consequently chosen for opportunity charging.
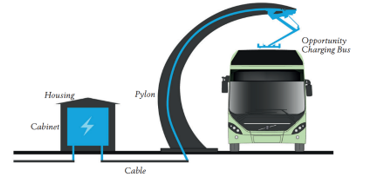 Figure 12: Example of opportunity charging infrastructure.
To determine the necessary battery capacity of the bus as well as the charging power of the opportunity charging station, the timetables of the three routes are evaluated. In particular, the overall timetable is characterized by regular stops at the station Porto Vado for 10 minutes. Between two consecutive stopping times in Porto Vado, therefore the vehicle must perform a round trip for an overall length of 15.8 km (2 times 7.9 km). Based on the energy consumption coming from the previous section, to cover this path the bus consumes 40.6 kWh (2 times 20.3 kWh).
The charging time is determined by the breaking times scheduled through the timetable of Line 6 TPL. This time is assumed to be 2 min shorter than the scheduled one in order to take into account the connection and the disconnection maneuvers to connect to the pantograph. Therefore, the bus charges every time it reaches Porto Vado for an average time of 8 minutes (10 min minus 2 min as a buffer). Therefore, in this time interval, the charging system must provide the bus enough energy to manage the next trip without exceeding the minimum battery SoC limit of 20%. The opportunity charging system can usually have different power rated: 150 kW, 300 kW, 450 kW up to 600 kW [17]. Considering the available charging time in Porto Vado , and the required energy to cover a round trip , in (12) the necessary charging power is computed. The result shows that a pantograph of at least 300kW is needed.
![]() Looking at the overall path of the buses operating on line 6 reported in [19], as before mentioned, the three conventional buses must make some small deviations from the usual path. However, all the three buses during their operation stop at Porto Vado station for some minutes, and this interval of time is used to charge the battery through the installed opportunity charger. Figure 13 illustrates the SoC of each of these three buses as a function of the covered distances. Each vertical upwards course represents a charging operation at Porto Vado. As the halt time is most of the time 10 minutes long, the trend of the battery SoC is characterized by a regular pattern due to the same amount of energy supplied in each charging event. While the charging-discharging cycle of the Bus 3 is repetitive, Bus 2 is showing more irregularities. Those can be traced back to the higher number of deviations that this bus has to perform, which will cause more irregularities in the stopping times at Porto Vado. For instance, Bus 2 is facing the absence of stops in Porto Vado in the evening runs, so the longer stop it has after 250 km is used to counterbalance the lack of charging events from 213 km up to 244 km. Bus 1, instead, is facing shorter breaks in the morning hours. To ensure sufficient SoC, Bus 1 must completely charge its battery at Porto Vado before starting its last trip in the evening. Finally, Bus 3, which is starting its journey from Porto Vado in the morning has to arrive at the bus station around 15 minutes earlier in order to completely fill its battery. The extra time needed for charging at the Pantograph at Porto Vado as well as driving there off-schedule causes extra costs for personnel that needs to be considered. For the calculations, it is, in addition, assumed that all the buses during night drive to their depot at Via Valletta San Cristoforo, so the extra energy necessary to cover this path to go to the depot has been considered.
Looking at the overall path of the buses operating on line 6 reported in [19], as before mentioned, the three conventional buses must make some small deviations from the usual path. However, all the three buses during their operation stop at Porto Vado station for some minutes, and this interval of time is used to charge the battery through the installed opportunity charger. Figure 13 illustrates the SoC of each of these three buses as a function of the covered distances. Each vertical upwards course represents a charging operation at Porto Vado. As the halt time is most of the time 10 minutes long, the trend of the battery SoC is characterized by a regular pattern due to the same amount of energy supplied in each charging event. While the charging-discharging cycle of the Bus 3 is repetitive, Bus 2 is showing more irregularities. Those can be traced back to the higher number of deviations that this bus has to perform, which will cause more irregularities in the stopping times at Porto Vado. For instance, Bus 2 is facing the absence of stops in Porto Vado in the evening runs, so the longer stop it has after 250 km is used to counterbalance the lack of charging events from 213 km up to 244 km. Bus 1, instead, is facing shorter breaks in the morning hours. To ensure sufficient SoC, Bus 1 must completely charge its battery at Porto Vado before starting its last trip in the evening. Finally, Bus 3, which is starting its journey from Porto Vado in the morning has to arrive at the bus station around 15 minutes earlier in order to completely fill its battery. The extra time needed for charging at the Pantograph at Porto Vado as well as driving there off-schedule causes extra costs for personnel that needs to be considered. For the calculations, it is, in addition, assumed that all the buses during night drive to their depot at Via Valletta San Cristoforo, so the extra energy necessary to cover this path to go to the depot has been considered.
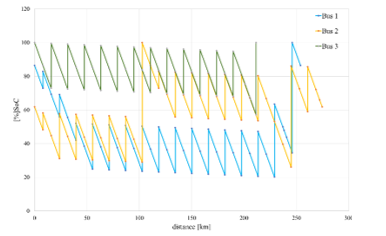 Figure 13: Battery Charge Level of the buses on the investigated routes.
The eCitaro is available in different versions and with different battery capacities. As Figure 13 shown, the basic model (150kWh) of the lithium-ion battery is already sufficient to meet the requirements of Line 6 TPL. As well it can be observed that according to the results the battery SoC is never lower than 20 %. So, the opportunity charging system fulfills the set safety requirements.
Concluding, it is technically achievable to fulfill the timetable using only one opportunity charging station with a capacity of 300kW at Porto Vado in combination with the eCitaro equipped with a standard battery of 150 kWh.
5. Conclusion
This work aims to analyze the electrification of a conventionally operated bus line. Precisely, the focus is on the bus Line 6 operating between the stations Via Alessandria and Porto Vado in Savona, Italy. Therefore, the overall energy consumption on this specific bus route is first computed and then used to evaluate possible depot and opportunity charging infrastructure.
The model results show that it is possible to substitute the conventional buses of Line 6 TPL connecting Porto Vado and Via Alessandria with electric buses and corresponding charging infrastructure. Based on the energy consumption of two characteristically different sections on the assigned Line 6 TPL path, the overall energy consumption of an eCitaro shuttling between Porto Vado and Via Alessandria is upscaled. The calculations lead to the energy consumption of 20.3 kWh for the 7.9 km long one-way trip between Porto Vado and Via Alessandria. Corresponding the electric bus has an average energy consumption of 2.57 kWh/km.
In order to stick to the present timetable of the chosen routes, there are three possible solutions for electrification. According to the first approach, the conventional buses could be replaced by e-buses using depot charging technology. The depot charging system is composed of three charging ports of 43 kW each. From the results, it can be seen that this scenario would imply that each conventional bus needs to be replaced by at least two electric ones with a battery capacity of 250 kWh. As an alternative to reduce the number of needed vehicles, opportunity charging is introduced as the second possible electrification approach. Based on the halt times available at the terminals in the timetable of Line 6 and the energy consumption along the route, the results prove that it is possible to substitute each conventional bus with one e-bus exclusively relying on opportunity charging systems installed in Porto Vado terminal with a power rate of at least 300 kW. Merging both approaches leads to a third possible solution which could ensure sufficiently charged batteries, increase the safety against failures as well as the efficiency in operation. The analysis of this mixed scenario as well as the cost analysis of the different solutions will be part of further research.
Conflict of Interest
The authors declare no conflict of interest.
- Adoption of the Paris Agreement, Paris, 2015.
- Regulation (EU) 2019/631 of the European Parliament and of the Council, 2019.
- IEA, Global Ev Outlook 2019 – Analysis – IEA, Paris, 2019.
- The Impact of Electric Buses On Urban Life, 2019.
- S. Majumder, K. De, P. Kumar, B. Sengupta, P.K. Biswas, “Techno-commercial analysis of sustainable E-bus-based public transit systems: An Indian case study,” Renewable and Sustainable Energy Reviews, 144, 111033, 2021, doi:10.1016/J.RSER.2021.111033.
- X. Zhao, Y. Ye, J. Ma, P. Shi, H. Chen, “Construction of electric vehicle driving cycle for studying electric vehicle energy consumption and equivalent emissions,” Environmental Science and Pollution Research 2020 27:30, 27(30), 37395–37409, 2020, doi:10.1007/S11356-020-09094-4.
- H. He, J. Guo, N. Zhou, C. Sun, J. Peng, “Freeway Driving Cycle Construction Based on Real-Time Traffic Information and Global Optimal Energy Management for Plug-In Hybrid Electric Vehicles,” Energies 2017, Vol. 10, Page 1796, 10(11), 1796, 2017, doi:10.3390/EN10111796.
- X. Ma, R. Miao, X. Wu, X. Liu, “Examining influential factors on the energy consumption of electric and diesel buses: A data-driven analysis of large-scale public transit network in Beijing,” Energy, 216, 2021, doi:10.1016/J.ENERGY.2020.119196.
- M. Brenna, F. Foiadelli, D. Zaninelli, “Electrical railway transportation systems.”
- P. Fajri, R. Ahmadi, M. Ferdowsi, “Equivalent vehicle rotational inertia used for electric vehicle test bench dynamic studies,” IECON Proceedings (Industrial Electronics Conference), 4115–4120, 2012, doi:10.1109/IECON.2012.6389231.
- eCitaro – Mercedes-Benz Buses, Sep. 2021.
- Export success for the Mercedes Benz eCitaro with fully electric drive: orders from Luxembourg, Norway and Sweden – Daimler Global Media Site, Sep. 2021.
- C. Leone, M. Longo, F. Foiadelli, S. Bracco, G. Piazza, F. Delfino, “Opportunity fast-charging of e-buses: A preliminary study for the city of Savona,” 2020 AEIT International Conference of Electrical and Electronic Technologies for Automotive, AEIT AUTOMOTIVE 2020, 2020, doi: 10.23919/AEITAUTOMOTIVE50086.2020.9307434.
- Going abroad – European Commission, Sep. 2021.
- S. Ceccon, M. Longo, R. Mazzoncini, A. Panarese, “Analysis of the Implementation of Full Electric and Hydrogen Hybrid Buses in Two Lines of the City of Milan,” in 2020 15th International Conference on Ecological Vehicles and Renewable Energies, EVER 2020, Institute of Electrical and Electronics Engineers Inc., 2020, doi:10.1109/EVER48776.2020.9243074.
- S.M. Arif, T.T. Lie, B.C. Seet, S.M. Ahsan, H.A. Khan, “Plug-In Electric Bus Depot Charging with PV and ESS and Their Impact on LV Feeder,” Energies 2020, Vol. 13, Page 2139, 13(9), 2139, 2020, doi:10.3390/EN13092139.
- M.M. Hasan, M. Ranta, M. El Baghdadi, O. Hegazy, “Charging management strategy using ECO-charging for electric bus fleets in cities,” 2020 IEEE Vehicle Power and Propulsion Conference, VPPC 2020 – Proceedings, 2020, doi:10.1109/VPPC49601.2020.9330970.
- O. Barraza, M. Estrada, “Battery Electric Bus Network: Efficient Design and Cost Comparison of Different Powertrains,” Sustainability 2021, 13, Page 4745, 13(9), 4745, 2021, doi:10.3390/SU13094745.
- LINEA 6 – LINEA 6/ Timetable, Sep. 2021.
No related articles were found.