Design Optimization and Life Cycle Cost Assessment of GRC Shading Screens for Office Buildings in Cairo

Adv. Sci. Technol. Eng. Syst. J. 6(5), 222–228 (2021);
 DOI: 10.25046/aj060524
Office buildings commonly use fully glazed façades to reflect a luxurious appearance and to maximize natural light of high solar exposure and high-energy consumption due to cooling and heating. There is a great abundance in constructing shading screens as they are part of the modern movement in field of Energy Conservation, renewable energies, and architectural design. This paper studies the impact of various perforated Glass Reinforced Concrete (GRC) shading screens for different orientation and the Life Cycle Cost Assessment (LCCA) in a prototypical office space in Cairo. We have simulated a wide range of perforated shading screens using Design Builder to identify optimal shading screens with the highest energy savings for different façade orientation. In this paper, we suggest a methodology to achieve better energy saving in office buildings, knowing the façade’s orientation and perforation percentage of shading screen. Simulation results show that shading screens with 10% perforation percentage commonly achieve the highest energy savings for all façade orientations and reaches up to 53% energy savings for the southwest façade. The LCCA of this shading screen in that southwest façade saves 52% in LCCA compared to the base case.
1. Introduction
Contemporary buildings in the world require massive amounts of energy for cooling and heating, while the cost of electrical energy is ceaselessly increasing. The amount of energy needed for providing comfortable living conditions within a specific region depends on climate conditions [1]. Based on Köppen’s climate classification system, Egypt’s climate is classified as hot desert arid climate, characterized by high direct solar radiation and clear skies [2]. These climate characteristics demand special façade treatments to minimize heat gain, solar exposure and energy consumption.
Shading screens, as a type of shading devices, help in reducing glare and excessive solar heat gain through fenestration. When properly designed, shading screens will improve not only indoor visual and thermal comfort, but also will greatly cut back electrical lighting, cooling, and heating energy [3].
Commercial buildings consume energy around 5,000 GWh, which represents nearly 4% of all electricity consumed in Egypt.
Around 60% of energy consumption in commercial building is due to HVAC and lighting. Façade configurations account for up to 45% of the cooling loads of the building [4]. Heat gain is transmitted through building façades either by radiation through transparent surfaces or by conduction through the whole building envelope.
The Life Cycle Cost Assessment (LCCA) primary goal is to provide a tool with the ability for appropriate financial appraisal of buildings and to substitute existing approaches focused on the actual costs of the construction project [5].
2. Research Objective
The objective of this research is to understand the value of integrating perforated GRC shading screens for different orientations of office building façades in Cairo using energy simulation and LCCA. Previous related studies focused on either predicting energy savings as a result of using shading screens for different facades or LCCA of different facade components other than shading screens. Therefore, the paper considers both energy savings and LCCA for the assessment of shading screens. In addition, we chose GRC as the material of the shading screen in order to minimize the initial cost.
3. Literature review
3.1. Types of shading screen
In Egypt, shading screens have been widely used for centuries. The Mashrabiya, an example of shading screen is used for controlling the passage of light, regulating air flow, reducing the temperature of the air current, increasing air humidity and guaranteeing a great amount of privacy [6]. Nowadays, designers allowed addressing the design exploration at both the macro and micro levels of resolution by the application of parametric modeling to architectural design. Figure 1 shows a type of shading screen that allows engineers or fabricators to immediately have input into the modelling process, to ensure structural integrity, while analyzing the resulting impact on the component form [7].
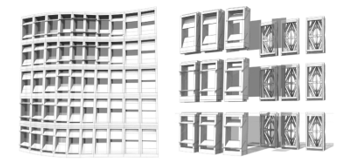 Figure 1: Exploded view of individual elements [7]
In [8], The authors evaluated various types and models of shading treatments based on used evidence review of systematic method to identify patterns and trends through classification and comparison. Three main categories of shading treatments were identified based on the energy involvement and the design approach: (i) passive systems with zero energy use, (ii) active systems that use mechanical devices and (iii) hybrid systems integrated with a biomimetic approach. Passive systems are fixed shading devices, which are cost-effective and easy to implement. Their performance presented limitations to address changeable weather conditions throughout the year.
The most common materials for shading screens are wood, aluminum and GRC [9]. The GRC is considered a durable, flexible and a cost effective material for shading screens.
3.2. Shading screens varieties and orientations
In hot climates, building energy use for lighting, heating and cooling, as well as the occupants’ visual and thermal comfort are affected by external perforated shading screens [10]. Studies have explored screen geometries, perforation percentages, and orientations in hot climate zone. Examples of these perforated screens are Mashrabeya, Jali, and Guss-Walls. The implementation of these screen solutions was to mitigate excessive solar radiation on window openings that result in overheating and therefore reducing cooling loads. [11].
In [12], The authors assessed the effect of shading screens with different rotation angles, aspect to depth ratio and perforation percentages on the annual cooling, heating and lighting energy loads using Energy Plus (Figure 2). The study proved that external fixed deep perforated solar screens could effectively achieve energy savings up to 30% of the total energy consumption in the west and south orientations. The highest and most significant savings were achieved in screens having a depth ratio of 1:1depth/opening width ratio.
This study shows that the highest energy consumption is on the west and south in which energy saving could reach the highest level by using a shading screen and the shape of the shading screen use is the orthogonal grid screens with square fenestrations with 1:1 depth ratio.
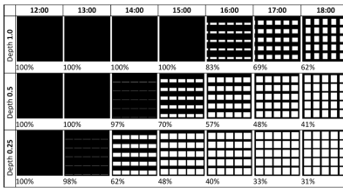 Figure 2: Shadow patterns and resultant shading percentage of shading screens with different depth ratio [12].
3.3. Shading screens and energy consumption in office buildings
In [13], The authors examined a wide range of perforation percentages of shading screen in Kharga Oasis for different orientations using Energy Plus simulation software to recommend the range of shading screens perforation percentages that reduces monthly and annual cooling loads. Simulation results showed that shading screen with perforation rate of 90% reduces cooling energy by 25% in average, while using more dense screens with perforation decreasing from 90% to 10% saves about 16% more, giving a total saving of 41% in average of the west, south and east façade.
This study shows that as we decrease the opening perforation we get high energy saving, and insure that the west and south facades have the highest energy consumption.
3.4. LCCA estimation
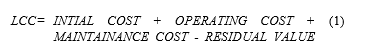
LCCA is determined by initial manufacturing, repair and replacement costs of the residual value of the commodity at the end of the study period, the sum of all these costs except the residual value determining LCC (1) defined by [14]
3.5. Previous studies of LCCA of building façade
In [15], The authors studied the value of kinetic aluminum louvers installed for office building south façades in a hot-dry climate, such as that of Egypt. The study compared kinetic aluminum louvers, fixed aluminum louvers to the non-shaded cases in terms of energy consumption and building Life-Cycle Cost. LCCA, using equation 1, finds out that fixed louvers are the most cost effective than kinetic louvers (Figure 3).The study shows the variation in both initial and operation cost but the difference in the initial cost is larger than the difference in the operation cost. The main challenge facing the application of kinetic louvers in office buildings in Egypt is the high initial cost due to importing the aluminum louvers and the additional automation components. This makes the payback period of kinetic louvers in Egypt longer than 20 years. Alternative scenarios of using local manufacturer of fixed louvers achieve net savings and cost payback just before the end of the study period. This study shows that the fixed shading screen are more affordable than the kinetic louvers.
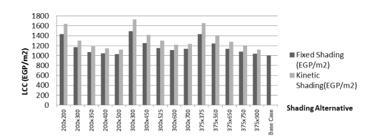 Figure 3: LCCA of kinetic and fixed louvers [15]
From the literature review, preferences using fixed shading screen with orthogonal grid screens with square fenestrations having high-density perforation in the west and south are the optimum for simulation.
4. Methodology
Simulation was performed for using Design Builder version 4.5 as a graphical user interface for energy plus. The base case model, the shading screen modeling and parameters are discussed below.
4.1. Base Case Model
The base case is a typical cellular office space in the hot arid desert environment of Cairo, International airport, Egypt, a closed office having a floor area of 4 m by 4 m, with a height of 3 m (Figure 4). This room was isolated from the external environmental thermal changes by assuming that all surfaces, other than the external tested wall, were adiabatic. Thus, three walls, floor and roof were assumed adiabatic. The fourth wall was defined as a fully glazed curtain wall and defined as double clear 6mm glass and 13mm air gap.’
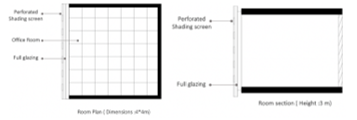 Figure 4: Office room plan and section show the relation between curtain wall and shading screen
Typical occupancy schedule was set to start at 8 am and end by 5 pm with a two-day weekend break. Mechanical cooling was simulated using an A/C chilled water system. Cooling and heating set points were 26°C and 20°C respectively, which achieve the required thermal comfort, set by ASHRAE. Artificial lighting was set to use LED bulbs (10 W/m2), which is considered as optimum lighting efficiency for office spaces. The annual simulation runs were conducted for west, southwest, south, southeast and east facade orientations and testing the perforation of shading screens from 5% to 90%.
4.2. Shading screen modeling approach
In order to find the screen configuration with highest energy saving potential, a range of shading screen perforation was simulated. The main focus of the simulation was to evaluate the effect of alternative configurations on energy consumption due to cooling, heating and lighting. The shading screen was externally mounted at a distance of 20 cm from the curtain wall. The screen dimensions cover the whole room’s façade with extended 1min each side.
Alternatives of different perforation percentages were studied for Curtain walls facing west, southwest, south, southeast and east orientations. We performed the study on screens with perforation percentages ranging from 5% to 90%, and depth of shading screen 5 cm. The number of simulation runs reached 55 runs.
4.3. Shading screen parameters
- Material: GRC
- Dimensions: Width 4 m and height 3 m and extended to cover the office façade.
- Position: At a distance 20 cm from the curtain wall.
- Shape: Orthogonal grid 90 degree of rectangular section bars.
- Perforation Ratio: Ranging from 5% to 90% (Figure 5).
- Material Depth: 5 cm
- Fixed number of opening: 5 rows and 6 columns
- Orientation: west, southwest, south, southeast and east façades.
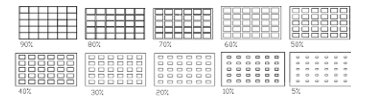 Figure 5: Shading screen used in simulation from 90% to 5% perforation
5. Annual energy consumption of alternative screen configurations
The annual energy consumption of the base cases was calculated first. It was a closed office having all the above defined parameters, with daylighting controls and without any shading screens. Simulation results of the base case revealed that the highest energy consumption was in the southwest (255 kWh/m2), west (231 kWh/m2), south (215 kWh/m2), southeast (214 kWh/m2) and east (183 kWh/m2), as shown in (Figure 6).
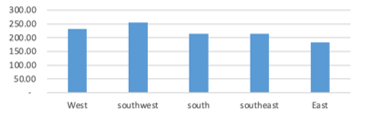 Figure 6: Total energy consumption of the base case in all façade orientations
As expected for hot environments, cooling represented the highest component from 185 kWh/m2 to 136 kWh/m2, which was almost 80% of the energy consumption. As shown in (Figure 7) energy consumption due to lighting is kept to the minimum since daylighting controls minimized the operation of artificial lighting.
Annual energy consumption has been presented in kWh/m2 for alternative shading screen perforation percentages and orientations.
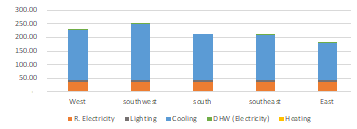 Figure 7: Breakdown of energy consumption in the base case
5.1. West orientation:
West orientation in the base case considered as 10% less energy consumption compared to southwest. Therefore, as shown in (Figure 8) the energy saving reached 48% with 10% perforated shading screen, which saved up to 111 kWh/m2
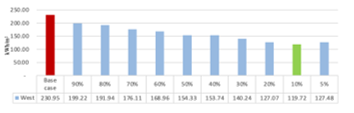 Figure 8: Total Annual Energy Consumption of the case study without and with shading screens (90% to 5% Perforations) for the west facade
The graph below in (Figure 9) shows the relation between the perforation percentage and the energy consumption in the southwest façade. The cooling is the main factor of saving energy in which it decrease around 45% and saving 86 kWh/m2 from 90% perforated shading screen to 5% perforation. The inverse of this relation shown in lighting but with less impact on energy saving in which 90% perforation is 5.6 kWh/m2 and the 5 % perforation is 19.8 kWh/m2. The difference is around 14 kWh/m2whichis considered a little impact on energy saving compared to the cooling saving.
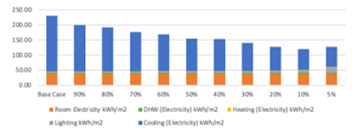 Figure 9: Energy consumption breakdown for the 5% to 90% perforated shading screens compared to the base case for the west facade
5.2. Southwest orientation:
As the southwest orientation was the highest energy consumption in the base case, in order to save as much energy as possible, we used perforation percentage from 90% – 5%. As shown in (Figure 10) that the energy saving reach 136 kWh/m2 saving in the 10% perforation shading screen, which is almost 53% saving of energy consumption.
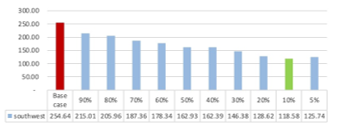 Figure 10: Total Annual Energy Consumption of the case study without and with shading screens (90% to 5% Perforations) for the Southwest façade
The graph below in (Figure 11) shows the relation between the perforation percentage and the energy consumption break down in the southwest façade. Heating and room electricity does not change, or almost fixed. The cooling is the main factor of saving energy in which it decrease around 40% of total cooling energy which save 100 kWh/m2 from 90% perforated shading screen to 5% perforation. The inverse of this relation shown in lighting but with less impact on energy saving in which 90% perforation is 5.5 kWh/m2 and the 5% perforation is 18 kWh/m2. The difference is around 13 kWh/m2 that considered as little impact on energy saving in compared to the cooling saving. The most important factor in the analysis is the cooling energy consumption that has a great impact on the saving energy.
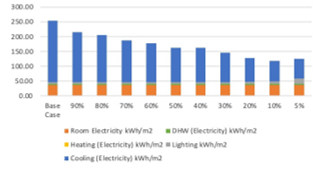 Figure 11: Energy consumption breakdown for the 5% to 90% perforated shading screens compared to the base case for the Southwest facade.
5.3. South orientation
South orientation in the base case considered as 19% less energy consumption compared to southwest. As shown in (Figure 12) the energy saving reached 47% with 10% perforated shading screen, which saved up to 100 kWh/m2
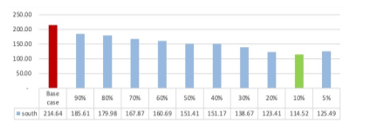 Figure 12: Total Annual Energy Consumption of the case study without and with shading screens (90% to 5% Perforations) for the South façade
The graph below in (Figure 13) shows the relation between the perforation percentage and the energy consumption in the south façade. The cooling is the main factor of saving energy in which it decrease around 47% saving 73 kWh/m2 from 90% perforated shading screen to 5% perforation. The inverse of this relation shown in lighting but with less impact on energy saving in which 90% perforation is 5.5 kWh/m2 and the 5% perforation is 18.8 kWh/m2. The difference is around 13 kWh/m2 that considered as little impact on energy saving in compared to the cooling saving.
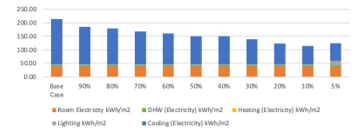 Figure 13: Energy consumption breakdown for the 5% to 90% perforated shading screens compared to the base case for the south facade
5.4. Southeast orientation
South East orientation in the base case considered as 19% less energy consumption compared to south West. Therefore, as shown in (Figure 14) the energy saving reached 47% with 10% perforated shading screen, which saved up to 101 kWh/ m2.
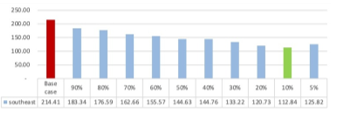 Figure 14: Total Annual Energy Consumption of the case study without and with shading screens (90% to 5% Perforations) for the South façade
The graph below in (Figure 15) shows the relation between the perforation percentage and the energy consumption in the southeast façade. The cooling is the main factor of saving energy in which it decrease around 48% saving 72 kWh/m2 from 90% perforated shading screen to 5% perforation. The inverse of this relation shown in lighting but with less impact on energy saving in which 90% perforation is 5.6 kWh/ m2 and the 5% perforation is 20 kWh/m2. The difference is around 15 kWh/m2that considered as little impact on energy saving in compared to the cooling saving.
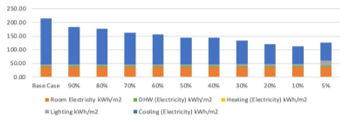 Figure 15: Energy consumption breakdown for the 5% to 90% perforated shading screens compared to the base case for the Southeast facade
5.5. East orientation
East orientation in the base case considered as 39% less energy consumption compared to southwest. Therefore, as shown in (Figure 16) the energy saving reached 39% with 10% perforated shading screen, which saved up to 72 kWh/ m2.
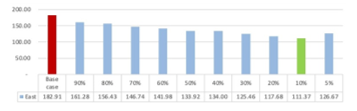 Figure 16: Total Annual Energy Consumption of the case study without and with shading screens (90% to 5% Perforations) for the East façade
The graph below in (Figure 17) shows the relation between the perforation percentage and the energy consumption in the east façade. The cooling is the main factor of saving energy in which it decreases around 56% saving 50 kWh/m2 from 90% perforated shading screen to 5% perforation.
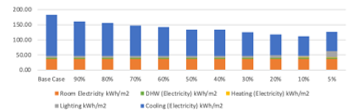 Figure 17: Energy consumption breakdown for the 5% to 90% perforated shading screens compared to the base case for the east facade
5.6. Overall energy savings
The total annual energy savings resulting from using a shading screen with 10% perforations compared to the base case. Shown in (Figure 18) the orientations with highest and least energy savings (53% and 39%) are the southwest and east respectively.
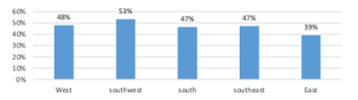 Figure 18: Percentage of saving energy for 10% perforation shading screen compared to base case
6. Life Cycle Cost of GRC Shading Screen with 10% perforations in southwest Façade.
6.1. Initial Cost
The Initial cost of GRC shading screen was based on quotations obtained from a local supplier submitted on July 2021. The initial cost of GRC is 450 EGP / m2 and the total area need to cover the curtain wall of the office room is 12m2, so the total price for the room is 5,400 EGP (Egyptian Pounds), which is 338 EGP/ m2.
6.2. Operation Cost
As discussed earlier, operation costs are mainly the electrical energy costs. Operation cost includes all energy costs required for cooling, lighting, heating and office equipment for the test cases, previously simulated. The cost of energy consumption was calculated according to the Egyptian electrical cost (tariff) by the operation year for commercial buildings 2021which equals 1.6 EGP/kWh [16].
| Annual Operation Cost | (A0) = | Annual Electric Consumption /m2 | (E) x Tariff (T) | (2) |
In order to apply a present cost of 20 years of operation in today’s value, the present value equation in Equation (3) need to be considered where the present value is defined as: “the time equivalent value of past, present or future cash flows as of the beginning of the base year” [14]. The main inputs of the present values are annual costs and the annual real discount rate (d) which defines annual escalation in energy prices, which is set to be 4.3% [17] resulting that present value of the GRC shading screen is 2,520 EGP/m2. GRC material does not have a maintenance cost over the 20 years operation.
![]() Where:
Where:
PV = present value
A0= annual recurring costs (operation costs)
d = real discount/interest Rate
t = time (number of years)
6.3. Residual Value
Residual value is defined as the net cost of a building or building component after at the end of the LCC study period [14]. The residual value will be equivalent to the resale price of the metal studs as scrap. The current local price of metal scrap is equal to 5 EGP/kg based on local market survey in 2021. The Weight of the resale value of metal studs used in GRC fixation is 35 Kg/m2 that represent 176 EGP/ m2 (Table 1).
6.4. LCCA Results
LCC has been calculated by applying Equation (1), adding the initial cost per unit area, which is 338 EGP/m2 and operation costs per unit area, which is 2,519 EGP/m2, and then subtracting the residual value 175 EGP/m2 (Table 2). Since, the base case has no initial or residual value. The LCC of the base case is based on operation costs only, which is 5,411 EGP/m2. The LCC of 10% perforation shading screen is 2,682 EGP/ m2.
Table 1: Residual Value Breakdown for the GRC Shading Screen
| volume of metal frame | cross sectional area | studs L*w | m3 |
| 0.0015 | 16 | 0.024 | |
| Weight of single metal | volume of metal | metal density | kg |
| 0.024 | 2600 | 62.4 | |
| weight per room surface | Weight of single metal frame | No. of Metals | kg |
| 62.4 | 9 | 561.6 | |
| weight/ unit room area | weight of metal in Room | Room Area | kg/m2 |
| 561.6 | 16 | 35.1 | |
| Price of kg | 5 | ||
| Residual value | 175 | ||
Table 2: LCC of the Base case and 10% perforation of Southwest façade
| Base Case | 10% perforation in southwest | |
| Initial Cost of GRC shading screen |
0 | 338 |
| Operation Cost | 5,411 | 2,519 |
| Maintenance cost for 20yrs | 0 | 0 |
| Residual value | 0 | 175 |
| LCC | 5,411 | 2,682 |
The main objective of calculating LCC was to calculate the savings and the cost payback of shading screen with reference to the base case. The results shows that the difference between LCC in the base case and the 10% perforation shading screen in the south west façade save 2,623 EGP/m2 during the study period, which actually save up to 52%.
6.5. Cost Payback period
The payback period is the time you need to recover the cost of your investment. As the total initial cost of GRC Shading Screen is 338 EGP/ m2 and the LCC is 2,682 EGP/ m2. The payback period will be in the second year of operation (Table 3)
Table 3: LCCA difference between the Base case
and 10% perforation of Southwest façade
| 1st Year | 2nd Year | |
| LCCA-Base Case | 391 | 766 |
| LCCA-10% Southwest | 182 | 357 |
| Savings | 209 | 409 |
7. Conclusion
In order to understand the value of integrating perforated GRC shading screens for different orientations of office building façades in Cairo, A range of GRC shading screen perforations was assessed for office building façades with different orientations using Design Builder. The shading screen perforations follow an orthogonal grid as advised by [12].
The utilization of perforated shading screens for protection of curtain walls in the severe hot desert environments proved to provide considerable energy savings. The simulation of a typical office space in Cairo, Egypt illustrated this. The energy savings resulting from the use of these screens reached 53% for the southwestern orientations respectively in comparison a non-shaded curtain wall, which match the findings of [13].
The LCCA compared the southwest oriented 10% perforation GRC shading screen to the base case. LCC savings reached 52% and the return of investment of the shading screen is on the second year of operation. The research used the GRC as a local affordable material for the static shading screen that provides minimum initial cost and fast return of investment as advised by [15].
7.1. Research Recommendation
As the research shows, the most effective allocation of the shading screen is in the southwest as it is the location with the highest energy consumption. Thus, by adding the shading screen it will have the highest energy saving. As for the perforation percentage, the narrow opening is more recommended for highest energy and cost saving percentages especially for south-west and west façade orientation.
7.2. Further Research
This paper reported on orthogonal grid screens with square fenestrations. More shading screen shapes with different dimensions could be examined with the effect of the lighting quality.
Conflict of Interest
The authors declare no conflict of interest.
- H. Eskandari, M. Saedvandi, M. Mahdavinejad, “The Impact of Iwan as a Traditional Shading Device on the Building Energy Consumption,” Buildings, 8(1), 1-28, 2018, doi:10.3390/buildings8010003.
- B.L. Finlayson, T.A. McMahon, M.C. Peel, “Updated world map of the Köppen-Geiger climate classification,” Hydrology and Earth System Sciences, 11, 1633–1644, 2007, doi: 10.5194/hessd-4-439-2007
- E.S. Lee, D.L. DiBartolomeo, S.E. Selkowitz, “Thermal and daylighting performance of an automated venetian blind and lighting system in a full-scale private office,” Energy and Buildings, 29(1), 47–63, 1998, doi:10.1016/S0378-7788(98)00035-8.
- N. Hamza, A. Gomaa, C. Underwood, “Daylighting and thermal analysis of an obstructed double skin façade in hot arid areas”, Proceedings of Clima 2007 WellBeing Indoors, 7-10,2007.
- S. Fuller, “Life-Cycle Cost Analysis (LCCA)| WBDG—Whole Building Design Guide”, National Institute of Standards and Technology (NIST), http://www.wbdg.org.html, (accessed June 2021), Washington, 1-13, 2016.
- Y.M. El Semary, H. Attalla, I. Gawad, “Modern Mashrabiyas with High-tech Daylight Responsive Systems,” in 2017 CITAA Cities’ Identity Through Architecture and Arts, 1–11, 2017, doi:10.21625/archive.v1i1.113.
- G. Pitts, S. Datta, “Parametric modelling of architectural surfaces,” in 2009 CAADRIA: the 14th International Conference on Computer Aided Architectural Design Research in Asia, 635-644, 2009.
- S.M. Al-Masrani, K.M. Al-Obaidi, N.A. Zalin, M.I. Aida Isma, “Design optimisation of solar shading systems for tropical office buildings: Challenges and future trends,” Solar Energy, 170, 849–872, 2018, doi:10.1016/j.solener.2018.04.047.
- A.Watts, A Modern construction envelopes, Ambra Verlag, 2014. doi:10.1515/9783990436042.
- A. Batool, I.M.K. Elzeyadi, “From romance to performance: assessing the impacts of jali screens on energy savings and daylighting quality of office buildings in lahore, Pakistan,” in 2014 PLEA Proceedings of the 30th International PLEA Conference in India, 1-10, 2014.
- I. Elzeyadi, A. Batool, “Learning from the Vernacular?: The Impacts of Massive Perforated Screen Shades on Building Energy Savings and Thermal Comfort in Two Different Hot Climate Zones,” in 2018 ASHRAE Winter Conference, 1-8, 2018.
- A. Sherif, A. El-Zafarany, R. Arafa, “External Perforated Window Solar Screens: The Effect of Screen Depth and Perforation Ratio on Energy Performance in Extreme Desert Environments,” Energy and Buildings, 52, 1–10, 2012, doi:10.1016/j.enbuild.2012.05.025.s.
- A. Sherif, A. Faggal, R. Arafa, “External Perforated Solar Screens for Thermal Control in Desert Environments?: The Effect of Perforation Percentage on energy loads”, in proceedings of Renewable energy, 1-5, 2010.
- S.K. Fuller, S.R. Petersen, LIFE-CYCLE COSTING MANUAL for the Federal Energy Management Program, NIST publication; U.S. department of commerce technology Administration National Institute of Standards and Technology, 1996.
- A. Essam Eldeen, O. Tolba and S. Ezz Eldin.” Life-cycle cost assessment of kinetic aluminum louvers on office building façades in Egypt.” Cairo University’s Journal of Engineering and Applied Sciences, 62(1), 1–22, 2015.
- EGYPTERA, “http://egyptera.org/ar/t3reefa.aspx”, (accessed June 2021), Ministry of Electricity, Cairo, 2021.
- Central Bank of Egypt, “http://www.cbe.org.eg/English/Statistics/” (accessed June 2021), Cairo, 2021.