Impact Assessment of the Renewable Energy Sources Implementation in Bulgarian Single-Family Houses on the Greenhouse Gas by HOMER Pro Software

Adv. Sci. Technol. Eng. Syst. J. 6(5), 362–368 (2021);
 DOI: 10.25046/aj060541
It is widely known that cities now house more than half of the world’s population. Within this framework, this study presents the possibilities for real-world application of renewable energy sources (RES) in urban areas, as well as their contribution to the urban deployment of the new energy paradigm. A comparison is made between hybrid power systems, operating on Bulgarian territory and conventional (traditional) power systems. Proposed hybrid system is designed and actually implemented to power a single-family house and consists of wind turbine (WG) photovoltaics (PV), lithium-ion batteries for energy storage and suitable converter. The HOMER Pro software was used to model and explore the long-term continuous implementation of a hybrid power system and greenhouse (GHG) gas emissions investigation. The article discusses the amount of carbon dioxide (CO2) and nitrogen oxides (NOX), that can be reduced by using a hybrid power system (solar and wind) in conjunction with a battery storage system (BSS – lithium-ion batteries) in single-family houses. Renewable energy sources combined with energy storage, according to this report, result in a 50% reduction in dangerous carbon dioxide and nitrogen oxide emissions. The proposed system is optimized based on the lower cost of energy (COE) and proper dispatch strategies (load following and cycle charging), resulting in greenhouse gas emissions distributed by regional Bulgarian cities.
1. Introduction
This paper is a continuation of work that was originally presented at the 2020 12th Electrical Engineering Faculty Conference (BulEF), [1]. The main task of this extended article is to expand knowledge and demonstrate a modern ability to share computing and modern technologies to assess important parameters such as the generation of harmful emissions. Kumar discuss [2] the opportunity to assess the generated harmful emissions is of particular importance and is a societal challenge for all of us. The rapid development of renewable technologies, as well as energy storage technologies, as well as their ever-increasing disposal, could to some extent provide a solution to the existing problem – environmental pollution generated at electricity produced for domestic use [3].
Many literary sources define the different types of green energy; some say there are five, while others say there are six or even seven [4–9]. Electricity production using fossil fuels has historically provided adequate costs but emits GHG.
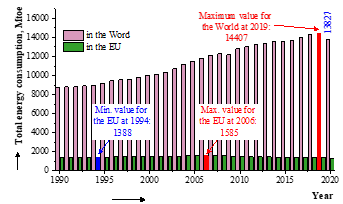 Figure 1: Total energy consumption over 1990 – 2020 in the Word and the EU.
According to the European Environment Agency, the European Union ranks third in the world in terms of greenhouse gas emissions, trailing only China and the United States [10]. As reported by Enerdata, contrary to expectations, in the face of a global pandemic, global energy consumption growth slowed by 4% in 2020, compared to an average of 2% per year from 2000 to 2018 and a 0.8% slowdown in 2019, Figure 1, [11].
Except for China, which is the world’s largest energy consumer, most countries have reduced their energy consumption.
The difference in total power consumption between Europe and the rest of the world is between 6 and 10.6 times, and the trend is upward Figure 1. The data show that the global trend of increasing energy consumption continues. The year 2020 is an exception for both the world and Europe, due to the global pandemic caused by COVID-19 and its spread. Globally, energy consumption is steadily increasing, whereas in Europe, consumption is decreasing, most likely as a result of the European Union’s policy to increase efficiency. Lockdown measures and limited economic activity had a significant influence on energy consumption in 2020. It dropped by about 7% in the European Union. Energy consumption fell across Africa and the Middle East as well, [11]. Under the Paris Agreement, the European Union (EU) has pledged to reduce GHG emissions by at least 40% by 2030 compared to 1990 (2016). The European Union is taking it a step further, aiming for nearly zero emissions by 2050 under the European Green Pact, [12]. The European Union is dedicated to achieving lofty goals in the fight against hazardous climate change. The European Commission announced a strategy for long term and achieving a climate friendly economy by 2050 in November 2018. By the second half of this decade, the EU hopes to be carbon neutral, [13]. The European Union has passed regulations in a variety of areas to attain the goal of reducing GHG emissions. The emissions trading scheme has undergone changes, for example, which oversees the progressive reduction of emissions from energy and industry while requiring polluters to pay a penalty. Various industries, such as agriculture and construction, have established national emission reduction targets. Because energy is at the heart of the emissions problem, the EU is working toward a strategy of cleaner sources and more efficient use. In 2018, Parliament passed laws requiring renewable energy sources (sun, wind, and water) to account for 32% of overall consumption and allowing households on their own to generate their own “green” energy, [14]. Furthermore, the EU has implemented rules on buildings and household appliances to increase energy efficiency by 32.5% by 2030, [15]. The “Clean Air For Europe programme (CAFE)” 6 of 2013 maintained the goal of achieving full compliance with current air quality regulations throughout the EU as soon as possible, with 2020 and 2030 targets specified.
The policy initiatives themselves are: the first basis consists of ground-level ozone, particulate matter, and nitrogen oxides ambient air quality standards, hazardous heavy metals, and a variety of other pollutants set out in the directives on ambient air quality; the second basis according to [16] is the Directive on national emission ceilings for the most major transboundary air pollutants, which establishes national emission reduction targets.
It is widely known that more than half of the world’s population now lives in cities. Human and monetary activities both require energy. Fossil resources are decreasing in tandem with rising energy demand. In terms of global development, energy supply and security are major issues. The hunt for new energy sources based on RES has been prompted by the scarcity of energy and the demand for sustainable systems. In comparison to traditional fuel-powered generators, numerous renewable energy (RE) solutions are now well developed, cost-effective, and reliable, [17].
The true potential of solar energy is found in the numerous applications it offers at the municipal level, as it can be used to generate both heat and power in public and residential buildings and facilities. Solar energy has grown to be one of the most popular RES in Europe and Bulgaria as a result of its low cost, Figure 2. Solar energy is becoming a more common source of energy and a viable alternative to overcome energy shortages. According to [18], the main benefits of solar energy are accessibility, lack of pollution i.e. obtaining “green” energy, ease of operation, availability, and tranquillity. Furthermore in [19], the author point out, solar panels are known for their low maintenance, ease of installation and disassembly, and lack of moving components. A solar panel, as a RES technology, is simple to install and safe in urban environments. PV panels can be distributed and put in any sun- location exposure to the sun [20].
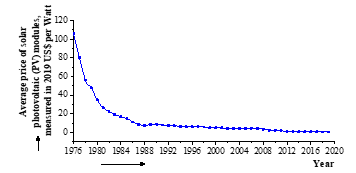 Figure 2: The average price of solar photovoltaic modules around the world, measured in US dollars per watt in 2019, [21].
PV systems and generators powered by the wind (WT) can be combined to generate power in a hybrid system. This system produces no greenhouse emissions. A system like this has the advantages of being practicable, dependable, simple, almost no maintenance and low cost. The economics of a solar-wind hybrid system is always rising due to constant reductions in component pricing. Because the energy obtained from the sun and wind fluctuates over time, a battery storage device must be included in the hybrid system, [21].
This extended article presents also new comparative data for Bulgaria, the EU and the World in connection with the use of RES and their share in the overall energy mix, Figure 3.
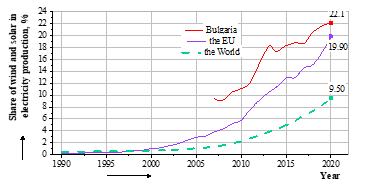 Figure 3: The percentage share of wind and solar in electricity production over 1990 – 2020 in the World, European Union and Bulgaria.
Increasing 0the amount of renewable energy in Bulgaria provides further economic, scientific, and political benefits: decreases the state’s reliance on fossil fuels. Bulgaria first began promoting renewable energy in 2007, well after the formation and execution of the institutional and legislative framework in the other old EU member states. In two periods (2007÷2012 and 2012÷2016), the state saw a significant increase in its percentage of renewable energy. Bulgaria now has approximately 1700 MW of installed renewable energy capacity (mostly wind and photovoltaic). Bulgaria is one of 11 EU countries that has already met its 2020 renewable energy goal. Energy from renewable sources accounted for 20.5% of gross final energy consumption in 2018, according to the Republic of Bulgaria National Statistical Institute [22-24].
A hybrid power station that combines PV and WT is promising future energy generation technology. Furthermore, Prasad proposes PV and wind power have an effect of synergy, with PV and wind power dominating during daytime and nocturnal hours, respectively [25]. Several studies have suggested that battery energy storage systems (BESS) be used to provide a variety of services for performance in order to deal with the variability of PV/wind energy generation [26-28]. The operation of a hybrid PV-WT system requires a battery storage system. The installation of a battery storage system enhances dependability, efficiency, and load smoothing. The hybrid power system is balanced thanks to the battery storage system [18,29].
The current computer-based study provides new valuable systematic price information connected to the so important chemical source of electricity – lithium-ion batteries as shown in Figure 4.
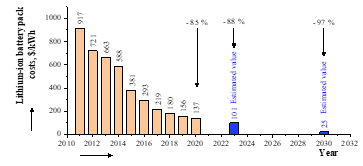 Figure 4: Costs of lithium-ion battery packs worldwide between 2011 and 2030 [30].
Energy storage is critical for integrating renewable energy sources into the power system. Furthermore, the combination of rooftop solar panels and battery storage is becoming increasingly popular in the hose-hold market. The cost of manufacturing lithium-ion batteries is steadily decreasing [30, 31]. These facts support the argument made in this article for the use of battery energy storage devices.
The complicated architecture of the power grid makes calculating the actual amount of emission reductions from energy efficiency and renewable energy measures difficult. Because air hazard pollutants like ozone (O3), carbon monoxide (CO), sulfur dioxide (SO2), and nitrogen oxides (NOX) can be harmful to human health, it is critical to understand how to limit their emissions. Increased energy efficiency is one of the most well-known technologies. The usage of renewable energy sources is the second option.
The quantity of harmful emissions that can be decreased by employing a hybrid power system (WT and PV) in conjunction with a BSS is estimated in this article.
Numerous experiments have been conducted to study how to reduce costs by dispatching a battery without using forecasting techniques. There are also numerous battery optimization studies that use only one forecasting technique to achieve the least costs or greatest revenues. Although the complexity of the models was minimized in these investigations, the impact of different forecasting approaches on the optimization results could not be observed. As a result, the forecasting findings from several forecasting methodologies are integrated into the optimization model in this study [32-36].
The impact of a hybrid energy system with integrated energy storage technology on a single-family house in terms of harmful CO2 and NOX emissions has been investigated using an appropriate software product. The available literature does not present results on the distribution of harmful gas emissions after the implementation of RES on Bulgarian territory. The preliminary quantitative assessment yields result indicating a reduction in harmful CO2 and NOX emissions.
This article explains the contributions of the study in contrast to the article [1]. This paper’s major contributions include the following: 1) The presentation of a dispatch strategy proposed by HOEMR Pro. 2) The demonstration of applying HOMER Pro software product to efficiently solve a hybrid system complex optimization problem, from a green gas emissions point of view, a single-family house power system that includes different renewable energy sources and battery storage system. 3) The use of a Load following (LF) dispatch strategy resulted in significantly lower hybrid power system operation costs. 4) The impact of the RES implementation and energy storage on the amount of generated emissions of CO2 and NOX, as well as the economic effect on the territory of Bulgaria, which is a member of the European Union, was assessed.
2. Design specification for the proposed hybrid system
This article takes a computer-assisted method. The simulation compares greenhouse gas emissions from hybrid energy supply systems in several Bulgarian regions. The proposed system configuration is simulated, optimized, and analysed using HOMER. The simulation assesses the system’s technical feasibility and performs system optimization based on several system configurations to identify which one is the most suitable.
Forecasting PV and/or wind power generation is critical for developing a battery optimization plan for battery energy management. To meet the load, the HOMER software provides alternative dispatch algorithms to manage the operation of the generator and storage bank.
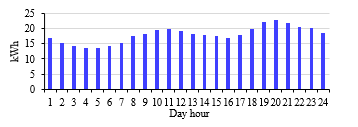 Figure 5: Daily profile for a Sofia-area (Bulgaria) urban household.
The shown standardized load profile is standard and pertains to residential customers in the Sofia metropolitan area, as recognized by Bulgaria’s Energy and Water Regulatory Commission (EWRC). The distribution company in the Sofia area of Bulgaria offered the developed load profile, Figure 5.
The HOMER Pro software is capable of simulating tree dispatch strategies – cycle charging, load following, and combined [37]. Which is ideal relies upon numerous variables, including the spans of the generators and battery bank, the fuel cost, the operation and maintenance (O&M) cost of the generators, etc.
When used in a load-following strategy (LF), a generator only produces enough power to meet the demand. LF works best in systems that use a lot of renewable energy because the renewable energy output occasionally exceeds the load. A generator is used in the cycle charging (CC) approach, and excess power is used to charge the battery bank. In systems with little or no renewable energy, cycle charging is preferred [37].
One of the objectives of this article is to compare alternative working strategies (LF- and CC-) in terms of greenhouse gas emissions in order to determine the best dispatch technique. It has been chosen to model both dispatch strategies, HOMER simulates each system separately.
Figure 4 depicts a schematic diagram of the microgrid designed by HOMER. A grid-connected hybrid system generates power from the sun and wind, which is then converted into grid-compliant electricity.
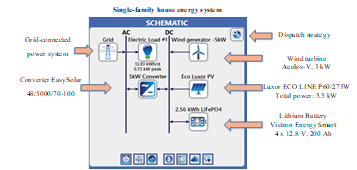 Figure 6: A schematic diagram of the hybrid power system that was designed to power a single-family home in Bulgaria.
2.1. Hybrid system components
The solar panels (Luxor ECO Line P60/275W) chosen had an initial and replacement cost of 3050 EUR, as well as an annual operation and maintenance cost of 20 EUR. It has a service life of 25 years. Without a tracking system, the selected panel’s external current is DC, and the ground reflection coefficient is assumed to be 20%. The average efficiency coefficient was assumed to be 90% in this study. The coefficient of performance was used to represent the performance degradation caused by factors such as snow, shadows, high temperature, dust, wiring loss, and so on. It is usually 90%, but in hot weather it drops to 70%.
Four (4) identical series-connected 12V, 200Ah Li-ion Victron Energy batteries with an initial and replacement cost of 9600 EUR and an annual operating and maintenance cost of 50 EUR were used. The HOMER software accepts that the battery’s highlights remain constant throughout its useful life and are not influenced by external factors such as temperature.
A converter is required for any system that includes both AC and DC components. For the simulation, a 5 kW converter with an initial and replacement cost of 4000 EUR is used. For grid compatibility in Bulgaria, the output voltage is set to 230V at 50Hz. The inverter has a 25-year lifespan and an efficiency of 95% as an inverter and 95% as a rectifier at a relative capacity of 100%.
A 5kW direct current wind generator was used. It had an initial and replacement cost of 800 EUR, as well as an annual operating and maintenance cost of 50 EUR. It has a 25-year life expectancy and was installed at a height of 10 meters above ground.
Reference [38] provides a detailed description of the peak electric load and standardized load profile.
2.2. HOMER’s Greenhouse Gas Emission Assessment Capabilities
In [39], the author stated that there is a plethora of energy modelling software for renewable energy systems simulation available on the web. However, only five of them are appropriate for simulation procedures, and their environmental impact approach is appropriate.
The software needed to input technical and economic data, as well as energy component specs and resource data for renewable and non-renewable resources. Once all of the data has been entered into the software, HOMER calculates the environmental impact based on direct CO2, CO, NOX, and SO2 emissions.
HOMER calculates emissions for each pollutant by multiplying the emissions factor (in g/kWh) by the annual fuel usage (in kWh) [37].
3. Discussion of simulation results
A 25-year prediction was used in the simulation. HOMER gave simulation results for a hybrid power system. All of the results reported here are for a hybrid system in Sofia, Bulgaria – 42°39.4’N, 23°21.2’E.
HOMER ran 114 simulation alternatives for the proposed hybrid power system, Figure 6, and all of them were feasible. This microgrid uses 27 kWh per day and has a max power output of 5 kW. The electrical load was served by the generation sources in the proposed system. This optimization has a net present cost of 20 800 EUR, while the cost of generating RE is 0.16 EUR per kilowatt-hour.
PV penetration of 136% for energy supply increases net grid purchase, whereas wind penetration of 11.4% decreases it. A renewable portion of 72.6% appears to be an appropriate load sharing between the grid, wind generator and PV panels.
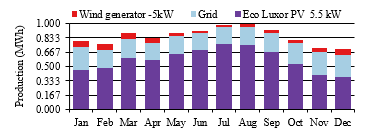 Figure 7: Average monthly electric production of a grid-connected hybrid power system in Sofia, Bulgaria.
Figure 7 indicates that the hybrid power system generates a total of 7516 kWh/year to sustain the load, lowering the grid purchase to 2697 kWh/year. It is clear that the solar component of the energy system has the biggest share, followed by power from the conventional grid. Despite a clear trend of increasing renewable energy generation from wind turbine during the winter months of the year, the share of this type of source remains low.
In [1], it clearly shows the economics and operational statistics for the solar system, wind generator, and converter separately. At 136% penetration, the solar system’s reported value is 5.50 kW. The Aeolos Wind Energy Ltd. wind turbine installation, rated at 5.00 kW, produces 581 kWh/yr of electricity.
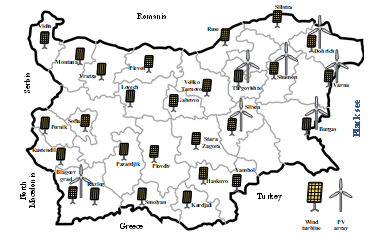 Figure 8: Preferred RES implementation by Bulgarian geographical area in accordance with [32], as determined by HOMER software.
HOMER calculates and displays the total amount of each pollutant generated yearly by the power system in kilograms per year of the six pollutants listed below: carbon dioxide (CO2), carbon monoxide (CO), unburned hydrocarbons (UHC), particulate matter (PM), sulfur dioxide (SO2), and nitrogen oxides (NOx). Pollutants are produced through the use of fuel and biomass in generators, boilers, and reformers, as well as by the use of grid electricity [29]. The HOMER Pro software application allows for the presentation of Bulgaria’s current carbon dioxide (CO2) emissions situation. HOMER adds 8.93 EUR/ton CO2 emissions to the total annual cost of the hybrid power system. Grid emissions are lowered as a result of power sales to the grid. According to our previous article [28], the recommended distribution of used RES corresponds to that shown in Figure 8.
The proposed distribution map was based on the demand for the cheapest per-kWh energy. The HOMER software package allows to estimate the cost of energy for each proposed system, and this parameter, as the most crucial, was tracked throughout the simulation process. The presented hybrid power supply system was multiplied and applied to each of Bulgaria’s provinces. One of the goals of this research is to develop a roadmap for the use of renewable energy sources in single-family houses across the country, resulting in significant reductions in GHG emissions and the cost of energy, [40].
Figure 9 shows the results and comparison of electricity costs with renewable energy sources in a single-family home, as well as the distribution by major Bulgarian district cities. Two power systems were compared: one powered by the local electricity distribution company, and the other combining conventional electricity and RES (PV and WT) with a battery storage system.
In general, the cost of energy produced by a hybrid power system is higher than that produced by the conventional power system.
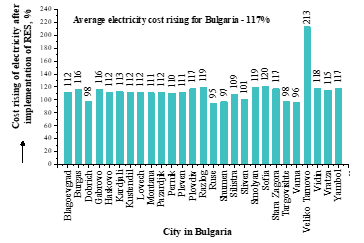 Figure 9: Costs of energy (COE) comparison between hybrid power system and conventional grid-connected system based on preferred energy sources shown in Figure 8.
When powering a single-family home, the proportion of renewable energy in the overall energy mix is an important factor in the modelling and analysis of the results. Figure 10 shows a clear trend toward a high percentage of energy generated from renewable sources in the total energy mix. The share of renewable energy accounts for between 67.7% and 79.0% of total energy consumption. This percentage stays high enough to power Bulgaria’s entire territory with renewable energy.
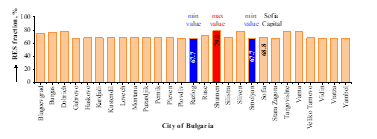 Figure 10: Distribution of RE fractions (%) in Bulgaria’s major cities using a hybrid system, calculated by HOMER Pro.
Harmful CO2 emissions for a single-family house with a hybrid power supply system are between 1.318 and 1.905 kg per year. Figure 11 shows that the baseline level of CO2 emissions when using solely a conventional electrical system is 3.213 kg/year.
When a hybrid energy system is combined with battery storage, the percentage change with a negative sign goes from 41% to 59%, indicating a considerable reduction in harmful CO2 emissions. Several locations of the country, including Shumen, Varna, Targovishte, Sliven, and Dobrich, have the potential to reduce CO2 emissions by twofold.
Nitrogen oxides (NOX) are a group of seven chemical molecules that pollute the air. The results for nitrogen oxides are also presented in that article in a different manner. The situation with nitrogen oxides, or NOX, is identical to CO2 emissions. Nitrogen oxides emissions from a single-family hose powered by the traditional energy system are 6.81 kg per year. In a single-family house, using a hybrid power system reduces hazardous nitrogen oxides by 41% to 57%, depending on the location where the home is located.
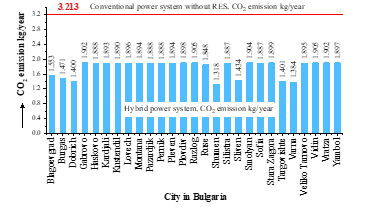 Figure 11: Comparison of CO2 (kg/year) emissions by Bulgarian regions for conventional grid-connected and hybrid power systems.
4. Conclusions
The renewable energy fractions in the proposed hybrid power system for a single-family dwelling in Bulgaria are high, reaching 79 percent in some regions of the country.
Despite the limited percentage of wind energy, there are some areas of the country where a greater number of wind turbines would result in a further reduction in electricity prices.
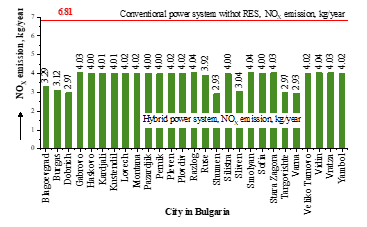 Figure 12: Comparison of NOx (kg/year) emissions by Bulgarian regions for conventional grid-connected and hybrid power systems.
The HOMER Pro software has been successfully used to anticipate greenhouse gas emissions from grid-connected single-family houses in Bulgaria.
When a hybrid power system is used in conjunction with proper energy source and storage management, harmful CO2 emissions can be reduced by up to 59% in some parts of the country. Similarly, NOX generation reductions in some sections of the country might reach 57%, which is an excessively high percentage.
To summarize, the software package Homer Pro may be used effectively for quickly assess harmful greenhouse gas emissions, both in Bulgaria and throughout the European Union’s territory, which is particularly important for transboundary air pollution.
Conflict of Interest
The authors declare no conflict of interest.
Acknowledgement
The authors would like to thank the National Scientific Program NNP “Low Carbon Energy for Transport and Households – Eplus“, D01-214/28.11.2018 for the financial support.
- D. Gospodinova, P. Dineff, K. Milanov, “Greenhouse Gas Emissions Assessment after Renewable Energy Sources Implementation in Bulgarian Grid-Connected Single-Family Houses by HOMER Pro Software,” 2020 12th Electrical Engineering Faculty Conference, BulEF 2020, 2020, doi:10.1109/BULEF51036.2020.9326082.
- M. Kumar, Social, Economic, and Environmental Impacts of Renewable Energy Resources, IntechOpen, 2020, doi:10.5772/INTECHOPEN.89494.
- K.P. Tsagarakis, A. Mavragani, A. Jurelionis, I. Prodan, T. Andrian, D. Bajare, A. Korjakins, S. Magelinskaite-Legkauskiene, V. Razvan, L. Stasiuliene, “Clean vs. Green: Redefining renewable energy. Evidence from Latvia, Lithuania, and Romania,” Renewable Energy, 121, 412–419, 2018, doi:10.1016/J.RENENE.2018.01.020.
- N.K.M.A. Alrikabi, “Renewable Energy Types,” Journal of Clean Energy Technologies, 61–64, 2014, doi:10.7763/JOCET.2014.V2.92.
- IRENA, Overview of renewable energy, Overview of Renewable Energy, 27, Sep. 2021.
- U.S.E.I.A. (EIA), Renewable energy explained – types and usage, 2021.
- J. Kantenbacher, R. Shirley, Renewable Energy: Scaling Deployment in the United States and in Developing Economies, Butterworth-Heinemann: 89–109, 2018, doi:10.1016/B978-0-12-813964-6.00005-7.
- I. Yahyaoui, Renewable Energies and Irrigation, Elsevier: 1–14, 2017, doi:10.1016/B978-0-12-812039-2.00001-6.
- N. El Bassam, “Energy basics,” Distributed Renewable Energies for Off-Grid Communities, 113–122, 2021, doi:10.1016/B978-0-12-821605-7.00005-2.
- European Environment Agency, Air pollution, 2020.
- Enerdata, World Energy Consumption Statistics | Enerdata, Global Energy Consumption Fell in 2020 (-4%), Due to Lockdown Measures and Transport Restrictions, 2021.
- United Nations, Paris agreement, 2015.
- European Commission, 2050 long-term strategy, 2018.
- European Commission, Fourth Biennial Report from the European Union Required under the United Nations Framework Convention on Climate Change, Brussels.
- European Commission, Energy label and ecodesign, About the Energy Label and Ecodesign, 2020.
- European Commission, A Europe that protects: Clean air for all.
- Y. Yongchang, Y. Chuanan, “Implementation of a MPPT Controller Based on AVR Mega16 for Photovoltaic Systems,” Energy Procedia, 17, 241–248, 2012, doi:10.1016/j.egypro.2012.02.090.
- A. Mohanty, M. Viswavandya, D.K. Mishra, P.K. Ray, S. Pragyan, “Modelling & Simulation of a PV Based Micro Grid for Enhanced Stability,” Energy Procedia, 109, 94–101, 2017, doi:10.1016/j.egypro.2017.03.060.
- K. Adam, V. Hoolohan, J. Gooding, T. Knowland, C.S.E. Bale, A.S. Tomlin, “Methodologies for city-scale assessment of renewable energy generation potential to inform strategic energy infrastructure investment,” Cities, 54, 45–56, 2016, doi:10.1016/J.CITIES.2015.10.015.
- A. Gasparatos, C.N.H. Doll, M. Esteban, A. Ahmed, T.A. Olang, “Renewable energy and biodiversity: Implications for transitioning to a Green Economy,” Renewable and Sustainable Energy Reviews, 70, 161–184, 2017, doi:10.1016/J.RSER.2016.08.030.
- H. Ritchie, M. Roser, Energy, 2020.
- Statista, Electricity: share of renewable energy 2007-2018 | Statista, Share of Energy from Renewable Sources in Electricity Generation in Bulgaria from 2007 to 2018, 2021.
- European Commission, Europe 2020 targets: statistics and indicators for Bulgaria | European Commission, Europe 2020 Targets: Statistics and Indicators for Bulgaria, 2020.
- National Statistical Institute, Share of renewable energy in gross final energy consumption | National statistical institute, 2021.
- A.A. Prasad, R.A. Taylor, M. Kay, “Assessment of solar and wind resource synergy in Australia,” Applied Energy, 190, 354–367, 2017, doi:10.1016/J.APENERGY.2016.12.135.
- H. Zhao, Q. Wu, S. Hu, H. Xu, C.N. Rasmussen, “Review of energy storage system for wind power integration support,” Applied Energy, 137, 545–553, 2015, doi:10.1016/J.APENERGY.2014.04.103.
- A. Berrada, K. Loudiyi, “Operation, sizing, and economic evaluation of storage for solar and wind power plants,” Renewable and Sustainable Energy Reviews, 59, 1117–1129, 2016, doi:10.1016/J.RSER.2016.01.048.
- O.M. Toledo, D. Oliveira Filho, A.S.A.C. Diniz, “Distributed photovoltaic generation and energy storage systems: A review,” Renewable and Sustainable Energy Reviews, 14(1), 506–511, 2010, doi:10.1016/J.RSER.2009.08.007.
- F. Baghdadi, K. Mohammedi, S. Diaf, O. Behar, “Feasibility study and energy conversion analysis of stand-alone hybrid renewable energy system,” Energy Conversion and Management, 2015, doi:10.1016/j.enconman.2015.07.051.
- Statista, Worldwide – lithium ion battery pack costs | Statista, Lithium-Ion Battery Pack Costs Worldwide between 2011 and 2030, 2021.
- M.S. Ziegler, J.E. Trancik, “Re-examining rates of lithium-ion battery technology improvement and cost decline,” Energy & Environmental Science, 14(4), 1635–1651, 2021, doi:10.1039/D0EE02681F.
- I. Miranda, N. Silva, H. Leite, “A Holistic Approach to the Integration of Battery Energy Storage Systems in Island Electric Grids with High Wind Penetration,” IEEE Transactions on Sustainable Energy, 7(2), 775–785, 2016, doi:10.1109/TSTE.2015.2497003.
- S. Mazzola, C. Vergara, M. Astolfi, V. Li, I. Perez-Arriaga, E. Macchi, “Assessing the value of forecast-based dispatch in the operation of off-grid rural microgrids,” Renewable Energy, 108, 116–125, 2017, doi:10.1016/J.RENENE.2017.02.040.
- C. Zhang, Y. Xu, Z.Y. Dong, J. Ma, “Robust Operation of Microgrids via Two-Stage Coordinated Energy Storage and Direct Load Control,” IEEE Transactions on Power Systems, 32(4), 2858–2868, 2017, doi:10.1109/TPWRS.2016.2627583.
- H.H. Abdeltawab, Y.A.R.I. Mohamed, “Market-oriented energy management of a hybrid wind-battery energy storage system via model predictive control with constraint optimizer,” IEEE Transactions on Industrial Electronics, 62(11), 6658–6670, 2015, doi:10.1109/TIE.2015.2435694.
- M.R. Sandgani, S. Sirouspour, “Coordinated Optimal Dispatch of Energy Storage in a Network of Grid-Connected Microgrids,” IEEE Transactions on Sustainable Energy, 8(3), 1166–1176, 2017, doi:10.1109/TSTE.2017.2664666.
- H.P. Software, HOMER Pro, 2020.
- D. Gospodinova, K. Milanov, M. Minchev, P. Dineff, “Techno-Economic Feasibility Analysis of Nearly-Zero Hybrid Energy System for the City of Sofia in Bulgaria,” in 2019 11th Electrical Engineering Faculty Conference, BulEF 2019, 2019, doi:10.1109/BulEF48056.2019.9030697.
- H. Sharma, É. Monnier, G. Mandil, P. Zwolinski, S. Colasson, “Comparison of environmental assessment methodology in hybrid energy system simulation software,” Procedia CIRP, 80, 221–227, 2019, doi:10.1016/j.procir.2019.01.007.
- D. Gospodinova, K. Milanov, P. Dineff, “Route map for renewable energy sources implementation for household in Bulgaria,” in IOP Conference Series: Materials Science and Engineering, IOP Publishing: 012016, 2020, doi:10.1088/1757-899X/878/1/012016.