Spatio-Temporal Analysis of Drought over the Guinean-Sudano Ecological Zone, Northern Nigeria

Adv. Sci. Technol. Eng. Syst. J. 6(6), 151–166 (2021);
 DOI: 10.25046/aj060620
Drought has become more common and severe in recent decades due to increased global changes in climatic conditions and anthropogenic activities thereby analyzing drought at both regional and local levels is crucial. And so, this study aims at assessing drought risk in Northern Nigeria using NDVI and SPI. Data used included satellite images (Landsat OLI-TIRS, ETM+, TM, and MSS) meteorological data, and gridded precipitation datasets (1975 – 2016) from the Climate Research Unit (CRU). The drought index was calculated using the Standardized Precipitation Index (SPI) for both short-term and long-term timescales with emphasis on drought magnitude, frequency, duration. The Mann-Kendall trend analysis was utilized on precipitation and SPI to investigate the trend changes. Results indicated that SPI dynamics over the region at varying timescales suggest the unpredictability of drought with longest drought duration were the severe and extreme drought (SPI ≤ − 1.5) was peaked at -3.12 severity that lasted 15months between 2007 and 2008. The worst drought magnitudes were more eminent in the longer timescale (SPI12months) with its peak of -70.8 that lasted 60months (5years) between 1984 and 1986. Similarly, drought intensity was observed between the mildly dry with SPI -0.47(1986 – 1991) and severely dry with SPI − 1.79 (1983 – 1984) this further revealed that spatially drought risk is increasing southward. NDVI values obtained demonstrated a consistent decrease with a better state in 1975 which ranged between – 0.31 and 0.63. 2016 recorded lower values with a range between -0.21 and 0.47. NDVI minimum and maximum values were between -0.48 and 0.63 between 1975 and 2016, while in 2016 highest of 0.47 was observed as the least maximum value with 1975 recording the highest value at 0.63. The results demonstrated that drought conditions within the Guinean-Sudano ecological zone of northern Nigeria are evident due to rapid unpredictable climatic changes and anthropogenic activities.
1. Introduction
Drought is among the most destructive natural disasters in the world. It often causes far-reaching damages to natural ecosystems, results in water shortages, and increased risks of surface temperatures and desertification amongst others. Contrary to other extreme phenomena (such as floods and tornadoes), drought results from below-normal precipitation combined with warm temperatures over months to years [1] with variations in drought frequency and severity often of enormous concern. The primary cause of most droughts can be associated with fluctuating atmospheric patterns such as low rainfall, cloud cover, and greater evaporation rates [1] which are exacerbated by anthropogenic activities.
Droughts are universally divided into four types: meteorological drought (abnormally low precipitation), hydrological drought (precipitation shortages that impact the surface and groundwater levels), agricultural drought (decreased soil moisture that impacts crops), and socio-economic drought (decreased water supply that affects people and supply of goods) [2,3]. However, the meteorological drought influences both agricultural and hydrological droughts to occur [4,5] Droughts can also be classified by length, intensity, regional distribution, frequency, and onset rate [6].
Droughts occur worldwide but their frequency, duration, and severity differ by location. According to Trenberth, the size, intensity, frequency, and spatial coverage of the dry area has increased since the 1970s across the globe particularly in Africa, East, and South Asia, eastern Australia, Southern Europe, Northern and Southern America, most of Alaska, and Western Canada [7]. There were about 669 incidences of drought reported worldwide between 1960 and 2016, with approximately 2.2 million deaths that affected over 2.6 billion people leading to an estimated economic impact of 146 billion US Dollars [8]. Unlike developed countries, underdeveloped and developing countries are the worst hit by the impact of climate change due to physical, social, and economic factors [9].
The extreme weather and climate events including droughts and floods have significant impacts on the economy, natural resources, and human health in Africa [9]. In this regard, the negative impacts of drought are more severe in sub-Saharan Africa, where rain-fed farming encompasses 95% of all agriculture [10,11]. Also, crop production and food security are mainly threatened by drought where the effects are inter-temporal and long-lasting [12,13]. Africa stands top with a total of 289 reported drought events that had about 700 thousand deaths and above 414 million people unsettled between 1960 and 2015 [14]. This threat is expected to further exacerbate the existing widespread poverty and food insecurity with the situation similar within other regions of sub-Saharan Africa [14–16]. In West Africa, [17] revealed there is about a 40% decline in annual precipitation total from the year 1968–1990 as compared with the 30 years between 1931 and 1960. So, frequent drought occurrences within the West African region have caused famine and are threatening the African savanna regions while making the populace highly vulnerable to drought [18].
Likewise, the situation in Nigeria is not any different, drought occurrences and reoccurrences have been reported in Nigeria for decades [19] that have grown and gradually migrated southward particularly within Nigeria’s Guinean-Sudano ecological zone [20,21]. This indicates that drought risks will continue to expose residents in this area with its impacts comprising mass starvation, famine, destruction of ecosystems, socio-economic instability and poverty [22] particularly in areas where agriculture is the mainstay of the economy as the case of the Guinean-Sudano zone in northern Nigeria. Therefore, it is essential that regular drought monitoring is conducted to provide preventive policy aid for long and medium-term planning.
From the 20th century, scientific studies had adopted climatic (temperature and precipitation) and hydrological (soil moisture and streamflow) indicators as main input towards the generation of indices for quantitative modeling of drought severity [23] as depicted in the Standardized Precipitation Index (SPI) proposed by [24]. However, further advances in the study of drought between the 20th and 21st centuries led to the acceptance of over 150 indices for drought studies [25] several regions with different climatic conditions. Thus, many drought studies have depended on the availability of data from several remote sensing systems applied in a variety of methodologies. These include NDVI-based conceptualizations like soil Adjusted Vegetation Index (SAVI) [26] and more advanced methods now include indices such as Drought Severity Index (DSI) proposed by [27] applied in [28]. In Nigeria, not until recently, statistical techniques such as SPI and SPEI were the most used indices in drought assessment. Nonetheless, the introduction of Geo-information Systems (GIS) and remote sensing that has championed the adoption of integrated methods in the monitoring of drought has proven to provide better and more robust options to mitigating drought. Lately, [21,29,30] amongst others have employed combined techniques through satellite-based applications such as NDVI and statistical techniques like SPI/ SPEI in drought assessment over the Sudano-Sahelian region and North Central of Nigeria. The integrated techniques were utilized in examining vegetation health and response to drought and in predicting the occurrence duration and severity of drought events.
Nevertheless, there have been little or no reports on drought vulnerability and risk even though it is virtually common knowledge to land users such as farmers within the Guinean-Sudano region which comprises 5 ecological zones namely: Derived, Guinea, Sudan, and Sahel Savannas, and Jos Plateau. Therefore, this study aims to analyze drought in northern Nigeria using NDVI and SPI indices for effective prevention and mitigation towards sustainable development.
2. Methodology
2.1. Study area
From south to north, the ecological zones of Nigeria are Mangrove Swamp and Coastal Vegetation, Freshwater Swamp Forest, Lowland Rain Forest, Derived Savanna, Guinea Savanna, Sudan Savanna, and Sahel Savanna [31]. A few mountainous areas are found on the Jos Plateau, Adamawa, Taraba, and northern part of Cross-River State (Figure 1), but for this study, 4 States (Bauchi, Gombe, Plateau, and Nassarawa), as well as the Federal Capital Territory (FCT) were used to illustrate the climatic variation across major ecological zones in northern Nigeria.
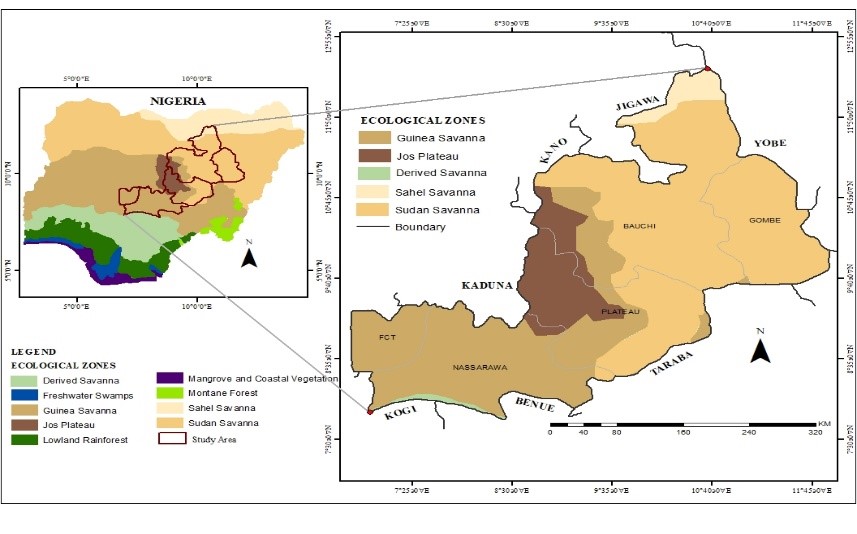 Figure 1: Ecological Zones in Nigeria
The study area lies between latitude 9°15′ and 12° 30′ North and longitude 6° 45′ and 12° 00’East. It falls within the Sahel, Sudan, Guinea, and the Jos Plateau ecological zones with a little portion of derived Savanna southward area covering an area of 133,232 square kilometers (Km2) accounting for 14.42 percent of Nigeria’s total landmass. The study area is bordered by Yobe, Jigawa, and Kano States to the north; Borno and Adamawa states to the east; Kaduna and Niger States to the west; and Kogi, Benue, and Taraba States to the south (Figure 2). Northern Nigeria constitutes about 80% of the vegetative zones, records lower rainfall, shorter wet season and they make up the Savanna land [23].
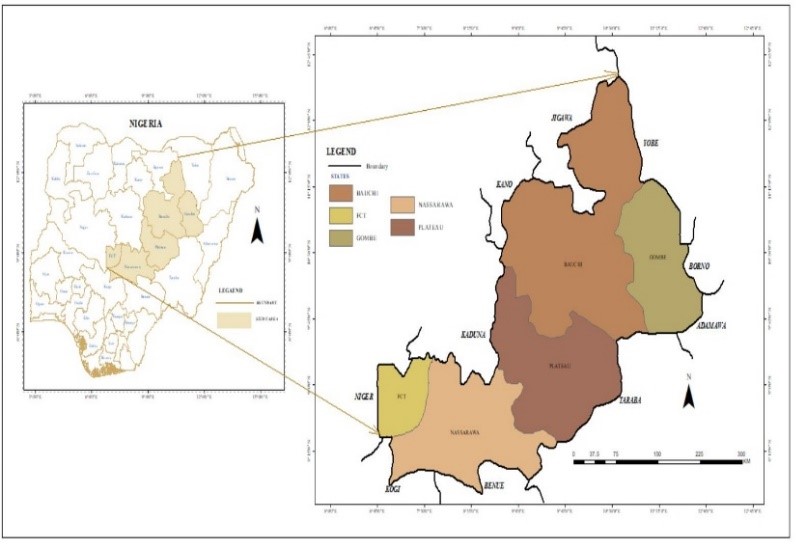 Figure 2: The study area, Bauchi, Gombe, Plateau, and Nassarawa States including FCT
Rainfall is mostly seasonal and extremely unstable through the years with two distinct seasons (dry and wet). The dry season covers up to a period of about 7-8 months, from October to April/May, and the wet season about 4-5 months, from May to September with annual rainfalls between 600 – 1500 mm [21,31]. The study area consists of predominantly 2 drainage systems: the River Niger drainage system consists of the River Niger and its tributaries, prominent among which are the: Benue, Sokoto-Rima, Kaduna, Gongola; and Lake Chad inland drainage system that draws the following in-flowing rivers from Nigeria: the Komadougou-Yobe (with headstreams including Hadejia, Jama’are, and Misau) and the Yedseram [32].
Northern Nigeria is rich in agricultural produce nevertheless the enormous inter-annual inconsistency of rainfall undermines it to intermittent dry spells which occasionally result in the widespread drought that can inflict grievous socio-economic constraints [23]. Irrigation is generally practiced and crops include grains (rice, wheat, soybeans, beans, maize, millet, amongst others), tuber crops (yam and cassava) mainly from the Guinea-savanna zone [22]. Cotton and groundnut, which are economic crops are found in this region mainly in the midland zone and Sahel zones [21]. The Savanna landforms are the tremendous natural habitat for a large number of grazing livestock such as cattle, goats, horses, sheep, camels, and donkeys [15]. The Geology to which the region belongs mostly in the basement complex rocks formation made of older and younger granites formed during the geologic period of the pre-cambrea era [15]. The region had a total population of 13,499,215 in 2006 with about 32.8% growth to 20,082,239 in 2016 [33] with a majority of the population living below the poverty line with income below 361 USD per annum as poverty data reported an average of 55% poverty rate across the region [34]. Hence the dire need to assess drought conditions in northern Nigeria and particularly across the ecological zones.
2.2. Data and Methods
This paper investigates the spatiotemporal variability of drought incidence in the Guinean-Sudano zone of northern Nigeria between 1975 and 2016. The study is based on an analysis of a calculated space-time field of the Standardized Precipitation Index (SPI), as proposed by [24] combined with NDVI to provide a robust assessment of drought within the Guinean-Sudano zone of northern Nigeria.
SPI offers several advantages which were highlighted by [35]as a starting point for meteorological drought monitoring. First, SPI is probability-based, and therefore it is easy to interpret and allows for comparison across space and time [4]. This led to its endorsement through the Lincoln Declaration on Drought Indices as the standard for evaluating the occurrence of meteorological drought [36]. However, the time series should have a minimum of 30 years of data, even when missing data are accounted for [15,37] which has influenced our 45-year temporal assessment. For these reasons, SPI has been used in drought assessment and monitoring in various climes across the globe and particularly in Africa where data availability is an issue.
The impact of drought on society and agriculture is a dire situation that requires reliable indices that identify the geospatial and temporal aspects of drought occurrences and their intensity to determine the impact and also for decision-making and research [38]. Therefore, development and advancements in space expertise on topical issues such as drought detection, monitoring, and assessment have been achieved with the formulation of plans to deal with this slow-onset disaster [4]. With the help of environmental satellites, drought can be recognized 4-6weeks earlier than before and defined precisely, and its impact on agriculture can be diagnosed far in advance of harvest, which is the most vital for global food security and trade [39].
Furthermore, drought indices calculated at a single area are only valid at that location. As a result, one of the key disadvantages of climate-based drought analysis is their lack of spatial precision, as well as the fact that they rely on data collected at weather stations, which can be sparsely dispersed, lowering the dependability of the drought [4,39,40]. Hence, satellite-derived drought indicators based on satellite-derived surface data have become frequently used in drought research [28]. NDVI is one of the most used vegetation indicators.
The Normalized Difference Vegetation Index (NDVI) is a measure of vegetation health and density [41]. The formula for NDVI is: NDVI= (NIR-RED)/ (NIR+RED). The NIR and RED are the reflectance values of near-infrared and red bands which vary from +1 to -1. NDVI is a good indicator of green biomass, leaf area index, and patterns of production [41]. Remotely sensed data have been used to evaluate climatic and environmental changes at regional and global scales [42]. It can be used for the description of land cover, vegetation classification, and health but is also effective for monitoring rainfall and drought [43]. The sensitivity of NDVI values to rainfall fluctuations varies regionally, owing to the effects of variation in features such as vegetation type and soil background [44].
2.3. Datasets and their characteristics
Secondary data were utilized for this study with primary sources from field observations and GPS measurements. Landsat satellite images of Bauchi, Gombe, Plateau, and Nassarawa States including FCT were acquired for 1975, 1990, 2005, and 2016 obtained from the United States Geological Survey (USGS) Earth Explorer platform.
In addition, rainfall data were acquired from Nigerian Meteorological Agency (NIMET) for 10 weather stations using the monthly rainfall data for the period of forty-one years (1975 – 2016). Though gauge measurements provide high-quality estimates of rainfall and other weather parameters, their availability is a major constraint especially in sparsely populated areas such as drylands [45]. Therefore, gridded data sets were utilized to supplement for no data area where climatic data for 5 States over the study area to allow interpolation were obtained from data developed by the University of East Anglia at a spatial resolution of 0.5×0.5 degrees covering a temporal range of 1975 to 2016 [45]. These datasets are developed using models and algorithms; integrating ground observations and satellite recorded imageries in multiple wavelengths [45] have provided an alternative to gauge data at a broad scale with varying Spatio-temporal resolutions thereby helping overcome the foregoing constraints by providing more homogenous spatial and temporal coverage for most locations across the world including un-gauged regions [45].
2.4. Determination of SPI and NDVI
The Standardized Precipitation Index (SPI) developed by [24] is a popular index that is used to characterize drought at varying time scales. SPI is computed by finding the probability of precipitation data of a given frequency over an area [11,25]. Positive SPI values connote wet conditions; the higher the SPI, the more unusually wet a period is [25]. Negative SPI values signify dry conditions; lower SPI implies the more abnormally dry a period is (Table 1). This was computed using SPI Generator created by [46].
Table 1: Standard Precipitation Index (SPI)
| SPI VALUES | DESCRIPTION |
| 2> | Extremely wet |
| 1.5 – 1.99 | Very wet |
| 1.0 – 1.49 | Moderately wet |
| 0 – 1.0 | Mildly wet |
| -1 to 0 | Mildly drought |
| -1.5 to -1.0 | Moderately drought |
| -2 to -1.5 | Severe drought |
| -2 < | Extreme drought |
The drought magnitude was obtained as the aggregate SPI over the drought months taken as a positive value [39]. The intensity (drought severity) was computed as the magnitude divided by drought duration [11,39].
Since the input parameter for SPI computation is precipitation, trend analysis of precipitation was done to study the local changes in climate. The Mann-Kendall non-parametric test was adopted in this work to assess the trends in precipitation and SPI aimed at testing the statistical distribution of the data records. There are several approaches to trend analyses available but the Mann-Kendall was the most preferred and used test for assessing the trends in hydro-climatic studies [38,47,48].
SPI values for 15 locations under the periods between 1975 and 2016 were interpolated using the Inverse Distance Weighted Technique (IDW) and according to [49] interpolation provided optimal areal estimates in any given situation and is applicable both for drought and flood. The interpolation maps are thus been reclassified into drought severity classes. The SPI map was further integrated using the cell statistic tool in ArcGIS to generate a drought risk map.
In calculation of SPI, we adopted methods
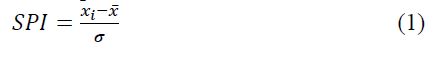
where: xi = observed precipitation value of the selected period during a particular year;
X and σ = the mean and the standard deviation respectively over the selected period.
The criteria employed by [4,24] were utilized in the quantification and classification of the SPI drought severity status of the study. Drought classification with monthly SPI ≤ − 1.00 were considered to be as drought commencement and cessation since mild drought (SPI between − 0.99 and 0.99) showed only a slight variation from the normal rainfall distribution [50–52]. Therefore, using the SPI_SL_6.exe algorithm, the severity of the drought was generated and plotted as graphs and maps. Temporal drought event characteristics (frequency, magnitude, intensity, and severity status) were computed using one of the SPI analysis parameters.
Drought frequency is the return period between drought events that have severity threshold values of SPI ≤ − 1 [52]. The magnitude of drought event tallies with the collective water dearth during the drought period below a certain threshold (SPI-values ≥ −1) and drought intensity (DI) is the ratio between the drought magnitude and the duration of the event [50,52] computed as:
Drought magnitude
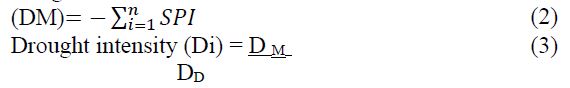
where: DM = drought magnitude,
n = number of months with drought event at j timescale; and
DD = drought duration.
Drought severity (DS) must not be muddled with intensity, which refers to the drought event’s lowest SPI number [53]. The number of droughts per 100 years for several timescales of the rainy months and seasons (SPI: 3-, 6-, and 12-months) in the study as assessed by [51,52,54] were:
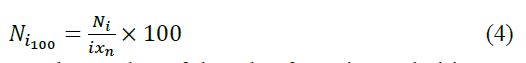
where: Ni100 = the number of droughts for a timescale i in 100 years;
Ni = the number of years with droughts for a timescale i in the n-year set;
i = the timescales (3-, 6- and 12- months), and n = the number of years in the data set (45 years).
The MK (Mann Kendall) trend test [55,56] has been computed to substantiate the statistical significance (increasing and decreasing trends) for wet months and seasons of SPI: 3-, 6- and 12- months timescales. The relative strength of the MK trend test in time series analysis has been quantified using Sen’s Slope Estimator (SSE) [57]. The analysis was carried out by the Addinsoft XLSTAT as applied by [58].
The Mann-Kendall trend test (S) is calculated as:
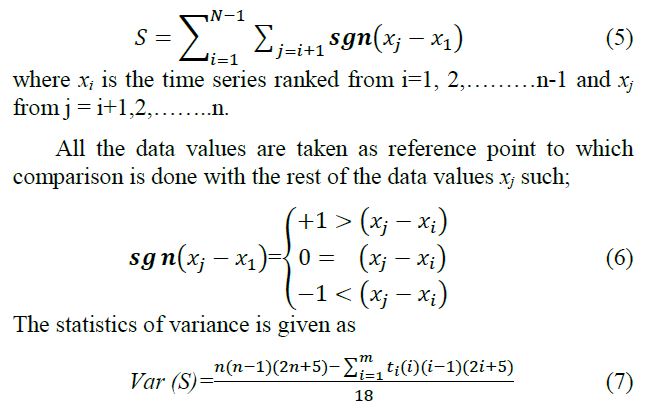
where ti represents number of ties up to sample value i.
Sen’s Slope Trend Estimator (SSE)
The Sen’s trend estimator test was described by[57] and the magnitude of the trend is given by
 where xj and xk are considered as data points j and k (j > k) compatibility. The median of these N values of Ti is represented as Sen’s estimator of slope which is given as
Positive and negative figures of Qi represent upward (increasing) and downward (decreasing) trends, respectively. To measure the Spatio-temporal occurrence of drought over the area under study, the 3-, 6- and 12-month SPI were used. These time lags are enough for drought frequency and intensity assessment [39,40]. The SPI was computed on a monthly scale so that the consistency of drought duration and intensity can be determined according to table 2.
In addition, Normalized Difference Vegetation Index (NDVI) was computed. The NDVI datasets were obtained from the Landsat OLI- TIRS, ETM+, TM, and MSS with NDVI universally defined as:
NDVI= NIR – RED (10)
NIR + RED
where NIR is the Near Infra-red band and Red is the red band in the electromagnetic spectrum. Furthermore, a correlation and regression analysis were carried out to observe the relationship between SPI and Vegetation cover over the study area.
3. Results
The Standardized Precipitation Index (SPI) developed [24] is a popular index that is used to characterize drought at different time scales.
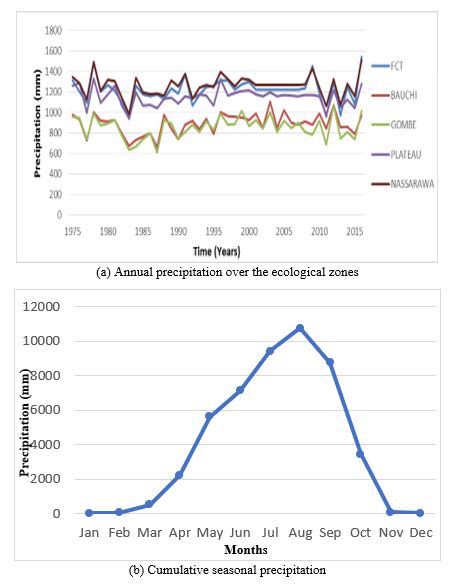 Figure 3: Unpredictability of precipitation over the ecological zones
3.1. The pattern of precipitation and drought events;
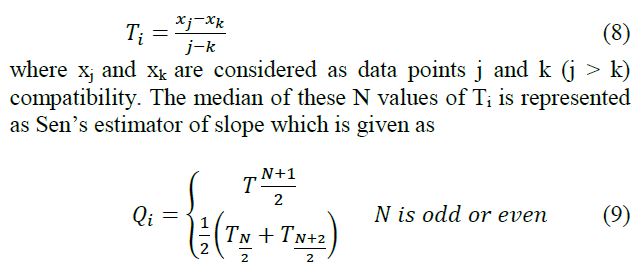
The characteristics of precipitation over the ecological zones Figure 3a and b revealed that long precipitation occurs between June and September with its peak in August while the short precipitation occurs between November and March. Rainfall variability was eminent year to year across the zone with states within similar ecological zones exhibiting similar precipitation patterns. Bauchi and Gombe states within the Sahel and Sudan exhibited similar rainfall dynamics with the least record of 661mm/yr and 614mm/yr in 1987 respectively while peak annual precipitation of 1547mm/year was recorded in FCT, 2016. Correspondingly, Plateau and Nassarawa states including FCT showed similar rainfall patterns within the Guinean savanna and Jos Plateau ecological zones.
Table 2: Drought Characteristics over the ecological zones
|
LOCATIONS |
TIME SCALE | YEAR | DURATION
(months) |
MAGNITUDE | INTENSITY |
PEAK |
| ABUJA
|
SPI 3 | 2013-2014 | 11 | -11.83 | -1.0755 | -2.95 |
| SPI 6 | 2013-2014 | 11 | -12.99 | -1.1809 | -2.85 | |
| SPI 12 | 1986- 1991 | 59 | -27.59 | -0.4676 | -2.27 | |
| BAUCHI
|
SPI 3 | 1977- 1978 | 9 | -8.78 | -0.9756 | -2.96 |
| SPI 6 | 1977- 1978 | 12 | -13.14 | -1.0950 | -2.85 | |
| SPI 12 | 1983- 1988 | 60 | -67.79 | -1.1298 | -2.15 | |
| GOMBE
|
SPI 3 | 1977- 1978 | 9 | -7.40 | -0.8222 | -2.89 |
| SPI 6 | 1984- 1986 | 23 | -19.46 | -0.8461 | -2.85 | |
| SPI 12 | 1983- 1984 | 60 | -70.80 | -1.1800 | -1.97 | |
| PLATEAU
|
SPI 3 | 1977-1978 | 11 | -6.84 | -0.6218 | -3.06 |
| 2013- 2014 | 11 | -8.83 | -0.8027 | |||
| SPI 6 | 2007- 2008 | 15 | -16.38 | -1.0920 | -3.12 | |
| SPI 12 | 1986- 1988 | 25 | -19.80 | -0.7920 | -2.35 | |
| 1994- 1996 | 25 | -17.26 | -0.6904 | |||
| NASSARAWA
|
SPI 3 | 1982- 1984 | 17 | -22.03 | -1.2959 | -3.02 |
| SPI 6 | 1983- 1984 | 15 | -26.80 | -1.7867 | -2.99 | |
| SPI 12 | 2010- 2012 | 24 | -28.65 | -1.1938 | -2.37 |
Hence, seasonal variation over the ecological zones (Figure 3b.) further depicted impacts these fluctuations could cause to food production as the region is majorly agrarian and dependent on rain-fed agriculture.
Characteristics of drought events (duration, magnitude, and intensity) Table 2 shows the observed drought duration, magnitude, and intensity of the slight, large, and long-term rainy epochs and spells as computed using SPI. SPI at various timescales of 3, 6, and 12months were calculated with shorter timescales (3 and 6 months) exhibiting high variability in both wet and dry spells however, the longer timescale at 12 months witnessed lesser variability (Figure 4) which is an extraction of SPI over the region. SPI dynamics over the region at varying timescales suggest the unpredictability of drought. Periods with the longest drought duration were within the severe and extreme drought (SPI ≤ − 1.5) which was peaked at -3.12 severity that lasted 15months between 2007 and 2008. The worst drought magnitudes were more eminent in the longer timescale (12months) with its peak of -70.8 that lasted 60months (5years) between 1984 and 1986. Similarly, drought intensity was observed between the mildly dry with SPI -0.47(1986 – 1991) and severely dry with SPI − 1.79 (1983 – 1984). Seasonally, a visibly slight difference was observed in the drought magnitude among the SPI3/6months (short-term) and SPI12-months (long-term) seasons. The drought magnitude, duration, and intensity were diverse from mildly dry to severe drought irrespective of the timescales or ecological zones with the worst intensity condition during SPI6 (short-term) − 1.79 and SPI12 (long-term) − 1.19 respectively.
Plateau and Nassarawa states experienced the worst drought conditions despite being situated within the Jos Plateau and Guinea savanna ecological zones where conditions are assumed to be within the sub-humid region compared to drylands. This further reaffirms that drought incidences have grown and gradually migrated southward with very unstable patterns.
1.1. Spatial and Temporal representation of SPI over the Guinean-Sudan ecological zone
Figure 5 shows the spatial illustration of SPI from 1975 to 2016 over the Guinean-sudano ecological zone of Nigeria. Results revealed that 1975 recorded the highest precipitation than the 1990, 2005, and 2016 hydrological years. It is crucial to note that most ecological zones that recorded high precipitation in some years also recorded the least in other years thus, reaffirming the fact that precipitation over the region fluctuates and drought is not peculiar to one or a particular region. Similarly, the unstable pattern of precipitation observed indicates its randomness which imposes a grievous burden on agriculture, water resources, and livelihood within the region.
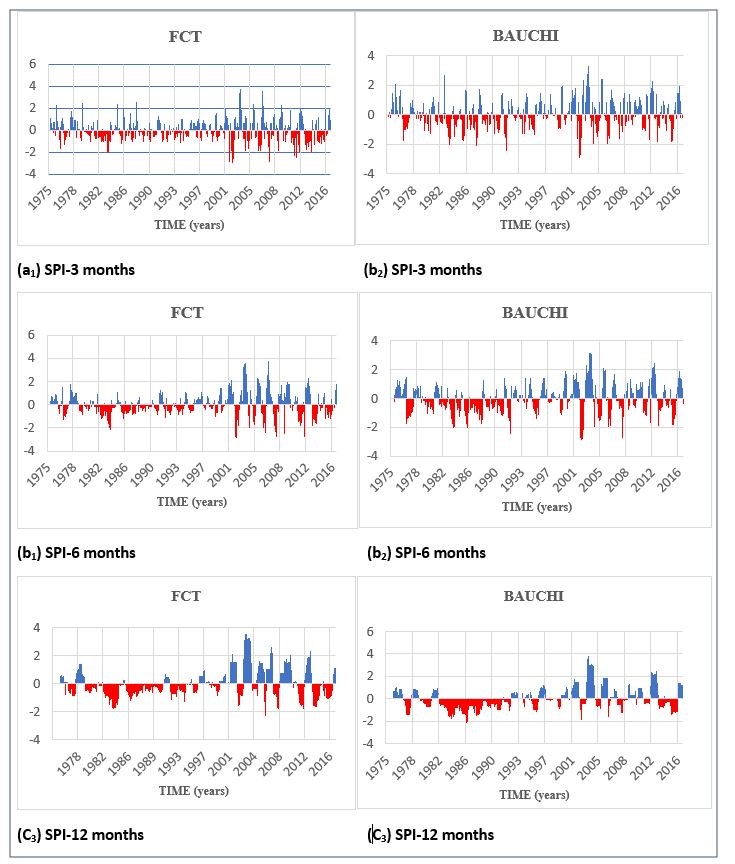 Figure 4: Extraction of SPI at different timescales
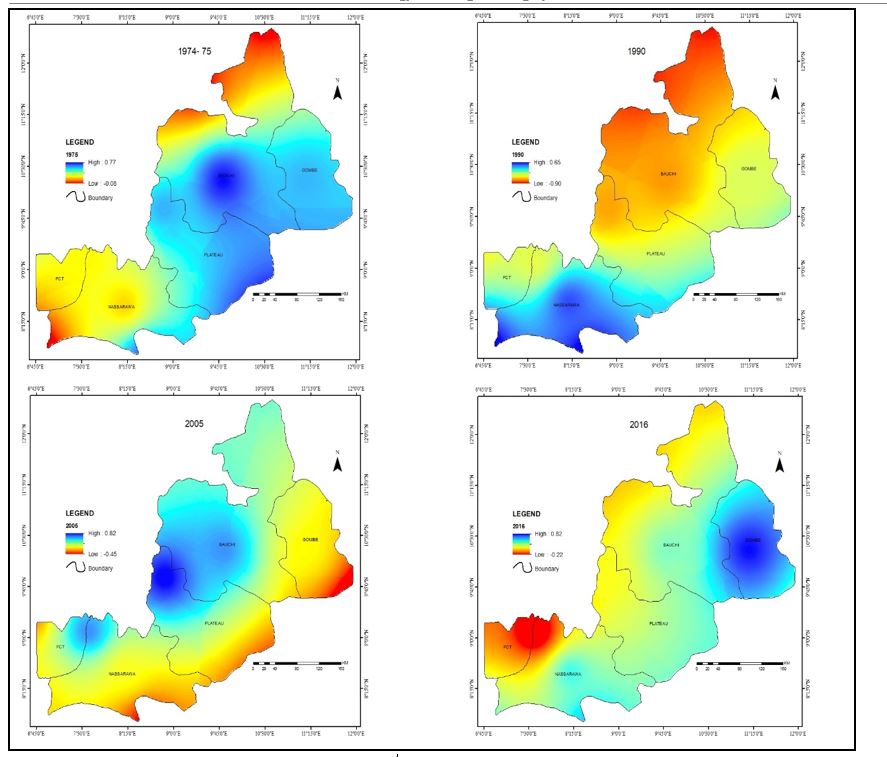 Figure 5: Spatial representation of SPI for different hydrological years over the region
Figure 6a above shows the mean spatial drought magnitude which was depicted as positive values and corresponding duration (Figure 6b) across the ecological zones for different hydrological epochs. Results showed that drought magnitude peaked in 1983-1984, 1988 with the longest duration of 5years. Mean drought magnitude was highest in 1990 with 10.81 and closely followed by 2005 with a mean magnitude of 8.33 (Figure 6). Both mean magnitudes were observed within the Sahel, Sudan, and Jos Plateau ecological zones as represented in the states under review.
A southward shift in the magnitude reflected the inconsistency of drought in the region. 1975 recorded the least mean drought magnitude with worst values at 1.109 while the longest duration was 12 months in all 4 epochs. It appeared drought severity and magnitude incidences varied from a location to another through the years under review. However, 2002 recorded the worst-hit year as across the region Bauchi, Gombe, Plateau, and FCT experienced various degrees of drought for a duration as high as 8months with its peak at -2.85 experienced in Bauchi, Gombe states, and FCT.
1.2. Drought risk mapping over the Guinean- Sudano zone of Nigeria
Figure 7 above revealed spatial drought severity which in turn illustrated the drought risk of the region. The drought characteristics of the region were classified into three and base on the mean drought intensity (severity) values. The results revealed that drought could be classified as mildly wet, mild drought, and moderate drought at a macro level however at local levels drought mechanisms are more complex and the drivers are highly dependable on the local environmental conditions prevalent in the states [26,39]. Drought events were linked to low precipitation values that were closely reflected through the SPI values. However, it reaffirms that environmental problems are best and in-depth managed at the local levels when knowledge of the micro climatic condition is considered.
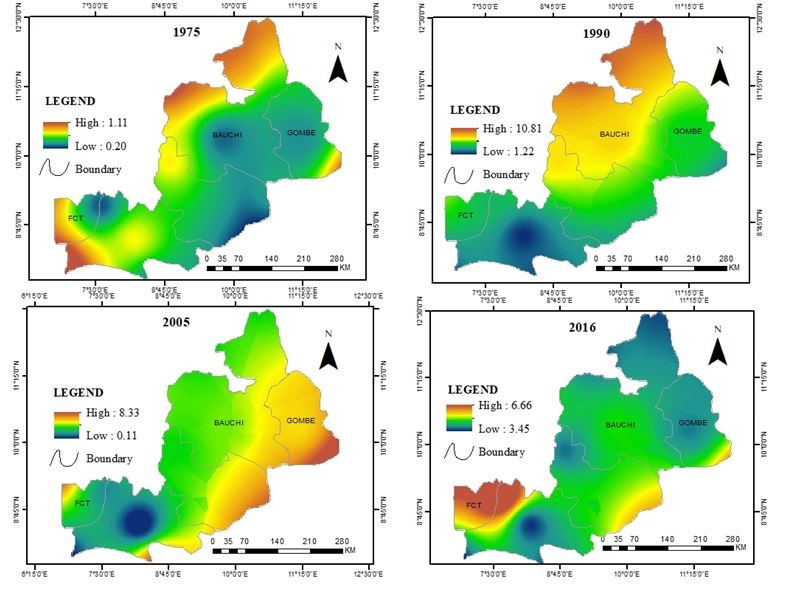
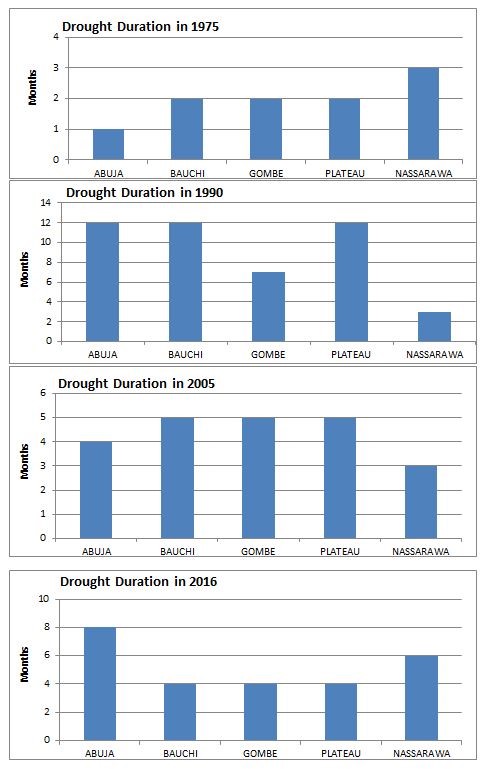 Figure 6: Spatial illustration of average drought magnitude and duration for different hydrological years
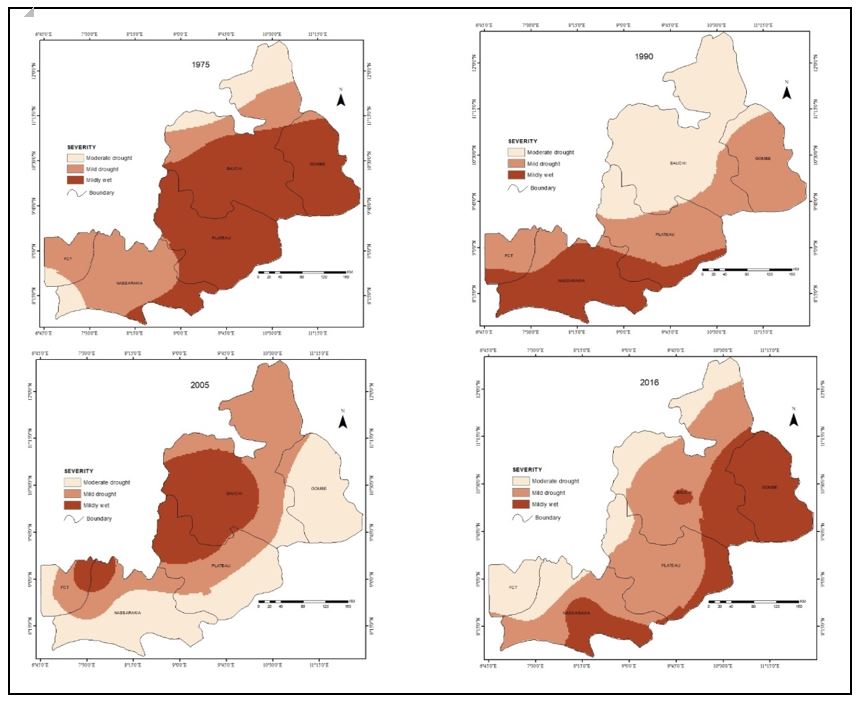 Figure 7: Drought severity over the ecological zones
Table 3: Mann-Kendall and significance level of SPI-3, -6, -12 over the Guinean-Sudano ecological zone
| DURATION | PARAMETER | FCT | BAUCHI | GOMBE | PLATEAU | NASSARAWA | REGIONAL |
| SPI 3 | Kendall tau | -0.008 | 0.073 | 0.023 | 0.006 | -0.009 | 0.017 |
| (Significance) | 0.85 | 0.081 | 0.579 | 0.892 | 0.852 | 0.6508 | |
| Sen’s slope | 0.0002 | 0.008 | 0.005 | 0.001 | -0.001 | 0.00264 | |
| Trend | No | No | No | No | No | No | |
| SPI 6 | Kendall tau | 0.055 | 0.092 | 0.06 | 0.045 | 0.024 | 0.0552 |
| (Significance) | 0.254 | 0.074 | 0.271 | 0.376 | 0.641 | 0.3232 | |
| Sen’s slope | 0.008 | 0.011 | 0.008 | 0.003 | 0.003 | 0.0066 | |
| Trend | No | No | No | No | No | No | |
| SPI 12 | Kendall tau | 0.111 | 0.148 | 0.077 | 0.06 | 0.043 | 0.0878 |
| (Significance) | 0.041 | 0.009 | 0.016 | 0.269 | 0.454 | 0.1872 | |
| Sen’s slope | 0.012 | 0.019 | 0.01 | 0.007 | 0.03 | 0.0156 | |
| Trend | Yes | Yes | Yes | No | No | No |
Table 4: Mann-Kendall and significance level of precipitation over the Guinean-Sudano ecological zones
| STATES | KENDALL | SIGNIFICANCE LEVEL | SEN’S SLOPE | TREND |
| FCT | 0.083 | 0.448 | 0.649 | No |
| BAUCHI | 0.136 | 0.209 | 1.904 | No |
| GOMBE | 0.027 | 0.812 | 0.235 | No |
| PLATEAU | 0.001 | 0.97 | 0.007 | No |
| NASSARAWA | 0.041 | 0.713 | 0.609 | No |
| REGIONAL | 0.058 | 0.630 | 0.681 | No |
1.3. Spatial trends in drought across the Guinean- Sudano zone of Nigeria
The spatial and temporal variability in drought trends were observed in the study area and shown in Table 3 as the Negative and Positive SPI trends at multiple time scales. Of all the SPI representations tested, only SPI-12 indicated significant trend values in Bauchi, Gombe, and FCT with Sen’s slope (Kendal tau) values of 0.019 (0.148), 0.01 (0.077), and 0.012 (0.111) respectively.
However, no trend existed at the regional level with Sen’s slope (Kendal tau) values of 0.0156 (0.088). The Mann-Kendall trend test of SPI-values revealed statistically significant (insignificant) decreasing trends for short-term months in FCT and Nassarawa state which are within the Guinea savanna with Kendall tau values of -0.008 and -0.009 respectively. SPI6- month timescales showed statistically non-significant increasing trends across the ecological zones. So, the Null hypothesis (Ho) was accepted across the ecological zones for timescales -3 and 6-months as the recorded values were greater than the significance level (p-value 0.05) while the alternative hypothesis for FCT (Guinea savanna); Bauchi and Gombe states (within the Sahel-Sudan savanna) respectively were accepted principally for SPI-12. These denoted that SPI 12- shows the status of a year-round water shortage caused by drought while SPI-6 and SPI-3 are appropriate indicators of the status of a seasonal water shortage caused by drought [39].
Table 4 shows positive annual precipitation trends over the ecological zones which exhibited a significantly increasing trend occurred both locally in the states and regionally for the periods under review. Thus, in verifying the status of drought over the ecological zone, some water reservoirs were visited (Figure 8).
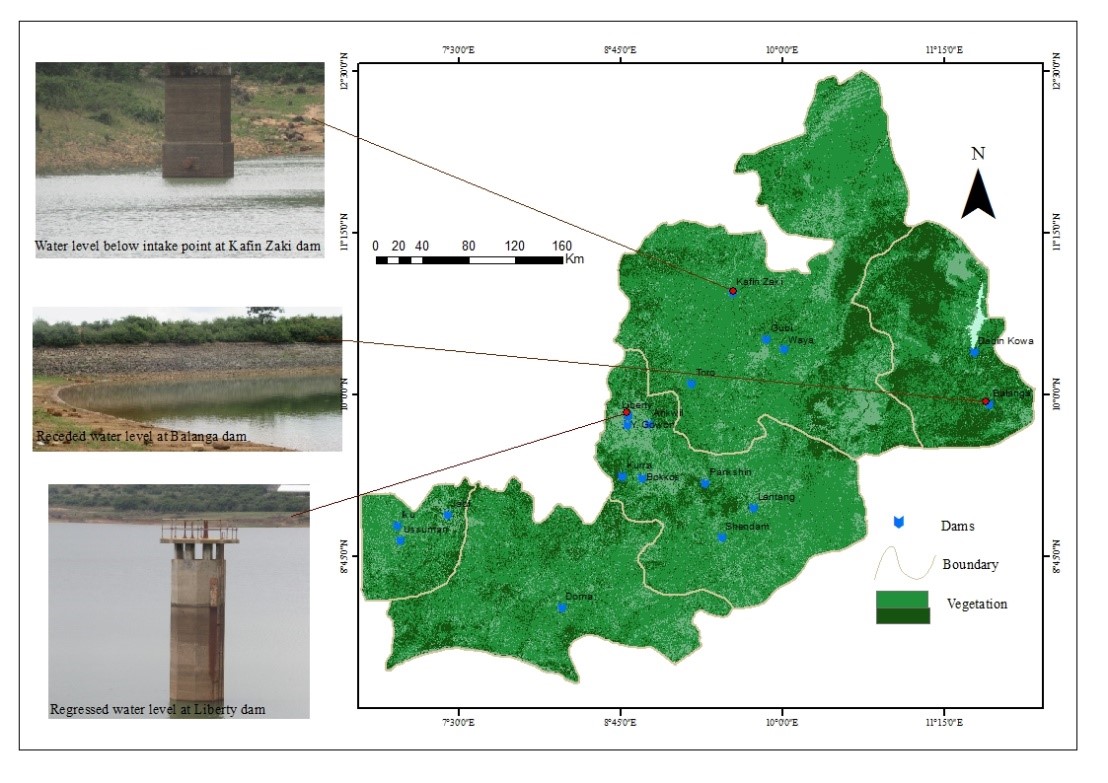 Figure 8: Validation of water dearth due to drought at some reservoirs visited
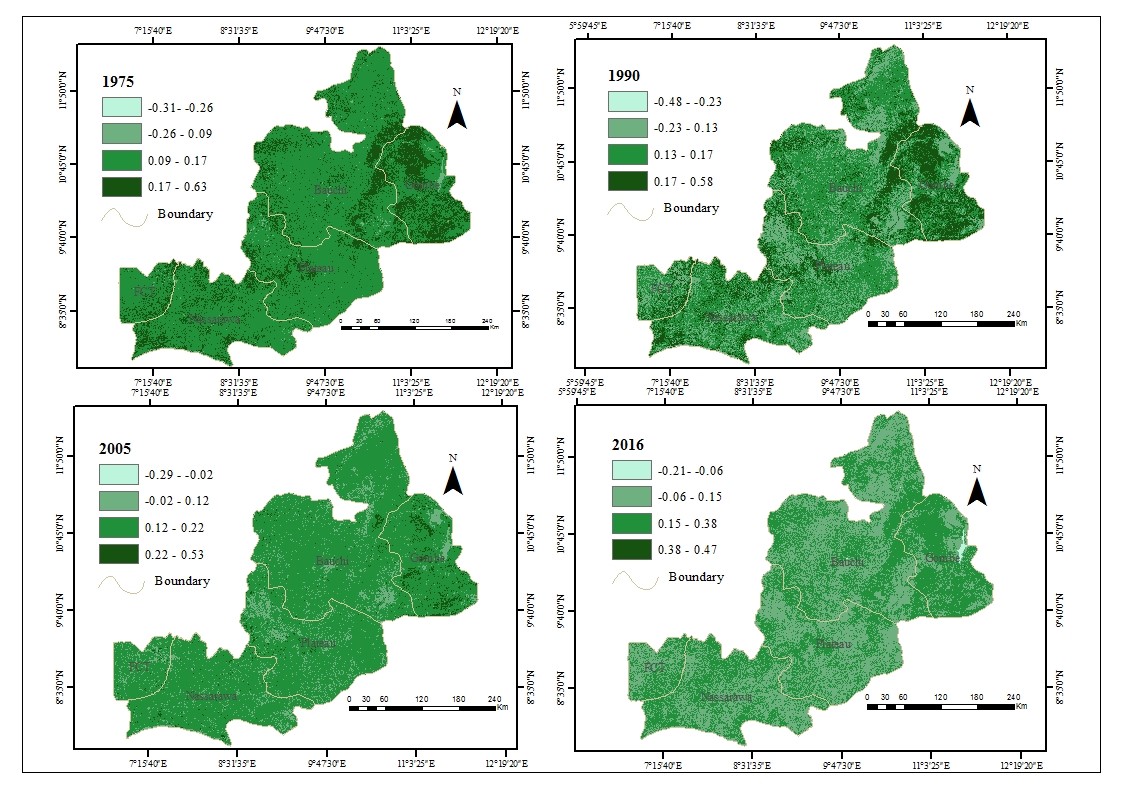 Figure 9: NDVI distribution over the ecological zones as of January and March
Pieces of evidence of drought on water reservoirs were lucid as receded water levels at peak of rainy season observed between July and September 2020 revealed about 10metres to 16metres depth of these dams have been lost with dry spillways visible across the visited sites (Figure 8) which were contrary to the usual water levels at the peak of rainy seasons decades ago. Observation revealed water levels were below the intake points of the tower thereby causing major water shortages particularly for irrigation farmers and water consumption in the urban centers.
1.4. Drought relationship to NDVI
Considering Guinean- Sudano the tremendous impact of drought on vegetation cover, it is pertinent that this biological indicator is given the required attention. Thus, in this study, the Normalized Difference Vegetation Index (NDVI) was carried out alongside a reconnaissance survey to verify the values obtained. It was observed that NDVI values were higher in 1975 with a range between – 0.31 and 0.63. Areas along river channels and other water bodies were noted to have higher NDVI values than other LULC types. 2016 recorded lower values with a range between -0.21 and 0.47 (Figure 8). NDVI minimum and maximum values were between -0.48 and 0.63 between 1975 and 2016, while in 2016 highest of 0.47 was observed the least maximum value with 1975 recording the highest value at 0.63. Negative index values were recorded over water bodies while values close to 0 over the land without vegetation.
In [59], the author suggested that values less than 0.1 will be considered as desert as they often represent bare rocks, sand, or bare surfaces [60]; between 0.1 and 0.2 as semi-desert while areas with 0.2 – 0.4 as shrub and grassland (which are similar characteristics of the savannas), and finally pixels with more than 0.5 will be assumed having forest land cover characterized by dense, green vegetation. Likewise, [61,62], classified regions that had a long-term mean monthly NDVI value between 0.1 and 0.5 as subject to drought and desertification. Therefore, the relationship between vegetation density and soil moisture with the role these parameters play in drought assessment have shown that they are strongly related and can explain the dynamics of drought and desertification [59]. Nonetheless, other parameters such as rainfall, soil quality, and socio-economic factors have strategic roles.
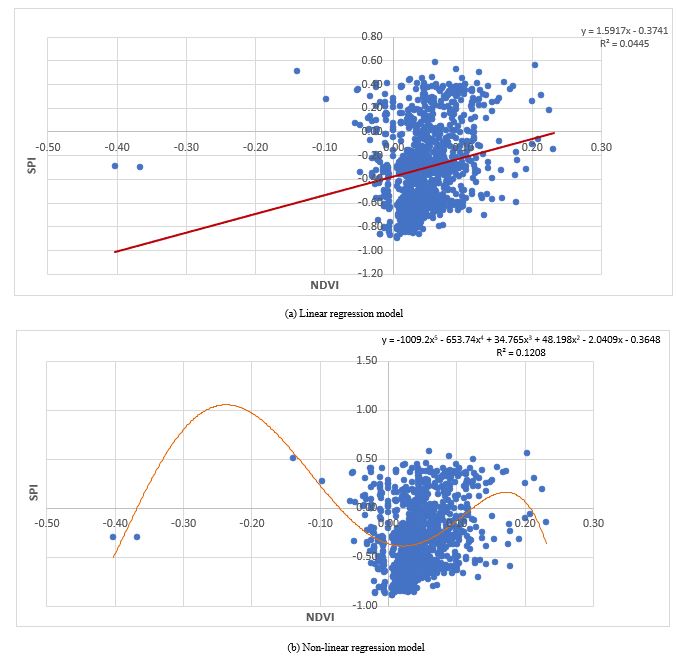 Figure 10: Relationship between NDVI and SPI using both linear and non-linear regression models
The relationship between NDVI which represents the amount of vegetation cover and SPI that denotes variability of precipitation was verified using regression analysis in this study. It was observed that precipitation and vegetation had a positive linear relationship with correlation coefficient ‘R’ for the 4 epochs under review: 1975 recorded 0.0625; 1990 at 0.045; 2005 at 0.126 and 2016 at 0.1334 respectively (Figure 10a). However, the non-linear regression appeared more suitable representation of the relationship between NDVI and SPI as a higher correlation coefficient ‘R’ 0.12 was recorded as against 0.045 observed in 1990 (Figure 10b) this affirms the suggestion of [63,64] who opined that the non-linear regression model provides relatively suitable fit for representation of relationships between variables. This further suggests that either way there is a strong relationship between precipitation and abundance of vegetation as the trend revealed that a decrease in precipitation reflected a decrease in vegetation cover over the ecological zones. Therefore, the NDVI related to SPI are significant indicators for vegetation status and its response to precipitation variability [65].
2. Discussion
Drought is a recurrent climatic feature that occurs in virtually every agro-climatic zone of Nigeria. Characteristics such as severity, duration, and geospatial extent, deaths, socio-economic effect, and long-term impacts are used to categorize drought impacts. It adversely affects different types of systems and places various demands on the available water within the Nigerian society such as agriculture, hydropower generation, rural and urban water supply schemes, and various industries [15].
However, the prevalence of drought disasters related to the shortfall of rainfall remains very important. In this study, the temporal and spatial spread of drought frequency, magnitude, intensity, and severity were examined. The studied results indicated 2002; 2007- 2008; and 2013-2014 were the most severe drought periods with extreme values below -3.0.
The SPI values of 3-month as well as 6- and 12-months timescales had an eminent impact on the rainfall pattern of the study periods that echoes the prompt occurrence of agricultural drought. In this regard, [25,58] confirmed that the 1- to 6-months timescales of SPI values lucidly reflects the fast development of agricultural drought, the exacerbating of the actual state of water conditions, and the negative effects of rainfall deficit in agriculture (soil moisture, groundwater table depth, crop yield). The significance of recurrent incidence of droughts for 3-, 6-, and 12-months and ensuing implications on the socio-economy of rain-fed agricultural practices and productions for smallholder farmers cannot be shoved aside.
The most significant drought risk incidence of months in the dry and wet seasons under moderate and (extreme) drought intensity classes highly impacted the agricultural practices as reaffirmed by [66] that “from the 1970s onwards, the decline of rainfall amount and the increasing frequency of drought directly influenced water shortages; limited crop growth and development; and reduced yield”.
It’s been cogently revealed that the most immediate impact of drought is a decrease in crop production, due to inadequate or poorly distributed rainfall. During droughts drastically reduced rainfall and high temperatures across the country lead to high exposure rates to drought impacts [25]. In Nigeria, agriculture occupies about 40 percent of the country’s GDP, and employs about 60 percent of the active labor force, with women representing about 65 percent [34]. More than 70 percent of the Nation’s livestock are raised in the drought-prone drylands of Nigeria [15,67]. The poor crop yields or total crop failure due to drought result in mass poverty and starvation as agriculture is the mainstay of Nigeria’s rural economy with its main source of water for agriculture being rainfall and so drought has a tremendous effect on agriculture and natural resources [15]. Malnutrition due to famines which usually follow droughts occurs due to reduced food production from the spread of infectious disease and food and water-borne illness, and increased air pollution [68]. Thus, if not monitored, the drought would lead to devastations with dire repercussions.
In addition, water availability is the paramount limitation to economic growth in northern Nigeria as reduced annual average rainfall and its run-off could exacerbate the increasing drought and desertification in Nigeria. The occurrence of droughts leads to the drop in the water levels of rivers and streams and the lowering of the water table which was evident in some water reservoirs visited in the course of study July/ September 2020 (Figure 8). This means that the region truly does not have abundant water assets to sustain the current level of per capita food production while meeting rational water needs for domestic, industrial, and ecological purposes [69]. Moreover, pertinent to note is the growing rate of rural-urban migration across the region as revealed in the report [34] which depicted a shift from 20% to 52% in rural-urban population in the period under review. The resilience of the rural productive systems is based on short-term circulation from the rural areas to the urban environments [69] commonly termed (Hausa cin rani).
Subsequently, Nigerian forests are already under great pressure with a deteriorating state of deforestation arising from increasing populations and growing economic needs. These have led to greater demand for forest resources exacerbating drought and other forms of land degradation including desertification [70] particularly with increasing changing climate and anthropogenic activities on forest growth and development and through greater demands on forests by populations adjusting to drought. Likewise, large populations within the drought-affected region regularly migrate southwards towards the coastal zone especially for grazing and this has led to resource conflicts between farmers and herders. The effects of drought on agriculture, water resources, and other sectors have stripped people of their means of livelihood, making the populace susceptible to inter-communal conflicts; increase in recruitments into criminal gangs and armed militia; armed robbery, insurgency, increase in possession of small arms[15] and other forms of social vices.
3. Conclusion
In conclusion, this study was able to affirm that drought is in dire need of deliberate attention and the choices we make today will determine the chance our communities and nation at large have in winning the fight against this menace. Results indicated that SPI dynamics over the region at varying timescales suggest the unpredictability of drought with longest drought duration were the severe and extreme drought (SPI ≤ − 1.5) was peaked at -3.12 severity that lasted 15months between 2007 and 2008. The worst drought magnitudes were more eminent in the longer timescale (SPI-12months) with its peak of -70.8 that lasted 60months (5 years) between 1984 and 1986. Similarly, drought intensity was observed between the mildly dry with SPI -0.47(1986 – 1991) and severely dry with SPI − 1.79 (1983 – 1984) this further revealed that spatially drought risk is increasing southward. SPI values demonstrated high variability in both wet and dry spells; however, the longer timescale at 12 months witnessed lesser variability. However, due to security challenges in the northern parts of Nigeria, the study demonstrated the resourcefulness of incorporating remote sensing and GIS as a means of analysing drought risk over the region other than the use of basic statistical measures. Over the years, there have been significant variations in vegetation cover as NDVI applied in analyzing vegetation quality revealed that areas along river channels had higher NDVI values which corresponded with thicker vegetation (riparian) observed during field surveys. NDVI values obtained demonstrated a consistent decrease with a better state in 1975 which ranged between – 0.31 and 0.63. 2016 recorded lower values with a range between -0.21 and 0.47. NDVI minimum and maximum values were between -0.48 and 0.63 between 1975 and 2016, while in 2016 highest of 0.47 was observed the least maximum value with 1975 recording the highest value at 0.63. NDVI dynamics were related to rainfall, dryness, and moisture content of the area to have a better understanding of drought within the climate change context. With the recent focus on Land Degradation Neutrality (LDN), a need for integrating assessment of key ecological problems such as desertification and other forms of land degradation will improve preventive and mitigating actions thereby better chances for combatting drought vulnerability and risk within northern Nigeria.
Acknowledgment
Our profound appreciation to African Union Commission (AUC) for funding this study by a grant provided to the first Author.
Conflict of Interest
The authors have read and understood the policy on declaration of interests and declare that there is no conflict of interest related to this article or legal bond or copyrights.
- A. Dai, “Drought under global warming: a review,” WIREs Climate Change, 2(1), 45–65, 2011, doi:10.1002/wcc.81.
- D.A. Wilhite, M.H. Glantz, “Understanding: the Drought Phenomenon: The Role of Definitions,” Water International, 10(3), 111–120, 1985, doi:10.1080/02508068508686328.
- I. Masih, S. Maskey, F.E.F. Mussá, P. Trambauer, “A review of droughts on the African continent: a geospatial and long-term perspective,” Hydrology and Earth System Sciences, 18(9), 3635–3649, 2014, doi:10.5194/hess-18-3635-2014.
- World Meteorological Organization (WMO) and Global Water Partnership (GWP), Handbook of Drought Indicators and Indices, Geneva, 2016.
- W. Zhan, K. Guan, J. Sheffield, E.F. Wood, “Depiction of drought over sub‐Saharan Africa using reanalyses precipitation data sets,” Journal of Geophysical Research: Atmospheres, 121(18), 2016, doi:10.1002/2016JD024858.
- J. Sheffield, E.F. Wood, “Projected changes in drought occurrence under future global warming from multi-model, multi-scenario, IPCC AR4 simulations,” Climate Dynamics, 31(1), 79–105, 2008, doi:10.1007/s00382-007-0340-z.
- Trenberth Kevin, Meehl Jerry, Masters Jeff, Somerville Richard, Current Extreme Weather and Climate Change, 2011.
- Centre for Research on the Epidemiology of Disasters (CRED), Annual Disaster Statistical Review: The numbers and trends, 2016.
- Intergovermental Panel on Climate Change, Summary for Policymakers. In Climate Change 2013: The Physical Science Basis. Contribution of Working Group I to the Fifth Assessment Report of the Intergovernmental Panel on Climate Change, 2013.
- M.M.Q. Mirza, “Climate change and extreme weather events: can developing countries adapt?,” Climate Policy, 3(3), 233–248, 2003, doi:10.3763/cpol.2003.0330.
- K.V. Suryabhagavan, “GIS-based climate variability and drought characterization in Ethiopia over three decades,” Weather and Climate Extremes, 15, 11–23, 2017, doi:10.1016/j.wace.2016.11.005.
- M.A. Miyan, “Droughts in Asian Least Developed Countries: Vulnerability and sustainability,” Weather and Climate Extremes, 7, 8–23, 2015, doi:10.1016/j.wace.2014.06.003.
- B. Shiferaw, K. Tesfaye, M. Kassie, T. Abate, B.M. Prasanna, A. Menkir, “Managing vulnerability to drought and enhancing livelihood resilience in sub-Saharan Africa: Technological, institutional and policy options,” Weather and Climate Extremes, 3, 67–79, 2014, doi:10.1016/j.wace.2014.04.004.
- C. Funk, P. Peterson, M. Landsfeld, D. Pedreros, J. Verdin, S. Shukla, G. Husak, J. Rowland, L. Harrison, A. Hoell, J. Michaelsen, “The climate hazards infrared precipitation with stations—a new environmental record for monitoring extremes,” Scientific Data, 2(1), 150066, 2015, doi:10.1038/sdata.2015.66.
- N. Federal Ministry of Environment, National Drought Plan under Federal Ministry of Environment , Nigeria., 2018.
- I.F.P. Research Institute (IFPRI), 2016 Global hunger index: Getting to zero hunger, 2016, doi:10.2499/9780896292260.
- A. Dai, T. Zhao, J. Chen, “Climate Change and Drought: a Precipitation and Evaporation Perspective,” Current Climate Change Reports, 4(3), 301–312, 2018, doi:10.1007/s40641-018-0101-6.
- J.N. Eze, “Drought occurrences and its implications on the households in Yobe state, Nigeria,” Geoenvironmental Disasters, 5(1), 18, 2018, doi:10.1186/s40677-018-0111-7.
- E.O. Oladipo, “A comprehensive approach to drought and desertification in Northern Nigeria,” Natural Hazards, 8(3), 235–261, 1993, doi:10.1007/BF00690910.
- O.Y. Ekundayo, E.C. Okogbue, F.. Akinluyi, A.. Kalumba, I.. Orimoloye, “Spatiotemporal drought assessment using vegetation health index and standardized precipitation index over Sudano-Sahelian region of Nigeria,” African Geographical Review, 1–13, 2020, doi:10.1080/19376812.2020.1841658.
- O. Ideki, M.O. Nwagbara, “Geo-Spatial Assessment of Vegetation Response to Drought in North Central Nigeria,” Journal of Geoscience and Environment Protection, 07(03), 46–63, 2019, doi:10.4236/gep.2019.73003.
- Federal Ministry of Environment (FME) Nigeria, National Forest Reference Emission Level (FREL) for the Federal Republic of Nigeria, 2019.
- J. McQuigg, “A Simple Index of Drought Conditions,” Weatherwise, 7(3), 64–67, 1954, doi:10.1080/00431672.1954.9930323.
- T.. B. McKee, N.. . Doesken, J. Kleist, “The Relationship of Drought Frequency and Duration to Time Scales.,” in Proceedings of the 8th Conference on Applied Climatology, Boston, 1993.
- A.A. Mekonen, A.B. Berlie, M.B. Ferede, “Spatial and temporal drought incidence analysis in the northeastern highlands of Ethiopia,” Geoenvironmental Disasters, 7(1), 2020, doi:10.1186/s40677-020-0146-4.
- A.. Huete, “A soil-adjusted vegetation index (SAVI),” Remote Sensing of Environment, 25(3), 295–309, 1988, doi:10.1016/0034-4257(88)90106-X.
- Q. Mu, M. Zhao, J.S. Kimball, N.G. McDowell, S.W. Running, “A Remotely Sensed Global Terrestrial Drought Severity Index,” Bulletin of the American Meteorological Society, 94(1), 83–98, 2013, doi:10.1175/BAMS-D-11-00213.1.
- M.A. Haroon, J. Zhang, F. Yao, “Drought monitoring and performance evaluation of MODIS-based drought severity index (DSI) over Pakistan,” Natural Hazards, 84(2), 1349–1366, 2016, doi:10.1007/s11069-016-2490-y.
- O. Adedeji, A. Olusola, G. James, H.A. Shaba, I.R. Orimoloye, S.K. Singh, S. Adelabu, “Early warning systems development for agricultural drought assessment in Nigeria,” Environmental Monitoring and Assessment, 192(12), 798, 2020, doi:10.1007/s10661-020-08730-3.
- I.R. Orimoloye, O.O. Ololade, “Spatial evaluation of land-use dynamics in gold mining area using remote sensing and GIS technology,” International Journal of Environmental Science and Technology, 17(11), 4465–4480, 2020, doi:10.1007/s13762-020-02789-8.
- R.W.J. Keay, An outline of Nigerian vegetation, 3rd ed., Federal Government Printer, Lagos, 1959.
- N. Federal Ministry of Environment (FME), State of the Nigerian Environment Report, 2008.
- N. National Bureau of Statistics, National Bureau of Statistics, Nigeria, 2017.
- N. National Bureau of Statistics, National Bureau of Statistics, Nigeria, 2019.
- World Meteorological Organization, Hayes M, Wood D, Svoboda M, Standardized Precipitation Index User Guide, Geneva, 2012.
- M. Hayes, M. Svoboda, N. Wall, M. Widhalm, “The Lincoln Declaration on Drought Indices: Universal Meteorological Drought Index Recommended,” Bulletin of the American Meteorological Society, 92(4), 485–488, 2011, doi:10.1175/2010BAMS3103.1.
- World Meteorological Organization (WMO), Standardized Precipitation Index User Guide , Geneva, 2012.
- M.R.I. Baig, Shahfahad, M.W. Naikoo, A.H. Ansari, S. Ahmad, A. Rahman, “Spatio-temporal analysis of precipitation pattern and trend using standardized precipitation index and Mann–Kendall test in coastal Andhra Pradesh,” Modeling Earth Systems and Environment, 2021, doi:10.1007/s40808-021-01262-w.
- W. Kalisa, J. Zhang, T. Igbawua, F. Ujoh, O.J. Ebohon, J.N. Namugize, F. Yao, “Spatio-temporal analysis of drought and return periods over the East African region using Standardized Precipitation Index from 1920 to 2016,” Agricultural Water Management, 237, 2020, doi:10.1016/j.agwat.2020.106195.
- H. Xie, C. Ringler, T. Zhu, A. Waqas, “Droughts in Pakistan: A spatiotemporal variability analysis using the Standardized Precipitation Index,” Water International, 38(5), 620–631, 2013, doi:10.1080/02508060.2013.827889.
- P.S.D.N. Thenkabail, V.U. Smakhtin, “The Use of Remote Sensing Data for Drought Assessment and Monitoring in Southwest Asia,” 5–13, 2004.
- S.L. Lewis, P.M. Brando, O.L. Phillips, G.M.F. van der Heijden, D. Nepstad, “The 2010 Amazon Drought,” Science, 331(6017), 554–554, 2011, doi:10.1126/science.1200807.
- O. V. Wilhelmi, D.A. Wilhite, “”Assessing Vulnerability to Agricultural Drought: A Nebraska Case Study.,” Natural Hazards, 25(1), 37–58, 2002, doi:10.1023/A:1013388814894.
- H.Q. Liu, A. Huete, “A feedback based modification of the NDVI to minimize canopy background and atmospheric noise,” Undefined, 33(2), 457–465, 1995, doi:10.1109/36.377946.
- J.E. Joseph, O.O. Akinrotimi, K.P.C. Rao, A.P. Ramaraj, P.S. Traore, P. Sujatha, A.M. Whitbread, The Usefulness of Gridded Climate Data Products in Characterizing Climate Variability and Assessing Crop Production, 2020.
- National Drought Mitigation Center, SPI Program, National Drought Mitigation Center, 2018.
- H. Abghari, H. Tabari, P. Hosseinzadeh Talaee, “River flow trends in the west of Iran during the past 40years: Impact of precipitation variability,” Global and Planetary Change, 101, 52–60, 2013, doi:10.1016/j.gloplacha.2012.12.003.
- J. Hannaford, B. Lloyd-Hughes, C. Keef, S. Parry, C. Prudhomme, “Examining the large-scale spatial coherence of European drought using regional indicators of precipitation and streamflow deficit,” Hydrological Processes, 25(7), 1146–1162, 2011, doi:10.1002/hyp.7725.
- Kang-Tsung C, Introduction to Geographic Information System, 6th ed., McGraw-Hill International, New-York, 2012.
- M.A. Degefu, W. Bewket, “Trends and spatial patterns of drought incidence in the omo‐ghibe river basin, ethiopia,” Geografiska Annaler: Series A, Physical Geography, 97(2), 395–414, 2015, doi:10.1111/geoa.12080.
- L. Labedzki, “Estimation of local drought frequency in central Poland using the standardized precipitation index SPI,” Irrigation and Drainage, 56(1), 67–77, 2007, doi:http://dx.doi.org/10.1002/ird.285.
- T. Sternberg, D. Thomas, N. Middleton, “Drought dynamics on the Mongolian steppe, 1970-2006,” International Journal of Climatology, 31(12), 1823–1830, 2011, doi:10.1002/joc.2195.
- J. Spinoni, G. Naumann, H. Carrao, P. Barbosa, J. Vogt, “World drought frequency, duration, and severity for 1951-2010,” International Journal of Climatology, 34(8), 2792–2804, 2014, doi:10.1002/joc.3875.
- K. Gopal Ghosh, Geo-Statistical Assessment of the Intensity, Duration, Frequency and Trend of Drought over Gangetic West Bengal, Eastern India, IntechOpen, 2019, doi:10.5772/intechopen.80037.
- M.G. Kendall, Rank correlation methods, 4th edn. Griffin, London, 4th ed., Griffin, London, 1975.
- B. Mann Henry, “Nonparametric tests against trend,” Econometrica: Journal of the Econometric Society, 245–259, 1945.
- P.K. Sen, “Estimates of the Regression Coefficient Based on Kendall’s Tau,” Journal of the American Statistical Association, 63(324), 1379–1389, 1968, doi:10.1080/01621459.1968.10480934.
- E.P. Agbo, C.M. Ekpo, “Trend Analysis of the Variations of Ambient Temperature Using Mann-Kendall Test and Sen’s Estimate in Calabar, Southern Nigeria,” in Journal of Physics: Conference Series, IOP Publishing Ltd, 2021, doi:10.1088/1742-6596/1734/1/012016.
- A.C. Anyamba, Tucker C J, Eastman J R, “NDVI anomaly patterns over Africa during the 1997/98 ENSO warm event,” International Journal of Remote Sensing, 22(10), 1847–1859, 2001, doi:10.1080/01431160010029156.
- Kimball Ryder, Differences to Measure Drought in the Russian River Watershed, 2021.
- U. Helldén, C. Tottrup, “Regional desertification: A global synthesis,” Global and Planetary Change, 64(3–4), 169–176, 2008, doi:10.1016/j.gloplacha.2008.10.006.
- E. Rimkus, E. Stonevicius, J. Kilpys, V. Maciulyte, D. Valiukas, “Drought identification in the eastern Baltic region using NDVI,” Earth System Dynamics, 8(3), 627–637, 2017, doi:10.5194/esd-8-627-2017.
- X. Qian, J. Xue, Y. Yang, S.W. Lee, “Thermal Properties and Combustion-Related Problems Prediction of Agricultural Crop Residues,” Energies, 14(15), 4619, 2021, doi:10.3390/en14154619.
- M. Assefa, Abtew Wossenu, Senay Gabriel, Extreme Hydrology and Climate Variability: Monitoring, Modelling, Adaptation and Mitigation, 1st ed., Elsevier, 2019.
- H. Barbosa, C. Tote, L. Kumar, Y. Bamutaze, Harnessing Earth Observation and Satellite Information for Monitoring Desertification, Drought and Agricultural Activities in Developing Countries, 1st ed., InTech, 2013, doi:10.5772/55499.
- United Nations Environment Program/UNEP, Food security in the horn of Africa: the Implications of a drier, hotter and more crowded future, 2011.
- I.U. Abubakar, M.A. Yamusa, “Recurrence of drought in Nigeria: causes, effects, and mitigation.,” Int. J. Agric. Food Sci. Technology, 4(3), 169–180, 2013.
- A.G. Hassan, M.A. Fullen, D. Oloke, “Problems of drought and its management in Yobe State, Nigeria,” Weather and Climate Extremes, 23, 2019, doi:10.1016/j.wace.2019.100192.
- A.B. Alhassan, R.C. Carter, I. Audu, “Agriculture in the Oasis of the Manga Grasslands of Semi-Arid North-East Nigeria,” Outlook on Agriculture, 32(3), 191–195, 2003, doi:10.5367/000000003101294460.
- O. Joseph, A.E. Gbenga, D.G. Langyit, “Desertification risk analysis and assessment in Northern Nigeria,” Remote Sensing Applications: Society and Environment, 11, 70–82, 2018, doi:10.1016/j.rsase.2018.04.012.