Solar Energy Assessment, Estimation, and Modelling using Climate Data and Local Environmental Conditions

Adv. Sci. Technol. Eng. Syst. J. 7(2), 103–111 (2022);
 DOI: 10.25046/aj070209
On Renewable Energy (RE), this field covers the most significant share of the world energy demand and challenges on the expensive measurement and maintenance equipment to be used. In all studies and designs, global solar radiation (GSR) measurements require assessment, estimation, and models to be applied together with the environment and meteorological data on installing stations at the specific location. These meteorology stations provide measured data throughout the year/ annually or at specified periods, depending on the site of interest. This study includes assessment and estimations of the solar radiation at the Vhembe District using the geographical data measured daily, monthly, and throughout a year in the area. It provides variables such as the geographical maps of the solar availability at a minimum and maximum temperatures obtained during the annual analyses. Determining the solar radiation at a specific location for energy generation involves several procedures, estimations, and calculations using the climatological weather data measurements through MATLAB simulations. In addition, the Geographical Remote Sensing (RS) and Mappings, and Spreadsheet Graph Analytics, were applied to the measured data from the nine installed Weather Stations (WS) in the Vhembe District area was used. The analysis determines the minimum and maximum solar radiation equations associated with the local climate patterns in accommodating the theoretical bases and period changes. The paper contributes to the main project objectives on renewable energy assessment for potentials and generation at a micro/small scale in the district. These parameters are fundamental in estimating and determining the potential solar energy radiation using its extraterrestrial solar radiation per day/ weekly/ monthly. Annual periods towards methods to develop micro/small energy projects for rural and urban communities for domestic and commercial use. As a result, the meteorology analysis is being presented in this study.
1. Introduction
This paper is an extension of work initially presented at the 2019 IEEE PES/IAS Power Africa Conference held in Abuja, Nigeria [1]. This article provides an extension and detailed result to determine the daily, monthly, annual, and solar potential and radiation within the Vhembe District. This demonstrates the estimating of the energy potential as part of the sub-energy potentials obtained from the wind, biomass/biogas, and hydro energy for the optimal energy generation in the area.
Solar energy applications play a significant role in health, agriculture, civil engineering, and the environment for their execution to support the energy demands within the domain [1], [3]. Hence, evaluating the solar energy potential at any specified location requires accurate solar radiation information. The sunshine duration from the most common variable for predicting global solar radiation (GSR), so sunshine duration can be easily calculated, reliable, and widely used. In increase, solar radiation is the primary root of energy and varies per amount of energy received at different locations [2], [28], [30]. The current developments towards sustainable energy savings and generation using the solar photovoltaic (PV) units have accelerated the maturation process and investment in the area [3]-[5], [11], [29]. In the Limpopo Province (coordinates as 22°50 “22. 08” S and 30°18 “36” E), there is adequate sunlight, which can be more utilized for solar energy applications as shown in Figure 1 to Figure 3. The images were obtained from the Global Solar Atlas developed by the Energy Sector Management Assistance Program (ESMAP) and SOLARIS supported by the World Bank. It is thus essential to harvest and store this natural resource to find a solution to energy shortages and environmental degradation at the state. It is of the view that solar energy systems are considered the most cost-effective and economic power systems in providing off-grid electricity generation in rural areas in the province.
Estimating the renewable energy (RE) potentials using geographical and climatological data requires thorough calculations per specified location. Hence the quantity of solar energy per location is essential, as shown aside from the direct average irradiation, global horizontal irradiation, and potential photovoltaic power for the region from Figure 1 to Figure 3.
More geographical, climatic, and analysis data were added to present conditions and their placement in this paper. Figure 1 to Figure 3 illustrates the available solar map available in the provinces, demonstrating that in the region of Limpopo Province, especially in upper streams, there is enough radiation in considerations for the development of solar energy projects from a small scale to large scale. The accessibility of the radiation in those fields can be demonstrated to last around twelve hours every day as it is one of the hottest areas in the state.
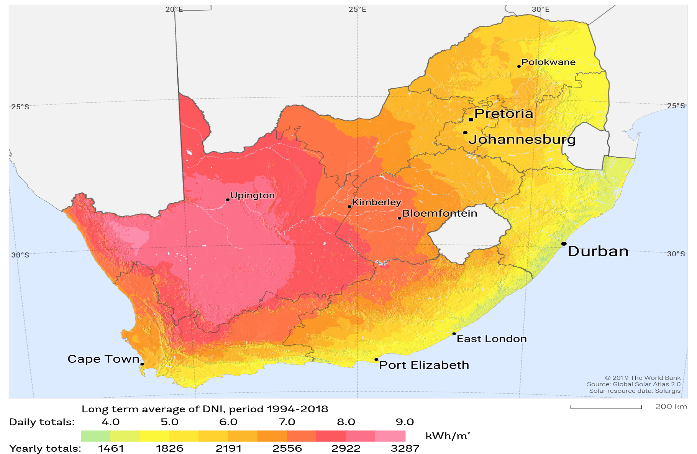 Figure 1. The direct average irradiation through the region (© Global Solar Atlas, 2020)
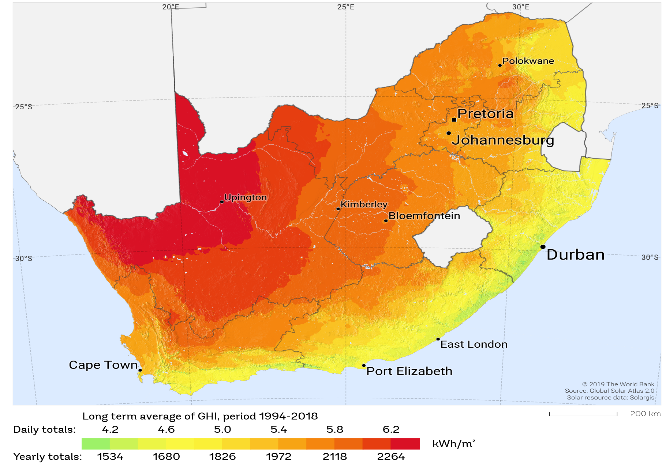 Figure 2. The global horizontal irradiation through the region (© Global Solar Atlas, 2020)
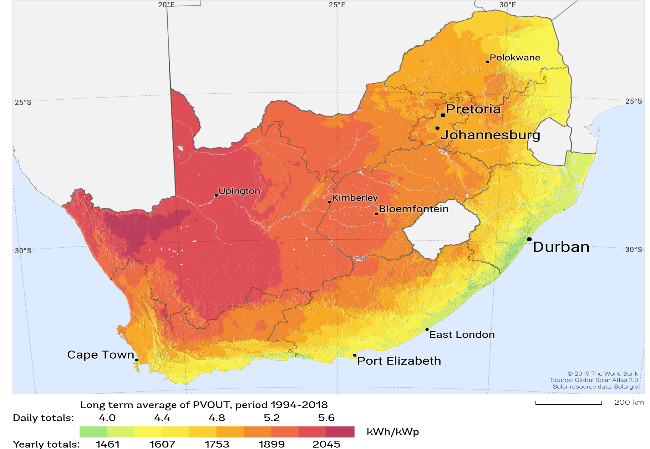 Figure 3. The potential photovoltaic energy for the region (© Global solar Atlas, 2020)
Every country has different solar radiation data but needs other techniques and measurements to determine a specific location. It can be touched on that there are various models produced to determine available solar radiation based on the sunshine hours. In South Africa, mainly, it plays a significant part in renewable energy systems and applications such as in health systems, agriculture, and farming, construction, and housing for domestic and industrial use [1], [28] as it is regarded as the most efficient and economical alternative resource and unused abundant sunshine available throughout the year.
It is essential to know where renewable energy sources come from, as almost all sources originate entirely from the sun [5]. Therefore, the sun’s arrays that get into the atmosphere are subjected to several elements, including array absorption, scattering, reflection, and transmission through the atmosphere, before arriving at the earth’s surface or location of interest. This array is separated into three categories: – diffused, reflected, and direct solar radiation representing the solar energy from the sunlight. Solar radiation data that arrives at the ground level is essential for many wide ranges of applications for meteorology, applied science, environmental sciences, agricultural hydrology and sciences, soil sciences, and physics. In summation, these include the modeling and estimation of crops and crop evapotranspiration, particular health sectors and medicine, and other research in the natural sciences [6], [7], [24].
Many projects are currently being developed, focusing on South Africa and looking into energy systems and their habits. The importance of using solar energy schemes in most parts of Limpopo Province has increased. Independently, improving and raising awareness on issues towards climate change and factors regarding the residential area is one of the significant economic challenges [8]–[10], [27]. This has been understood as the potential importance and opportunity in addressing energy security and carrying out of one the research niche area within the environmental Millennium Development Goals (MDG) on energy [11], [26].
The solar radiation data measured provide information on how much solar energy is reflected along the airfoil during the specific period (i.e., hourly, daily, monthly, and yearly) at the particular position. These measured data are of importance for efficient solar energy research for utilization and providing energy through natural resources such as photosynthesis [3]-[5]. In modern energy engineering, many cases are calling for equipment subjected to solar radiation [6], [7], [11]. This includes technology equipment such as street lights, traffic lights, remote control gates, public messages and notices, and other solar energy-supplied units installed in the residential district without proper grid-connected electricity supplies. The sunlight power source furnishes this equipment through radiation at defined energy absorption, which causes different significance. Using the radiation data within the Vhembe District allows determining the solar radiation parameters connected to the power needed for solar energy use.
Solar energy forms part of the ultraviolet intensity spectrum, determined by the physical wave solar constant (K). This electromagnetic constant flows through a unit area (A) by the solar array directly to the earth’s surface distance from the sun. As a result, to measure the necessary solar energy, it is essential to know the duration time (T) of the solar array path through the aura to the specified destination location [12]. In addition, the amount of incoming solar radiation on the Earths’ surface is the measurable amount during the minimum (Tmin). The maximum (Tmax) temperature (that is, in Degree Celsius) at relatively on a daily average of sunshine per hour (hrs); this requires a validated model to be used [12], [26]. Hence the data predictions at the specified location are of importance for the estimation and design in energy conversion for domestic employment industrial and commercial applications [13], [27].
This study introduces a mathematical and estimation radiation model and calculations developed for the Vhembe District to design solar energy strategies as per the radiation data found through the installed meteorological stations. The solar energy is specified and analysed in different geographical locations that enable the parameters in calculations for any positioning on an hourly basis or day by day. As a result, a specific amount of radiation will be employed to determine the possibilities with radiation measurement in planning solar energy systems.
Thus, the mathematical solar energy model used for data prediction provides a vast solar energy potential in the Vhembe District in hourly, daily, and monthly solar radiation on the location determined. Once more, the Vhembe District has a very complex topology, hill mountainous zone area due to its position, and extensive territory with plantations and vegetation, as shown in Figure 4 to Figure 8. As a result, climate data are critical throughout the year due to the location’s land cover and weather patterns.
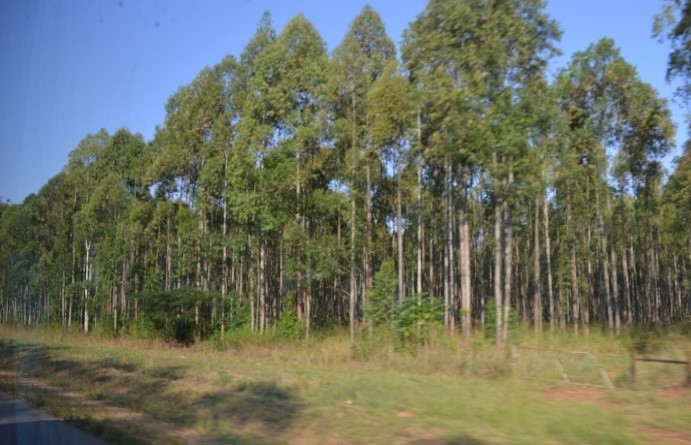 Figure 4. The Thathe Forestry and plantation
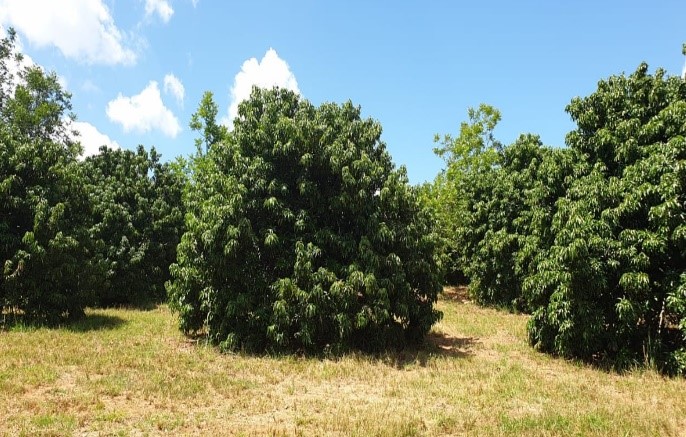 Figure 5. The Tshakuma Mango plantation
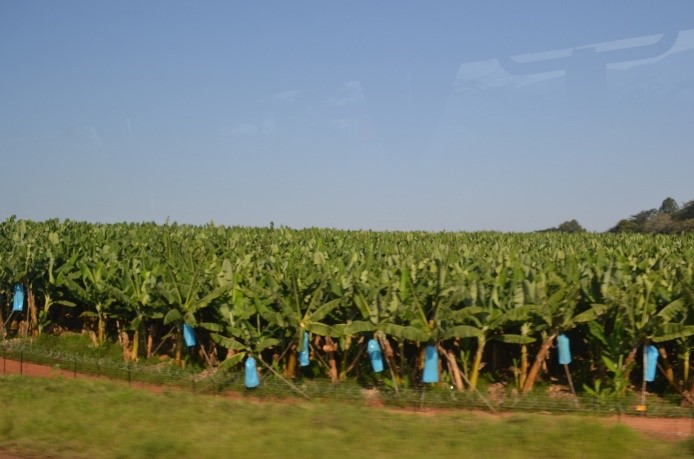 Figure 6. The Levubu banana plantation
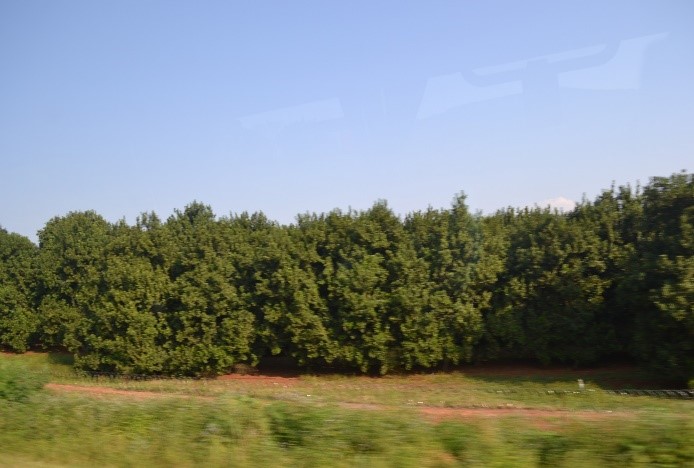 Figure 7. The Elim litchis plantation
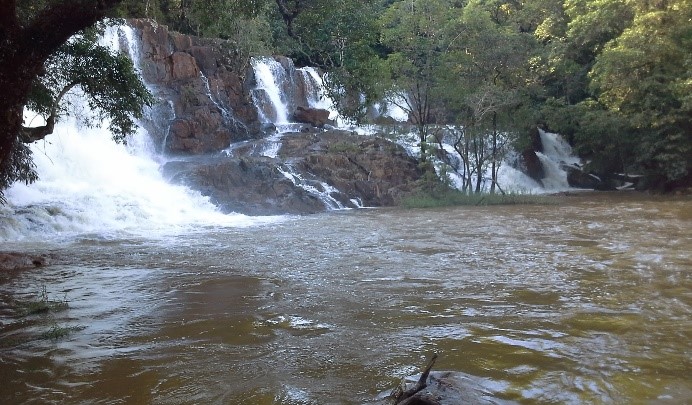 Figure 8. The Phiphidi Falls and river
These plantations (including corn, wheat, and sugar cane) furnish the wood wastes through organic materials that can be applied directly or converted into biofuels or bugs to be burned as fuels to generate energy. Besides, with the availability of the upstream and downstream rivers, there are opportunities that micro/small hydropower systems can be developed to assist the small farmers within the area for the irrigation and plantations, as shown in Figure 8.
In all four districts, people live under a very disadvantageous eco-system and environment, such as limited access to grid-connected electricity and using most natural resources such as traditional biomass, encroachments, paraffin, etc., and gas their energy resources. Also, the district has 14 primary commodities, as shown in Table 1. The majority of the community depends on farming as their economic sustainability, improving their livelihoods, and creation of employment for the rural communities [3], [14], [24].
Table 1. Type of agricultural farmers in the district [2]
| Commodities | No. of Smallholder farmers |
| a) Backyard gardens | 644 |
| b) Banana | 409 |
| c) Citrus | 16 |
| d) Fish | 81 |
| e) Garlic | 39 |
| f) Guava | 128 |
| g) Litchi | 4 |
| h) Livestock’s | 15 652 |
| i) Macadamia | 512 |
| j) Mango | 758 |
| k) Poultry | 992 |
| l) Tomato | 2015 |
| m) Vegetable gardens | 2300 |
| TOTAL | 23 636 |
With such commodities, an estimation of waste to bio-energy plants could be manufactured to enable the communities to use their waste materials and turn them into a valuable product that can gain them. This will be utilized in determining their energy needs or a marketable product as the source of income in supplying waste to the bio-energy plant that could be got within their area. This will enable the communities to have a whiter, healthier environment and potential job creation and admission to improved energy that improves their living standards. The same uses with biomass, wind and hydro energy resources fail to be taxed.
The measurements received from the solar radiation and humidity climate weather data through the instruments utilized are much subject to stability error function as exposed to heat transport within the aura. This heat transfer is of the drift by 10% of the determined values. In summation, there is a relatively 1% humidity loss of the instruments per month. According to [24], many available studies refer to the global solar radiation models. This includes available models in estimating the daily, weekly, monthly, and annual radiation used for solar energy estimation purposes.
2. Materials and Methods
Throughout the study, the following materials, methods, and analyses were carried out during the estimations and modeling, namely: – Weather data measured throughout the installed metrology weather stations, the GIS maps obtained through Remote Sensing and Mapping downloads for the Vhembe District and using the Photovoltaic graphical modeling through the Matlab software.
Basic Solar Irradiance Measurement
Solar radiation depends on the sunshine that arrives on the earth during the daytime, with its specific latitude location and the atmospheric transmittance (K). Besides the net solar radiation reaching the earth’s surface, some are lost and be used for other heating methods, which are turned into additional energy that can be measured using specific instruments [16], [19].
The radiometer is an instrument for measuring irradiance in equal quantities of solar energy at a specified wavelength range measured. The most significant concern was thought in choosing a site placement regarding the determined climatological measurements within the country of interest during the day or in the year. Besides, it was understandable that new models and techniques exist and are being developed in improving the measurement techniques for estimating solar radiation energy with accurate, readable available meteorological parameters. Hence, considering solar radiation on horizontal and tilted surfaces forms part of the estimations [20]. Furthermore, in computing the global radiation, one should take the daily solar radiation absorption (Rs) on the ground, together with the extraterrestrial insolation (Q) and the mean daily solar through the sky transmittance (K) according to equation 1:
Rs = Q × K (1)
The constant, K, has a variation of KC or KO when there is a clear forecast and Ki on the intermediate days during the year [18], [21]. In summation, in estimating the direct solar radiation (I), one must recognize that it depends on the actual length (r) between the ground and sunlight during the incident measurement. As such, direct solar radiation (I) is known as the dower of the so-called extraterrestrial solar radiation (Io), which arrives at the earth’s surface directly from the atmosphere [20], [24].
Basic Solar Radiation Intensity
The parameters affecting the solar radiation intensity within the atmospheric region are important in solar energy as other arrays are reflected throughout the air. That is, the spectrum of the radiation emitted by the sun is about the power in the ultra-violet region as the solar radiation beam (i.e., constant (I0)) passes through the atmosphere when the sun is at its mean distance from the earth [21], [22], [25]. This value is
I0 = 1.37 ± 0.02kW/m2 (2)
This constant varies as the light travels through the clouds, absorbed or scattered, reflection and based on the climate latitude and longitude of the location area for the solar energy. This value diverges by 3% as the earth’s orbit is elliptical, and the distance from the sun varies all year round. The variations distance between the sun and the world is due to the earth’s orbit caused by the actual intensity of solar radiation outside the atmosphere to differentiate from I0 by a few per cents to strike into account these variations by a mean factor, F in Degree Celsius.
F = 1 – 0.0335 sin 360(nd – 94)/365 (3)
Where nd is a specific day of the year (i.e., nd = 1 for January and nd = 365 for December), the argument of the sine function is in degrees. All the values of solar radiation intensity given below, which are in the sun at its average distance from the earth, must be multiplied by F to obtain the actual values on a day. During January, as the weather is clear, the sun is closer to the world, the solar radiation is 3% larger than the average, and in July, when the earth is furthest from the sunshine, the solar radiation is 3% less than the norm.
Prediction Model and Determination of Solar Energy Radiation at Specific Area and Particular Time
The site selection directly impacts the potential renewable energy systems (RES) projects in many different ways, including technical, economic, and environmental aspects. However, one of the critical roles in the PV power plants is the inconsistency and variability of solar irradiation, which can be geographically dissimilar from one location to another [23], [28]. To measure the specific amount of solar radiation at a particular area and a specific time, it is essential to define the angle of inclination by cos(δ) of solar arrays to the perpendicular of the earth by considering the area of interest, cos(θ) and expressed by the total amount of watts per meters square (W/m2) and the joules per meter squares (J/m2) [12], [25]. Also, the RE subject field requires three parameters, namely, global horizontal irradiance (GHI), direct normal irradiance (DNI), and diffuse horizontal irradiance (DHI) [13], [24], [29]. Furthermore, many methods have been introduced to measure global solar irradiation in that respect. These methods have been modified in several ways to suit different models. The simplest example to calculate the global solar radiation is shown in equation 4 [3], [25], 30
![]() The H and HO are the daily solar radiation and the daily extraterrestrial radiation in MJm-2d-1; A and B are constant-coefficient; n and Ld are the sunshine hours per day and location day length in Hours (hrs). The constant-coefficient values are subject to the location of the study and its weather conditions throughout the year [25], [28]. Using the captured weather data, several states are shown using the equation to estimate solar and weather conditions.
The H and HO are the daily solar radiation and the daily extraterrestrial radiation in MJm-2d-1; A and B are constant-coefficient; n and Ld are the sunshine hours per day and location day length in Hours (hrs). The constant-coefficient values are subject to the location of the study and its weather conditions throughout the year [25], [28]. Using the captured weather data, several states are shown using the equation to estimate solar and weather conditions.
![]() In measuring the solar radiation, territorial solar irradiation (Ess) and global solar irradiation (EET) are considered. Hence, the total solar energy (Es) above the atmospheric level is equal to the absolute atmospheric solar power at sea level multiplied by the length of day (N) per change of temperature (T) throughout the year as determined by equation 5. The latitude (L) and angle of declination (δ) by the sunlight must also be consider parenting the surface of absorption [31].
In measuring the solar radiation, territorial solar irradiation (Ess) and global solar irradiation (EET) are considered. Hence, the total solar energy (Es) above the atmospheric level is equal to the absolute atmospheric solar power at sea level multiplied by the length of day (N) per change of temperature (T) throughout the year as determined by equation 5. The latitude (L) and angle of declination (δ) by the sunlight must also be consider parenting the surface of absorption [31].
Where the Io is the solar constant = 1,367W/m2 (is the extraterrestrial radiation as the earth orbits around the sun) and N is the number of the day for solar absorption, 0.34 being the constant coefficient of solar irradiance at the atmospheric level and L is the length of the day being calculated by equation. The It is the calculated angle of declination of the sun during the day through per year during the earth’s orbit.
The length of the day was calculated by: –
![]() This was determined by the length (L) of days per the solar decline angle (δ) as calculated by equation 7.
This was determined by the length (L) of days per the solar decline angle (δ) as calculated by equation 7.
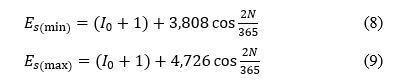 In normal circumstances for the Vhembe Region weather measurements, the minimum length was 11.2hrs, and the maximum size of the day was 13.9hrs [3], [25]. Therefore, the solar energy (Es) for the minimum and maximum was determined by equations 8 and 9.
(8)
(9)
As a result, equations 1 to 7 were acknowledged in the patterns, estimations, measurements, and computations of the solar radiation energy and demonstrated by the Matlab graphical responses in Figure 17 to Figure 19 for the radiance measurements.
3. Analysis and Discussions
3.1. Meteorology Data Acquisition Analysis
Measurements were remotely captured throughout one year, from January to December 2018. The data acquisition (DAQ) system was used to obtain data from the nine Weather Stations (WS) used during the data collection (i.e., Hanglip, Shefeera, Tsianda, Thohoyandou WO, Dzanani Biaba Agric, Mphefu, Joubertstroom Plantation, Vondo – Bos and Tshivhasie Tea Venda). Table 2 gives the locational longitude and latitude coordinates of the installed weather stations used during the data collection for the study.
Table 2. The location of the weather stations installed in the Vhembe District
| Weather Station Name | Longitude (°, E) | Latitude (°, N) |
| Hanglip | 101.07 | 41.95 |
| Shefeera | 94.68 | 40.15 |
| Tsianda | 98.48 | 39.77 |
| Thohoyandou WO | 103.08 | 38.63 |
| Dzanani Biaba Agric | 100.13 | 37.33 |
| Mphephu | 30.03 | 22.89 |
| Joubertstroom Plantation | 22.57 | 29.19 |
| Vondo – Bos | 30.33 | 23.93 |
| Tshivhasie Tea Venda | 22.96 | 30.35 |
It was challenging to measure solar radiation in many locations due to the cost of equipment to be used, maintenance, and calibrations to obtain accurate values. Hence, the South African Weather Stations (SAWS) meteorological weather data were used in all the nine weather stations (WS) been installed, in concert with the Agricultural Research Council for the Institute for Soil, Climate and Water (ARC-ISCW) in providing the data. As the results, within reference to the measurements obtained, the data were used to define the solar energy potential for the Vhembe District at specified locations to evaluate its amount for power generation. This data was remotely captured and used to calculate the potential solar energy per location for power generated by photovoltaic system modules. Table 3 shows essential parameters in measuring solar irradiation at different positions. These were applied to evaluate the accessibility of solar irradiation at the designated place.
Table 3: The measurements units used for solar radiation evaluations
| Parameters | Units |
| Global radiation | G (W/m2) |
| Diffuse radiation | Gd (W/m2) |
| Beam radiation | Gn (W/m2) |
| Sunshine hours | s (hrs) |
| Maximum and minimum temperature | Tmin and Tmax (°C) |
| Humidity | H (%) |
| Pressure | P (Pa) |
| Visibility | F (m) |
| Wind speed and directions | V(m/s); N,W,E,S |
| Air mass | r(kg/s) |
Besides, the efficiency and error calculations were considered difficult to measure the solar radiation at the geographical location due to other factors, including absorbed or reflected by the atmosphere. Following the data obtained, available renewable energy resources within the Vhembe District were of importance and the peoples’ quality of life as purpose in using the solar energy to meet their energy demands.
Figure 14 and Figure 15 show the monthly graphical meteorological analysis of the area for minimum and maximum temperature and the length of the day (sunshine hours) as per the yield throughout the year on the direct solar radiation measurement. These measurements were acquired through the day’s duration in the district to get a micro solar system for the community expectation and energy demands.
It was noticed that the highest values of the solar insolation are during the summer months (Jan to Apr and Sept to Dec), and the lowest values are during the winter months (May, Jun, Jul, and Aug) as applicable per the day during that time for the season.
Furthermore, the desirable amount of solar energy was measured during the allowable day time duration (from 06:00 – 19:00) for the whole year per location during the 24hr time interval. The measurements were used to determine the minimum and maximum coefficients variations through the solar radiation calculations using the Matlab software analysis.
3.2. Remote Sensing and GIS Mapping Analysis
The Vhembe District is situated at 22.7696° S Latitude, 29.9741° E 25 Longitude of the Limpopo Province. At an altitude of 250m above mean sea level, a study was conducted in estimating the monthly and annual solar radiation, using the climate and geographical parameters. These areas and the outcomes obtained will assist the researchers and public entities interested in working on solar energy developments to have reference and locations’ conditions that they can use for solar energy estimation. Figure 9 shows the potential solar available within the district and per municipality used for domestic use during the solar energy estimation. This map provides an overview of available heat energy to be used.
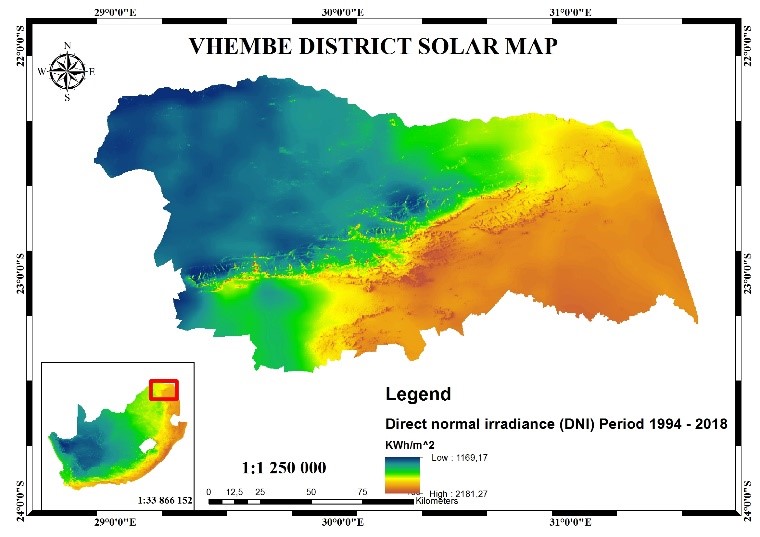 Figure 9: The Solar Map of the Vhembe Strict Area
The analysis shown includes the daily solar radiation assessment from all the locations and using other parameters to see the solar potential available, as shown by Figure 10 to Figure 13. Thither are many solar radiation databases available for most sections of the countries around the globe.
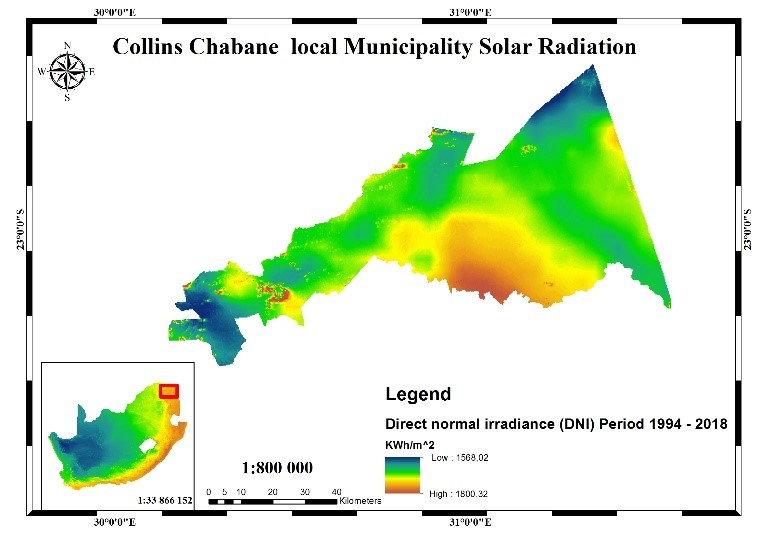 Figure 10: The Areal Solar for the Collins Chabane Municipality
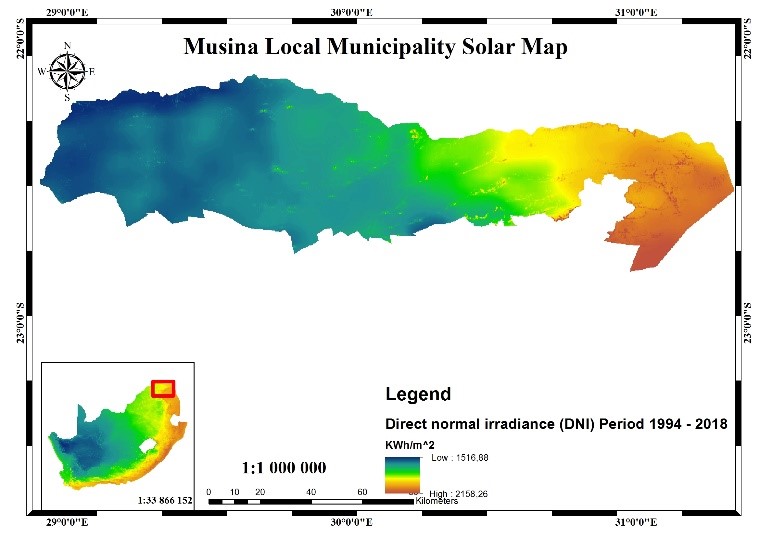 Figure 11: The Musina Municipality Solar Map
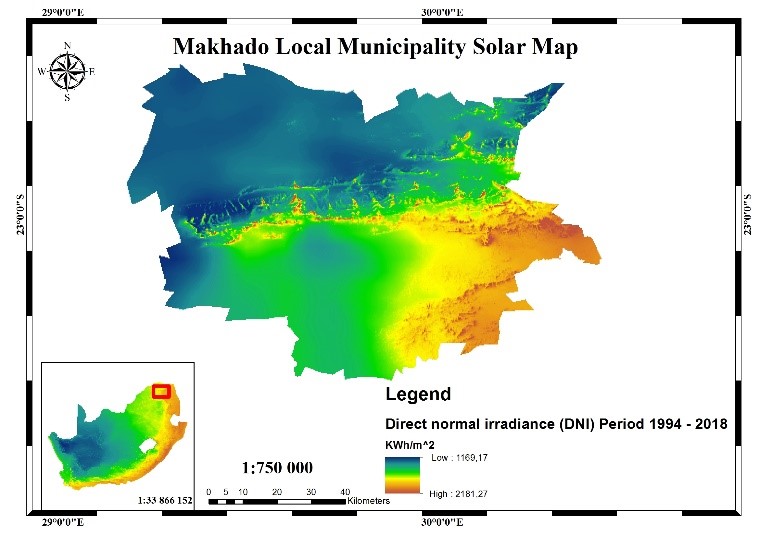 Figure 12: The Thulamela Municipality Solar Map
These were set for the annual weather changes to determine the solar maps of the Vhembe strict and its municipalities (Musina, Collins Chabane, Thulamela, and Makhado Municipality). As a result, the Remote Sensing (RS) for GIS was employed to settle the territorial dominion’s solar maps.
 Figure 13: The Makhado Municipality Solar Map
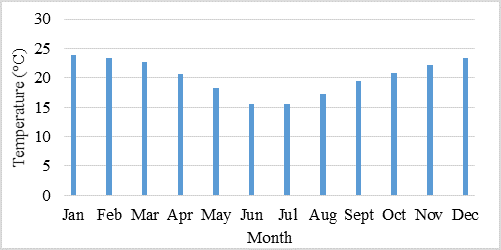 Figure 14: The monthly temperature measurement (Average – 20 °C)
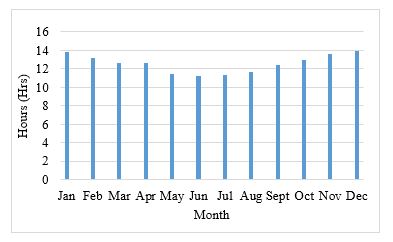 Figure 15: The monthly length of the day measured (Average – 12.5Hrs)
3.3. Computational Solar Analysis using Matlab
During the data analysis, the daily solar radiation, the intensity of direct radiation (W/m²) through an average sun hour of the solar insolation, as shown in Figures 17 to 19. It was noted that high radiation is received during the summertime. There are low irradiance and temperatures in wintertime, which is demonstrated by the lowest and highest measurements for power potential and public presentation.
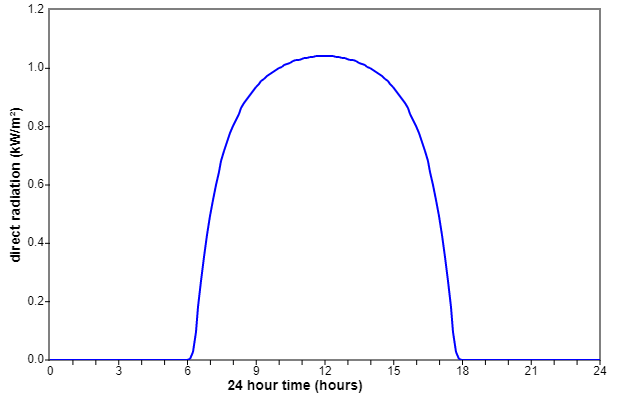 Figure 17: The daily solar radiation for the district
Figure 17 shows the daily solar irradiance curve during the number of hours during sun hours of the day. This is the direct radiation per hour that is generated.
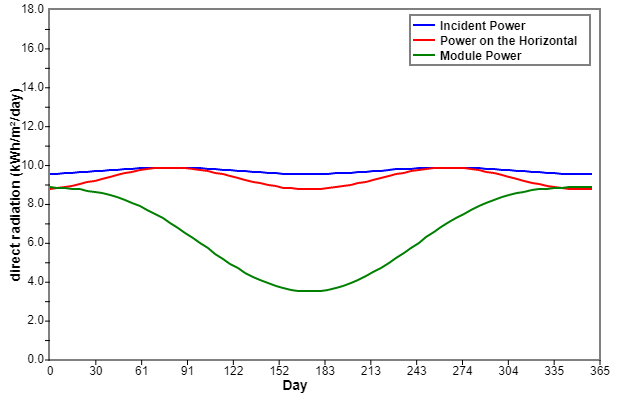 Figure 18. The daily incident power generation per direct intensity
Figure 17 to Figure 19 shows the maximum amount of power directly received without any clouds during the regular sun hours. This amount is set at different to determine how much the specific location’s radiation is per period defined. As a result, the power required is generated.
The area is known for its abundant radiation and available solar resources, which significantly influence the design, configuration, and cost of power systems produced. It was observed that the highest values of the solar insolation are during the summer months (Jan to Apr and Sept to Dec), and the lowest values are during the winter months (May, Jun, Jul, and Aug), as demonstrated by Figure 14 to Figure 19. These estimates and weather patterns have been obtained and analyzed through weather stations installed in the Vhembe District and the Matlab software analysis as part of the computations estimations.
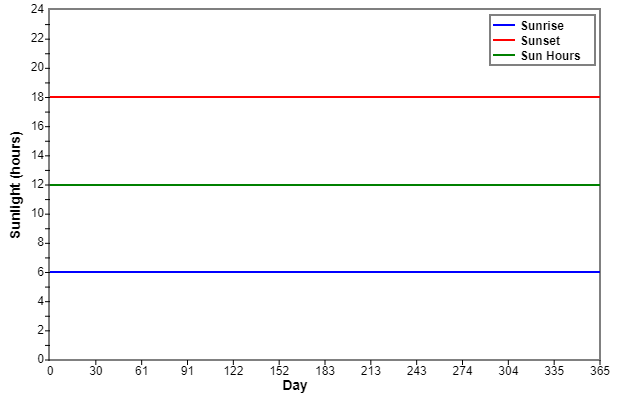 Figure 19. The average sun hours of the solar insolation
Figure 19 shows the mean daily solar availability based on the three curves corresponding to the incoming solar insolation. The daily insolation shown is the number of sun hours rising and sunset. The limited results are helpful for the conception and estimation of the power module needed to take out the solar energy schemes to be set up. This will provide the estimates of the available irradiation generation concept.
The approximation of solar radiation energy is vital in designing the solar energy system or devices. The estimation and size are not easily determined due to the cost and techniques required to practice. As a result, there is a demand for building theoretical methods for estimating solar radiation, such as the empirical relationships using commonly measured climatological data measured at the specific area [17], [18]. Due to its position and extensive territory, the Vhembe District has a complex topology, hill, and mountainous zone area; hence, the nine installed weather stations found different climate data.
4. Conclusions
The estimation model uses the most recent data measured throughout (January to December 2018) of the meteorological data obtained in the nine installed weather stations. This analysis demonstrates that the required solar radiation values for the potential use in the field are accepted by the temperatures commonly measured by the installed weather stations around the Vhembe District. The obtained results can be the best exemplar for solar estimation at different geographical and climatic locations.
In estimating PV radiation’s optimal and potential role, it is essential to consider the location suitability to maximize the solar energy received and the power generated at the selected position. In this paper, the meteorological estimations, graphics, and formulae were applied to influence the behaviour of the Vhembe District climatic conditions as one of the rural regions of involvement in deploying renewable energy technologies such as solar schemes. Consequently, the analysis demonstrates that the required solar radiation values for the potential use in the field are estimated by the temperatures commonly measured by the installed weather stations around the Vhembe District. Furthermore, intensive research studies within specific locations should be carried out to identify and find out the environmental matters linked with the placement and its natural resources to see potential energy sources available for community use.
It is noted that the active use of solar energy schemes has an environmental impact compared to other authors. These solar energy technologies should be increasingly introduced within the rural areas taking into account the suitability and energy potential of the region.
In summary, solar energy provides many advantages over other alternative energy sources. As presented in the paper, a simple principle of solar heat energy can be utilized in various applications. Nonetheless, it is mentioned that solar energy has its drawbacks or limitations like high initial price, depending on the weather, and challenges in energy storage. As a result, the South African Government is increasingly introducing initiatives with plans in providing subsidized programs to increase an effort in encouraging solar energy use in the rural regions. With the application of the solar assessment, the local community will use these findings to assist in determining the potential locations to deploy and install the solar systems for their local use, agriculture, and community use.
Disclosing a conflict of interest
The authors have no conflict of interest to declare.
Acknowledgment
The acknowledgment is towards the support of the Energy Institute (EI) Members and the Centre for Distributed Power & Electronic Systems (DEECE), Dr. K. Aboalez, Dr. M. Adonis, Dr. A. Raji, and Dr. Ali-Mustafa-Ali Almaktoof on their expertise and supervision in developing, compiling and writing this publication. I want to thank the Research Directorate (RD) Unit under the Office of Deputy-Vice Chancellor Research Innovation and Technology and Partnership (DVC-RITP) for financial support. They appreciate the South African Weather Stations (SAWS) and the Agricultural Research Council for the Institute for Soil, Climate and Water (ARC-ISCW) of data provided. I would likewise like to recognize the 2019 IEEE Power Africa Conference as this extended paper forms part of a conference paper presented at the Abuja, Nigeria conference.
- C. Matasane, M.T.E Kahn, “Solar Radiation Estimations Using the Territorial Climatological Measurements in Vhembe District, Limpopo Province for Solar Energy Potential Estimation and Use,” 2019 IEEE Power Africa Conf.: Abuja, Nigeria, 2019, doi:10.1109/PowerAfrica.2019.8928806.
- C. Matasane, C. Dwarika, R. Naidoo, “Modelling the Photovoltaic Pump Output Using Empirical Data from Local Conditions in the Vhembe District,” 2014 International Conference on Social Education and Community Conf, doi:10.5281/zenodo.1096759.
- M. S. Gadiwala1,2, A. Usman2, M. Akhtar2, K. Jamil2, “Empirical Models for the Estimation of Global Solar Radiation with Sunshine Hours on Horizontal Surface in Various Cities of Pakistan,” Pakistan Journal of Meteorology, 9(18), 2013.
- A. E. Lawin1,*, M. Niyongendako2, C. Manirakiza2, “Solar Irradiance and Temperature Variability and Projected Trends Analysis in Burundi,” Climate 2019, 7(6), 83, 2019, doi:10.3390/cli7060083.
- S. Zekai, “Solar Energy Fundamentals and Modeling Techniques,” Atmosphere, Environment, Climate Change and Renewable Energy, 22, 2008.
- T. A. McMahon1, M. C. Peel1, L. Lowe2, R. Srikanthan3, T. R. McVicar4, “Estimating actual, potential, reference crop and pan evaporation using standard meteorological data: a pragmatic synthesis,” Journal of Hydrol. Earth Syst. Sci., 17, 1331–1363, 2013, doi:10.5194/hess-17-1331-2013.
- M. Paulescu, E. Paulescu, P. Gravila, V. Badescu, “Weather Modeling and Forecasting of PV Systems Operation, Green Energy and Technology,” Springer-Verlag London, 17–42, 2013, doi:10.1016/j.rser.2016.11.222.
- P. Jayakumar, Solar Energy Resource Assessment Handbook: APCTT Asian and Pacific Centre for Transfer of Technology of the United Nations – Economic and Social Commission for Asia and the Pacific (ESCAP), 2009.
- L. Mary1, A. E. Majule2, “Impacts of climate change, variability and adaptation strategies on agriculture in semi-arid areas of Tanzania: The case of Manyoni District in Singida Region, Tanzania,” African Journal of Environmental Science and Technology, 3(8), 206–218, 2009, doi:10.5897/AJEST09.099.
- D. R. Brooks, Monitoring Solar Radiation and Its Transmission through the Atmosphere, Department of Mechanical Engineering and Mechanics, Drexel University, Philadelphia, PA, USA, 2, 2006.
- A Guide to Energy’s Role in Reducing Poverty, Energizing the Millennium Development Goals, UNDP, 2005.
- S. A. Kalogirou, “Solar thermal collectors and applications,” Progress in Energy and Combustion Science, 30, 231–295. 2004.
- O. I. Kordun, The influence of solar radiation on sheet steel structures temperature increment, Achieves of Civil Engineering, LXI (1), 2015.
- S. S. Ndwakhulu, An evaluation of the performance of the Department of Agriculture in Limpopo Province in improving the livelihood of smallholder farmers during the period 1994–2004, with special reference to the Vhembe District, MSc Thesis, University of Stellenbosch, 2007.
- K. Bakirci, “Models of solar radiation with hours of bright sunshine: a review,” Renewable Sustainable Energy Review, 13, 2580–2588, 2009, doi:10.1016/j.rser.2009.07.011.
- K. Sukarno1, Ag. S. Abd. Hamid1, J. Dayou1, M. Z. H. Makmud2, M. S. Sarjadi2, “Measurement of Global Solar Radiation in Kota Kinabalu Malaysia,” ARPN Journal of Engineering and Applied Sciences, 10(15), 2015.
- A. A. El-Sebaii, F. S. Al-Hazmi, A. A. Al-Ghamdi, and S. J. Yaghmour, “Global, direct and diffuse solar radiation on horizontal and tilted surfaces in Jeddah, Saudi Arabia,” Applied Energy, 87(2), 568–576, 2010.
- X. Li u, X. Mei, Y. Li, “Evaluation of temperature-based global solar radiation models in China,” Agricultural and Forest Meteorology, 149(9), 1433–1446, 2009, doi: 10.1016/j.agrformet.2009.03.012.
- S. Becker, “Calculation of direct solar and diffuse radiation in Israel,” International Journal of Climatology, 21, 1561–1576, 2001.
- C. K. Pandey and A. K. Katiyar, “Solar Radiation: Models and Measurements Techniques,” Journal of Energy, 2013, ID 305207, doi:10.1155/2013/305207.
- S. Becker; “Calculation of Direct Solar and Diffuse Radiation in Israel,” International Journal of Climatology, 21, 1561–1576. 2001, doi:10.1002/joc.650.
- Z. Samani, “A General Solar Radiation Estimation Model Using Ground Measured Meteorological Data in Sarawak, Malaysia,” Journal of Telecommunication, Electronic, and Computer Engineering, 10(1), 99–105, 2015.
- Z. Hassan, Optimal Design and Analysis of Grid-Connected Solar Photovoltaic Systems, Ph.D Thesis, Concordia University, 2018.
- J. Singh, A. Kruger, “Is the summer season losing the potential for solar energy applications in South Africa?” Journal of Energy South Africa, 28(2), 2017, doi:10.17159/2413-3051/2017/v28i2a1673.
- S. Bandy, W.A. Zainal, “A General Solar Radiation Estimation Model Using Ground Measured Meteorological Data in Sarawak, Malaysia,” Journal of Telecommunication, Electronic, and Computer Engineering, Universiti Teknikal Malaysia Melaka, 10(1), 99–105, 2018.
- T. R. Govindasamy, N. Chetty, “Quantifying the global solar radiation received in Pietermaritzburg, KwaZulu-Natal to motivate the consumption of solar technologies,” Open Physics, 16(1), 2018, doi:10.1515/phys-2018-0098.
- E.V Tikyaa, A. Akinbolati, M. Shehu, “Assessment of empirical models for estimating mean monthly global solar radiation in Katsina,” FUDMA Journal of Sciences (FJS), 3(1), 333–344, 2019, doi:10.4314/bajopas.v4i2.5.
- Z. E. Mohamed, R. M. Farouk, H. H. Saleh, “The Performance Evaluation of Mathematical Models for Predicting MAD-GSR in Egypt,” Global Journal of Pure and Applied Mathematics, 14 (7), 897–918, 2018.
- T. S. Mulaudzi, N. E. Maluta, and V. Sankaran, “Evaluation of the global solar irradiance in the Vhembe district of Limpopo Province, South Africa, using different theoretical models,” Turkish Journal of Physics, 39, 264–271, 2015, doi:10.3906/fiz-1505-9.
- Ş. Ozan, T. Kuleli. “Estimation of SR over Turkey using artificial neural network and satellite data.” Applied Energy 86, 7–8 (2009): 1222-1228, doi:10.1016/j.apenergy.2008.06.003.
- A. A. El-Sebaii, F. S. Al-Hazmi, A. A. Al-Ghamdi, S. J. Yaghmour, “Global, direct and diffuse solar radiation on horizontal and tilted surfaces in Jeddah, Saudi Arabia,” Applied Energy, 87(2), 568–576, 2010, doi:10.1016/j.apenergy.2009.06.032.