Interpretable Rules Using Inductive Logic Programming Explaining Machine Learning Models: Case Study of Subclinical Mastitis Detection for Dairy Cows

Adv. Sci. Technol. Eng. Syst. J. 7(2), 143–148 (2022);
 DOI: 10.25046/aj070214
With the development of Internet of Things technology and the widespread use of smart devices, artificial intelligence is now being applied as a decision-making tool in a variety of fields. To make machine learning models, including deep neural network models, more interpretable, various techniques have been proposed. In this paper, a method for explaining the outputs of machine learning models using inductive logic programming is described. For an evaluation of this method, diagnostic models of bovine mastitis were trained using a dataset of dairy cows, and interpretable rules were obtained to explain the trained models. As a result, the rules obtained indicate that the trained classifiers detected mastitis cases depending on certain variations in the electrical conductivity (EC) values, and in some of these cases, the EC and lactate dehydrogenase fluctuated in different ways. The interpretable rules help people understand the outputs of machine learning models and encourage a practical introduction of the models as decision-making tools.
1. Introduction
This paper is an extension of a study originally presented at the 2020 IEEE 19th International Conference on Cognitive Informatics & Cognitive Computing (ICCI* CC) [1].
With the development of Internet of Things technology and the widespread use of smart devices, artificial intelligence is now being used as a decision-making tool in a variety of fields. Moreover, various machine learning models have been proposed to support an efficient and accurate medical diagnosis. Such models are expected to not only detect patients correctly, but also reveal the basis of the diagnosis.
Various techniques have been proposed to make machine learning models, including deep neural network models, more interpretable. Decision-tree-based algorithms (e.g., random forest and lightGBM [2]) provide the feature importance based on the frequency of all features in the trees generated by the algorithms. Some algorithms approximate original complex models (including a deep neural network) locally with simpler interpretable models [3, 4]. For convolutional neural network used to solving image processing tasks, gradient-based highlighting represents important regions in images where the networks focus to detect target objects or track them [5, 6].
Another approach to interpreting machine learning models is to describe their outputs using interpretable rules. Inductive logic programming (ILP) is based on predicate logic and can produce rules using inductive learning. ILP has the advantage of obtaining interpretable classification rules from training data and representing the opinions of domain experts [7, 8].
The interpretability of machine learning models has encouraged their introduction in decision-making applied in fields such as medical, including veterinary, diagnosis. Bovine mastitis, which is an inflammation of the udder or mammary gland owing to physical trauma or infection, is a common disease in dairy cattle, which dairy farmers must control to prevent economic losses.
With the introduction of auto milking systems, it has become easier to measure the indicators needed for cow health management during milking and to detect common diseases in dairy cows, including mastitis. Auto milking systems enable farmers to utilize auto mastitis detection using indicators such as milk yield, electrical conductivity, fat, protein, lactose and blood in the milk, and milk flow rate. In addition, SCC and various systems using statistical models and machine learning, including artificial neural networks, have also been reported [9]–[10].
In this study, we propose a method for explaining the outputs from machine learning models using ILP. For an evaluation of the method, diagnosis models of bovine mastitis were trained using a dataset of dairy cows, and interpretable rules were generated using ILP and the explained outputs of the mastitis detection model.
2. Method Used to Explain Classifiers through Interpretable Rules
An overview of the method used in this study is presented in Figure 1. This method aims to generate logic rules using background knowledge and outputs of a classifier, and to interpret the classification model. Interpretable rules are generated using ILP. In contrast to ordinary machine learning models such as deep neural networks, a resultant set of rules produced using ILP generally represents patterns in the given datasets. In this study, ILP is applied to outputs from classifiers trained using machine learning methods, and the set of rules generated describe how the model classifies the instances.
Although other methods based on a linear local approximation [3, 4] represent the importance of each feature, an explanation of machine learning models using ILP describes the models using nonlinear relationships with multiple features. Thus, methods for explaining classifiers can be applied to models with a complex architecture, such as deep neural networks [11, 12].
In this study, although the architectures of the machine learning models are maintained, the outputs of the models are given to an ILP system. Therefore, the proposed method is available regardless of the machine learning methods used for model training. Moreover, the definition of predicates used in ILP can be distinguished from the features in the classifiers and the predicates take advantage as a way to reflect knowledge of domain experts.
As shown in Figure 1, in the first step, a classification model is trained using machine learning methods and outputs of the classification are obtained. Background knowledge of the dataset and its outputs are then added into an ILP system, called Parallel GKS [13]. Finally, the classifier is interpreted based on the set of rules.
3. Case Study: Explanation of Bovine Mastitis Detection Model
To evaluate the proposed method, a classification model for the subclinical mastitis detection of dairy cows was trained using machine learning. With the introduction of auto milking systems, it has become easier to measure the indicators needed for cow health management during milking and to detect common diseases in dairy cows including mastitis.
Previous studies [9]–[10] used records of veterinary treatments and somatic cell count (SCC) for labeling the data of every milking as clinical or subclinical mastitis, and their models predicted the status of the quarters during each milking. SCC is generally used for the diagnosis of subclinical mastitis, and the most frequently used threshold for defining subclinical mastitis is 200,000 cells/mL [14].
However, it is thought that SCC can be affected by other factors such as the lactation number, stress, season, and breed [15].
As novel mastitis detection approaches, some biomarkers for mastitis detection have been discovered [16]–[17]. In particular, lactate dehydrogenase (LDH), which is related to inflammation, and according to a previous study is the biomarker with the lowest validation [18], is measured practically using a commercial milking machine. The result is applied to calculate the risk of developing mastitis as part of a milk analysis. However, mastitis detection using such biomarkers is still not a common approach for farmers because the equipment required is quite expensive. Therefore, in this study, a dataset in which cows labeled as either healthy or having subclinical mastitis based on the LDH values was prepared, and a common measurement, i.e., the electrical conductivity (EC), was used as a feature through the application of machine learning.
The dataset used in this study was collected between September 2018 and December 2021 at a farm in Hokkaido, Japan. On this farm, cows are milked any time they want, and items other than mastitis risk are measured during every milking. Data from September 2018 to August 2020 collected on the farm were used to train the detection model, and the remaining data were used to evaluate the model.
Datasets measured using an auto milking machine (a DeLaval
Voluntary Milking System TM; VMS) and a milk analyzer (a DeLaval Herd Navigator TM; HN) were used. The HN measures the LDH, which is an index of subclinical mastitis, in milk and is used to calculate the risk of contracting mastitis.
The mastitis risk takes a value of zero to 100. On a farm, an HN measurement of greater than 70 allows farmers to suspect that a cow has mastitis. Therefore, in this study, subclinical mastitis cases were determined based on the mastitis risk. If her mastitis risk is above 70, the cow has subclinical mastitis; otherwise, her udder is disease-free.
3.1 Data Preprocessing
In this detection model, two features are calculated based on the
EC obtained from VMS. One is the maximum EC values (max EC) in the udder, and the other is ratio of the maximum to minimum EC values, i.e., the inter-quarter ratio (IQR). The EC is one of the measurements related to mastitis, and its value increases when a cow has mastitis [19]. According to our previous study [1], this mastitis detection model includes a four-day time series of these two features from three days prior to the prediction day, with eight features in total.
As mentioned above, cows on this farm are milked any time they want, and items without mastitis risk are measured during every milking. In addition, LDH in milk (indicating the risk of mastitis) is generally measured once every day to every three days, and the next measurement day is determined depending on the risk value. Therefore, this dataset consists of time series data, and the number of data points of a cow differs each day. Thus, features are calculated using data on the milking with the highest EC.
The preprocessed datasets in this study are shown in Table 1. In the test dataset, labeled samples are used for an evaluation of the detection model, and unlabeled samples are only used for generating rules through ILP.
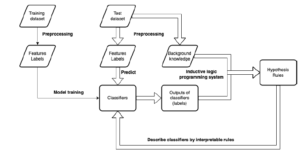
Figure 1: Overview of our method used to explain classifiers through interpretable rules.
Table 1: Number of cows and samples in the training and test datasets.
|
3.2 Learning Classification Models
After data preceding, classifiers for bovine mastitis detection are trained using a support vector machine (SVM). In this case, cows with subclinical mastitis are sparsely present in the dataset, and hence under-sampling (using the repeated edited nearest neighbors algorithm [20, 21]) was applied to the training dataset, and a regularization parameter in SVM (C) was adjusted using class weights, which are inversely proportional to the class frequencies in the input data.
The trained models were evaluated through a 10-fold cross validation using the sensitivity, specificity, and area under a receiver operating characteristic curve, as in previous studies on mastitis detection [9, 22, 23]. To evaluate the small number of false positives, the precision was also used for the evaluation.
Samples in the test datasets were given to the trained dataset and classified as fine or having mastitis. Using these outputs, interpretable rules explaining the detection model were generated using ILP.
3.3 Generation of Rules Using ILP to Explain the Trained Models
Using the outputs from the trained classifiers and background knowledge of samples in the test dataset, interpretable rules were obtained through ILP learning. Like other machine learning methods, ILP algorithms extract patterns in the samples with a certain label. In this study, an ILP system called GKS [24, 13] was used to employ ILP and generate rules.
Background knowledge is used in ILP learning, similar to features in other machine learning methods, and is represented by predicates in terms of the logic program. To describe the numerical features in terms of ILP, features were discretized based on the definition of the predicates for background knowledge and rules. In this case, three arguments were defined, as shown in Table 2. Such background knowledge of samples labeled by the trained classifier was given to the ILP system, and rules consisting of the predicates were generated.
A variable id in Table 2 represents one sample in the datasets.
Table 2: Definition of the predicates in the subclinical mastitis detection model.
|
@IQR is a predicate which describes difference of the EC values between cows’ quarters on the prediction day and whose variable, IQR, takes four values (<= mean − std, > mean − std, > mean, > mean + std where mean is 1.08 and std is 0.07) defined by discretized values of IQR (features in the detection models). @delta maxEC represents the difference of max EC values between two consecutive days (from three days prior to the prediction day) and a variable delta takes three values (minus, flat, plus which describes the value of max EC decreases or increases by over 0.4 or remain flat).
@delta maxEC also has two variables representing targeted days from three days prior to the prediction day and these variables take four values (day3,day2,day1,day0). @before day is a predicate which expresses an ordinal relation between these four values. This predicate contributes to generate rules flexibly, which consider difference of the values between arbitrary consecutive two days and mention changes of the values between variable prediods before the prediction day, unlike tree-based algorithms.
Outputs from the learned classifier and the background knowledge were given to parallel GKS and ILP learning was employed. Finally, interpretable rules for mastitis detection models were obtained.
4. Result and Discussion
To evaluate our method for explaining machine learning models using interpretable rules, it was applied to the classification problem of bovine mastitis detection. Table 3 lists the evaluation results for the classifier of subclinical mastitis detection using an SVM. In the test dataset, 79 records of veterinary treatment were included, and 66 out of 79 (83.5%) records were detected as subclinical mastitis by the classifier, whereas the target label of the model underestimated the mastitis risk. Therefore, the trained model detected some of the clinical mastitis cases correctly, although the precision of the classifier was 15%.
Table 3: Subclinical mastitis detection performance in the training dataset (a 10-fold cross validation was used) and the test dataset.
| Sensitivity | Specificity | Precision | AUC | |
| Training | 0.668 | 0.814 | 0.137 | 0.809 |
| Test | 0.667 | 0.840 | 0.148 | 0.831 |
Using outputs from the classifier, ILP learning was employed, and interpretable rules were obtained. The rules that were the most readable and related to the real conditions of mastitis are listed below. These rules describe the relationship between mastitis and the variation of the EC values.
Rule1 pos(A) :- IQR(A, > mean+std), delta maxEC(A, B, C, plus), delta maxEC(A, day0, day1, flat)
Rule2 pos(A) :- delta maxEC(A, B, C, minus), delta maxEC(A, C, D, minus)
Rule3 pos(A) :- IQR(A, > mean), delta maxEC(A, day2, B, plus)
Rule4 pos(A) :- delta maxEC(A, B, C, minus), delta maxEC(A, day2, day3, plus)
These rules were described variation of max EC values before rising mastitis risk by combination of @delta maxEC. Values A, B and C given to variables day1 or day2 in this predicate represented arbitrary consecutive days before the prediction day, which made genereated rules more scalable.
Among the rules obtained, some clearly explaining the classifier are described in detail.
Rule1 pos(A) :- IQR(A, ¿mean+std), delta maxEC(A, B, C, plus), delta maxEC(A, day0, day1, flat)
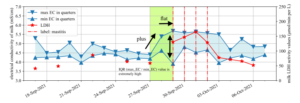
Figure 2: One of the subclinical mastitis cases corresponding to Rule 1.
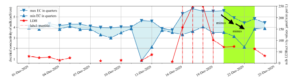
Figure 3: One of the subclinical mastitis cases in which the values of EC and LDH changed differently corresponding to Rule 2.
Rule 1 indicates that cows whose IQR value is extremely high and whose max EC values continuously increase have a high risk of subclinical mastitis. Figure 2 is a case corresponding to Rule 1. This rule also indicates that the detection model comprehends the typical relationship between bovine mastitis and electrical conductivity of milk. In this case, EC and LDH increased simultaneously, and the classifier detected a high mastitis risk as the mastitis risk alarm based on LDH.
Rule2 pos(A) :- delta maxEC(A, B, C, minus), delta maxEC(A, C, D, minus)
Rule 2 indicates that cows whose max EC values have been decreasing for two straight days have a risk of subclinical mastitis. Rule 2 apparently conflicts with Rule 1. However, this rule explains some cases of cows with subclinical mastitis. Figure 3 shows an example of cases in which the values of EC and LDH increased at disparate times. In this case, the mastitis risk values based on LDH, i.e., the target label of the classifier used in this study, become lower before the EC values began decreasing. However, the cow was deemed to be disordered by the farm staff and received veterinary treatment on December 23rd. Therefore, Rule 2 suggests that the trained classifier detected clinical cases that continued after the LDH values began decreasing.
The rules genereated by ILP practically interpreted the mastitis detection model in this study and provided explanation of the mastitis detection, which were available for users of this detection system, staff of the farm, to understand how to classify cows as mastitis or fine. Providing reason of diagnosis by machine learning to users of the models would accelerate to develop the models as well as support farmers control health of dairy cows efficiently.
5. Conclusion
In this study, a method for explaining the outputs from machine learning models using ILP was suggested and evaluated when applied to the task of subclinical mastitis detection for dairy cows. For an earlier detection of the onset of subclinical mastitis, a model for subclinical mastitis detection trained using risk values based on LDH was proposed. Interpretable rules were then generated using ILP to interpret the trained models. The rules obtained indicate that the trained classifiers detect mastitis cases depending on a certain variation of the EC values and that the EC and LDH fluctuate in different ways. The interpretable rules help in understanding the outputs of machine learning models and encourage a practical introduction of models as tools for decision making.
- H. Motohashi, H. Ohwada, C. Kubota, “Early detection method for subclinical mastitis in auto milking systems using machine learning,” in 2020 IEEE 19th International Conference on Cognitive Informatics & Cognitive Computing (ICCI* CC), 76–83, IEEE, 2020, doi:10.1109/iccicc50026.2020.9450258.
- G. Ke, Q. Meng, T. Finley, T. Wang, W. Chen, W. Ma, Q. Ye, T.-Y. Liu, “Light- gbm: a highly efficient gradient boosting decision tree,” in Proceedings of the 31st International Conference on Neural Information Processing Systems, NIPS’17, 3149–3157, Curran Associates Inc., Red Hook, NY, USA, 2017, doi:10.5555/3294996.3295074.
- M. T. Ribeiro, S. Singh, C. Guestrin, “” Why should I trust you?” Explaining the predictions of any classifier,” in Proceedings of the 22nd ACM SIGKDD
international conference on knowledge discovery and data mining, 1135–1144, 2016, doi:10.1145/2939672.2939778. - S. M. Lundberg, S.-I. Lee, “A unified approach to interpreting model predic- tions,” in Proceedings of the 31st International Conference on Neural Informa- tion Processing Systems, NIPS’17, 4768–4777, Curran Associates Inc., Red Hook, NY, USA, 2017, doi:10.5555/3295222.3295230.
- R. R. Selvaraju, M. Cogswell, A. Das, R. Vedantam, D. Parikh, D. Batra, “Grad-cam: visual explanations from deep networks via gradient-based local- ization,” in Proceedings of the IEEE international conference on computer vision, 618–626, 2017, doi:10.1109/iccv.2017.74.
- D. Smilkov, N. Thorat, B. Kim, F. Vie´gas, M. Wattenberg, “Smoothgrad: removing noise by adding noise,” arXiv preprint arXiv:1706.03825, 2017, doi:10.48550/arXiv.1706.03825.
- N. P. Martono, K. Abe, T. Yamaguchi, H. Ohwada, “An analysis of motion transition in subtle errors using inductive logic programming: a case study in approaches to mild cognitive impairment,” International Journal of Soft- ware Science and Computational Intelligence (IJSSCI), 10(1), 27–37, 2018, doi:10.4018/ijssci.2018010103.
- S. Sasaki, R. Hatano, H. Ohwada, H. Nishiyama, “Estimating productiv- ity of dairy cows by inductive logic programming,” in Proceedings of The 29th International Conference on Inductive Logic Programming, 2019, doi: 10.1007/978-3-030-49210-6.
- D. B. Jensen, H. Hogeveen, A. De Vries, “Bayesian integration of sen- sor information and a multivariate dynamic linear model for prediction of dairy cow mastitis,” Journal of Dairy Science, 99(9), 7344–7361, 2016, doi: 10.3168/jds.2015-10060.
- W. Steeneveld, L. C. van der Gaag, W. Ouweltjes, H. Mollenhorst, H. Hogeveen, “Discriminating between true-positive and false-positive clinical mastitis alerts from automatic milking systems,” Journal of Dairy Science, 93(6), 2559–2568, 2010, doi:10.3168/jds.2009-3020.
- J. Rabold, M. Siebers, U. Schmid, “Explaining black-box classifiers with ILP–empowering LIME with Aleph to approximate non-linear decisions with relational rules,” in International Conference on Inductive Logic Programming, 105–117, Springer, 2018, doi:10.1007/978-3-319-99960-9 7.
- J. Rabold, G. Schwalbe, U. Schmid, “Expressive explanations of dnns by com- bining concept analysis with ilp,” in KI 2020: Advances in Artificial In- telligence, 148–162, Springer International Publishing, Cham, 2020, doi: 10.1007/978-3-030-58285-2 11.
- H. Nishiyama, H. Ohwada, “Parallel inductive logic programming system for superlinear speedup,” in International Conference on Inductive Logic Program- ming, 112–123, Springer, 2017, doi:10.1007/978-3-319-78090-0 8.
- S. Pyo¨ra¨la¨, “Indicators of inflammation in the diagnosis of mastitis,” Veterinary research, 34(5), 565–578, 2003, doi:10.1051/vetres:2003026.
- A. J. Schepers, T. J. G. M. Lam, Y. H. Schukken, J. B. M. Wilmink, W. J. A. Hanekamp, “Estimation of variance components for somatic cell counts to determine thresholds for uninfected quarters,” Journal of Dairy Science, 80(8), 1833–1840, 1997, doi:10.3168/jds.s0022-0302(97)76118-6.
- C. M. Duarte, P. P. Freitas, R. Bexiga, “Technological advances in bovine mas- titis diagnosis: an overview,” Journal of Veterinary Diagnostic Investigation, 27(6), 665–672, 2015, doi:10.1177/1040638715603087.
- Y. C. Lai, T. Fujikawa, T. Maemura, T. Ando, G. Kitahara, Y. Endo, O. Yamato, M. Koiwa, C. Kubota, N. Miura, “Inflammation-related microRNA expression level in the bovine milk is affected by mastitis,” PLoS One, 12(5), e0177182, 2017, doi:10.1371/journal.pone.0177182.
- M. Åkerstedt, L. Forsba¨ck, T. Larsen, K. Svennersten-Sjaunja, “Natural vari- ation in biomarkers indicating mastitis in healthy cows,” Journal of Dairy Research, 78(1), 88–96, 2011, doi:10.1017/S0022029910000786.
- E. Norberg, H. Hogeveen, I. R. Korsgaard, N. C. Friggens, K. H. M. N. Sloth, P. Løvendahl, “Electrical conductivity of milk: ability to predict mastitis status,” Journal of Dairy Science, 87(4), 1099–1107, 2004, doi: 10.3168/jds.s0022-0302(04)73256-7.
- I. Tomek, “An experiment with the edited nearest-neighbor rule,” IEEE Trans- actions on Systems, Man, and Cybernetics, SMC-6(6), 448–452, 1976, doi: 10.1109/TSMC.1976.4309523.
- D. L. Wilson, “Asymptotic properties of nearest neighbor rules using edited data,” IEEE Transactions on Systems, Man, and Cybernetics, SMC-2(3), 408– 421, 1972, doi:10.1109/TSMC.1972.4309137.
- M. Khatun, P. C. Thomson, K. L. Kerrisk, N. A. Lyons, C. E. F. Clark, J. Molfino, S. C. Garc´ıa, “Development of a new clinical mastitis detection method for automatic milking systems,” Journal of Dairy Science, 101(10), 9385–9395, 2018, doi:10.3168/jds.2017-14310.
- D. Cavero, K.-H. To¨lle, C. Henze, C. Buxade´, J. Krieter, “Mastitis detection in dairy cows by application of neural networks,” Livestock Science, 114(2-3), 280–286, 2008, doi:10.1016/j.livsci.2007.05.012.
- F. Mizoguchi, H. Ohwada, “Constrained relative least general generalization for inducing constraint logic programs,” New Generation Computing, 13(3), 335–368, 1995, doi:10.1007/bf03037230.
No related articles were found.