Indoor Position and Movement Direction Estimation System Using DNN on BLE Beacon RSSI Fingerprints

Adv. Sci. Technol. Eng. Syst. J. 7(3), 129–138 (2022);
 DOI: 10.25046/aj070315
In this paper, we propose a highly accurate indoor position and direction estimation system using a simple fully connected deep neural network (DNN) model on Bluetooth Low Energy (BLE) Received Signal Strength Indicators (RSSIs). Since the system’s ultimate goal is to function as an indoor navigation system, the system estimates the indoor position simultaneously as the direction of movement using BLE RSSI fingerprints recorded indoors. To identify the direction of movement along with the position, we decided to use multiple time instances of RSSI measurements and fed them to a fully-connected DNN. The DNN is configured to output the direction with the location simultaneously. RSSIs are known to be affected by various fluctuating factors in the environment and thus tend to vary widely. To achieve stable positioning, we examine and compare the effects of temporal interpolation and extrapolation as preprocessing of multiple RSSI sequences on the accuracy of the estimated coordinates and direction. We will also examine the number of beacons and their placement patterns required for satisfactory estimation accuracy. These experiments show that the RSSI preprocessing method optimum for practical use is interpolation and that the number and placement of beacons to be installed does affect the estimation accuracy significantly. We showed that there is a minimum number of beacons required to cover the room in which to detect the location if the estimation error is to be minimized, in terms of both location and direction of movement. We were able to achieve location estimation with an estimation error of about 0.33 m, and a movement estimation error of about 10 degrees in our experimental setup, which proves the feasibility of our proposed system. We believe this level of accuracy is one of the highest, even among methods that use RSSI fingerprints.
1. Introduction
In recent years, almost everyone owns a smartphone. Some of the most often used applications on smartphones are those with location and navigation capabilities, such as Google maps. Global Positioning System (GPS) signals received from satellites are used for location detection in many mapping and navigation applications. However, these applications cannot be used indoors since the reception of GPS signals is generally poor due to the building structures. As an alternative to GPS, indoor positioning systems have been developed in recent years using various methods such as WiFi, Indoor Messaging System (IMES), and other wireless LAN standards, as well as dedicated devices such as Light Detection and Ranging (LiDAR) [[1]–6]. However, there are many issues to be solved for the construction of the system, such as the availability of terminals supporting these standards, and the installation cost.
Many of the indoor localization systems were based on WiFi age error of 1.21 m is possible in an apartment of 14.5 m by 4.5 m, but the number of Access Points (APs) is 59, which is considerably large for a room this size. [9] uses Channel State Information (CSI) fingerprints instead of RSSI fingerprints with an Autoencoder. CSIs provide receive levels of multiple subcarrier signals which can be collectively used to detect the receive level and direction more accurately than a simple RSSI. They were able to achieve an average error of 0.9425 m inside a living room of size 4 m by 7 m with just one AP. However, CSI is not available on all network interface cards.
In this research, we focused on BLE beacons [10, 11]. BLE is one of the short-range wireless communication standards, and it is possible to conduct wireless communication at a lower cost and lower power consumption (often operating on battery for years without the need for replacement), and are easier to install and maintain compared to other methods, such as WiFi, which generally costs much more and requires a power line. In the real world, BLE technology is quickly spreading in various forms, such as devices for cash-less payment at cash registers and beacons that provide detailed product promotion information, including discount coupons, to nearby mobile devices. In [12], localization performance using BLE beacons is compared to WiFi, and was shown that localization performance using BLE potentially outperforms WiFi. Research using the BLE has been conducted using a variety of approaches [13– 19]. Application of such systems to a university campus navigation system has been explored in [20].
The theoretical values of RSSIs received from beacons are found to decay inversely proportional to the square of the distance from the beacons. However, RSSI is known to fluctuate widely in real environments [21]. This is due to the effect of walls, obstacles, and radio interferences from other radio communication devices, among others. Therefore, the Euclidean distance calculation method, which calculates the current position directly from the magnitude of RSSI, generally gives an error of several meters or more. In this research, we propose a method that uses DNNs on the collected RSSI fingerprints [22–24]. This method requires the collection of RSSI data in advance in the environment where we want to perform positioning. It is known that RSSI variations caused by people and obstacles in the environment affect the estimation significantly. In this study, we use DNNs with RSSI fingerprints as training data, and we expect that DNNs can flexibly respond to RSSI variations in position estimation.
One of our target applications for this research is a navigation system that combines an indoor positioning system with augmented reality (AR). One of the intended applications of this system is an auditory navigation system for the visually impaired [25]. In this system, audio sign signals are localized towards the target for navigation. This signal is used as a cue to indicate the direction the user should move next. Localization of the auditory sign signal is achieved by convolving the head-related transfer function (HRTF) corresponding to the direction of the sign signal with the monaural signal. Since this direction is relative to the user’s current orientation (the front), it is necessary to detect this orientation at the same time as the position. Therefore, the DNN used in this research estimates the direction of movement (the orientation) as well as the position simultaneously.
There has been some research on using DNNs with BLE RSSI fingerprints (e.g., [26]). However, since our intended application also requires the estimation of the movement of the user, we decided to use multiple time instances of RSSI measurements and fed this to a DNN model to estimate the current position as well as the direction of the movement of the user simultaneously [22–24]. We believe the novelty of our method is this simultaneous estimation, where we employ multiple time instances of RSSI measurements to model the dynamically changing position due to users moving in a path. By explicitly training our DNN model with changing RSSI measurements due to motion, we can detect the direction of the movement from the temporal changes in the RSSI and also estimate the position more accurately when the RSSI measurements are changing due to motion, potentially degrading accuracy with conventional stationary modeling.
There have been attempts to emulate the WiFi RSSI movement data to be fed to an RNN model [1] to estimate the movement. However, their RSSIs are measured in a static state, which does not capture the dynamic change in the RSSIs due to motion. There also have been attempts to track the user position by using both BLE beacons and Pedestrian Dead Reckoning (PDR) [27]. However, the BLE beacons seem to be only used to correct the drift caused by PDR in this work.
This paper is organized as follows. Section 2 describes the proposed method for estimating indoor position and direction of movement using DNN. Section 3 describes the conditions of RSSI preprocessing and the experiments on the placement and number of beacons to be placed. In Section 4, the experimental results are described and discussed. In Section 5, we conclude our work and discuss future challenges.
2. Proposed Method
We propose an indoor position and movement direction estimation system using a DNN that has been previously trained with RSSI fingerprints of a given room. The RSSI fingerprints, i.e., RSSI measurements from all available BLE beacons, are manually collected in the actual environment (test room) to train the DNN. As stated in the introduction, we plan to eventually integrate the proposed method into a navigation system that generates audio sign signals toward the target position. To do so, the direction in which the user is moving (and also facing towards) needs to be detected so that the sign signal can be localized relative to the detected direction. Thus, we decided to use multiple time instances of the RSSI measurements as RSSI fingerprints to detect the direction from the difference between the multiple temporal RSSI measurements. In this paper, we used two time instances, i.e., one set of RSSI measurements at the current time interval, and one measurement from the prior time interval. The explicit integration of motion estimation with position estimation may be what is unique with this method.
We used the RSSI measurements reported in the advertisement packets from the beacons. These advertisement packets are designed to be sent periodically to all nodes in the proximity. However, we found that the time intervals of these packets are often not periodical. Some packets were also lost. Thus, it was necessary to preprocess the RSSI measurements to obtain data in periodic intervals at the exact time instances. In cases where the packets were lost, the RSSI data was estimated from data that was received intact before or after the lost packet. The preprocessing of the RSSI measurements will be described in detail in the following section.
The training configuration of the DNN is shown in Figure 1. The RSSI set for the current time and the prior time interval is fed to the DNN. The DNN estimates the current position and the direction of movement from the given RSSI sets. This is compared to the labeled (true) position and movement direction, and the mean square error (MSE) is calculated, which is fed to the DNN to update the internal weights. This is repeated to minimize the MSE.
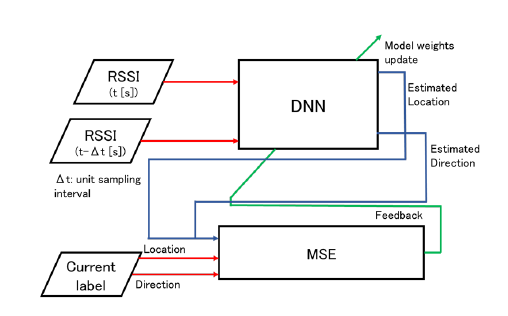
Figure 1: Block diagram of the proposed method. MSE is the Mean Square Error calculation between the estimated and the labeled position and movement direction values.
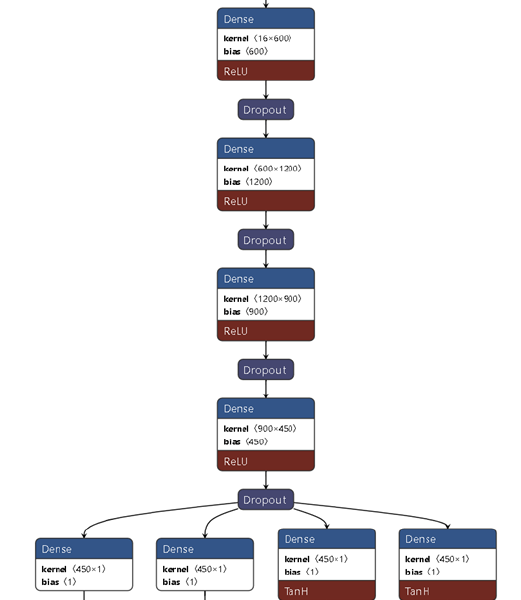
Figure 2: Configuration of the DNN for continuous values of x-y positions and movement directions.
To estimate the user’s position, we feed the RSSI from all available BLE beacons for two consecutive time intervals to the trained DNN. The trained DNN will output the estimated position and direction of movement simultaneously from these inputs.
Table 1: Parameters of the DNN model.
| Item | Conditions | ||
| Units in each layer | 16-600-1200-900-450-4 | ||
| Epochs | 1000 | ||
| Batch size | 256 | ||
| Dropout | 0.5 | ||
| Activation | Hidden layers | ReLU | |
| Output layers | X, Y | linear | |
| Dir. (cat.) | softmax | ||
| Dir. (cont.) (sinθ,cosθ) | tanh | ||
In this experiment, the RSSI was measured with no obstacles in the environment. However, since RSSI measurements collected from multiple data sequences are used as the training data of the DNN model, it is expected that estimation with some number of obstacles can be accomplished with a relatively small increase in error. The parameters of the DNN are shown in Table 1. The structure of
DNN when the direction of movement is treated as a continuous value is shown in Figure 2.
As stated before, DNNs are used to simultaneously estimate the position and the direction of movement. The units in the input layer are given the RSSI of multiple beacons for two consecutive point-in-time instances in the training data. In the output layer, two units are used for the x– and y-coordinates of the estimated position and additional units are used for the estimation of the movement direction.
We modeled the motion direction as either categorical or continuous. The categorical model outputs one of eight directions (0, 45, 90, 135, 180, 225 270, or 315 ° ) as the estimate as one-hot output. Note that the categorical estimation values result in an estimation error, if any, of at least 45° [22], however.
On the other hand, the continuous output processes the movement directions as continuous values. The advantage of this is that the numerical difference (error) between the estimated and true values can also be expressed as continuous values. For example, in the experiment in [22], when the direction of movement was treated as a continuous value instead of a categorical value, the results showed that the frequency of fatal errors in the estimation of the direction of movement (e.g., estimates that are the exact opposite of the correct value) was greatly reduced. The estimation of the angle θ, the direction of movement, is calculated according to (1) using sinθestimate and cosθestimate estimated as continuous values, and where θestimate is the estimated angle of movement.
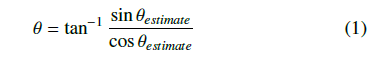
We decided to use sinθ and cosθ to express the movement direction as output from the DNN. This is because these values are continuous, ranging from −1 to +1. If they were expressed in raw degrees, we would have to deal with discontinuities between 0 and 360° (if expressed as positive values) or −180° and +180° (if expressed using positive values for the right half, and negative values for the left half). The output values sinθ and cosθ are converted to movement direction by applying tan−1 to the ratio between sinθ and cosθ ratios (i.e., tanθ). We would have to deal with discontinuities at +90° and −90° for this conversion, but this can be done relatively easily by observing the positive/negative combinations of sinθ and cosθ values.
For the training data of the DNN, RSSI measurements were conducted when the receiver moved at a constant walking speed in one of eight predetermined directions (described in Section 3). These data were labeled with the correct position and direction. For training, 11,336 sets were used, of which 20% were used as validation data. For the test data, we used 2,434 sets.
The configuration of our proposed indoor position and movement direction estimation system is shown in Figure 3. This system is a client-server type system. First, the user’s smartphone collects the RSSIs transmitted from multiple beacons at regular intervals. Next, the smartphone sends the collected RSSIs to the PC server via UDP packets. The server processes the received RSSIs, estimates the position and direction of movement using a DNN model that has been trained in advance, and sends the estimated position and direction back to the smartphone using UDP packets. By repeating the above operation, continuous estimation becomes possible. By providing DNN models that match the environment on the server-side, the computational load on the client-side can be reduced.
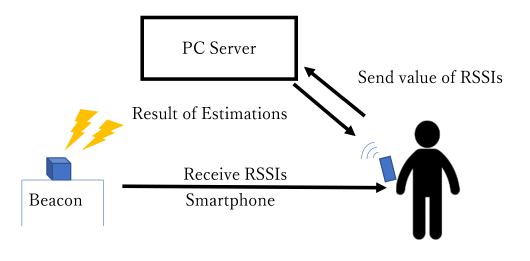
Figure 3: Proposed client-server system configuration.
3. Experimental Conditions
We conducted two evaluation experiments explained here. The first experiment (A) was designed to evaluate the accuracy achievable using a fixed beacon position configuration and a fixed number of beacons (eight, which is the maximum number to be considered in this paper). The goal of this experiment is to compare the effect of preprocessing on the RSSIs of the estimation accuracy. The second experiment (B) was designed to evaluate the effect of the number of beacons and their positions on the estimation accuracy. The goal was to find the minimum number of beacons and their positions required for acceptable estimation accuracy.
3.1. Experiment A: Comparison of estimation accuracy among RSSI processing methods
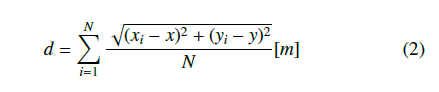
The experimental environment is shown in Figure 4. As shown in this figure, eight beacons, shown here as Ob , were placed on chairs at regular intervals in a rectangular room (5 m x 8 m). A total of 40 grid points (5 x 8) were set at 1 m intervals. For this environment, we assumed a total of 31 vertical, horizontal, and diagonal linear paths in total. We collected data for each path by moving at a constant speed of 0.5 m/s repeatedly from the edge to the other edge of each path. We used a smartphone with BLE reception capability, SONY Xperia5 (SO-01M), as the receiving device, and MybeaconPro (MB004) from Aplix Ltd. as the BLE beacons. We measured the RSSI data every 0.25 seconds while moving on each path. To acquire the RSSI data at the exact instance, temporal interpolation and extrapolation of the RSSI sequence data are considered in this experiment.
Interpolation is a method to calculate the RSSI on the estimated coordinates using the RSSI measured before and after passing through the estimated grid points, while extrapolation is a method to calculate the RSSI on the estimated grid points using the RSSI acquired before passing through the estimated grid points. When collecting RSSI data in a real environment for experiments, we want to acquire RSSI precisely on the grid point positions we want to estimate (the grid points shown in Figure 4), but this may be difficult due to discrepancies in the RSSI measurement timing. In addition, in rare cases, RSSI may not be collected from some beacons (due to internal processing delays or packet losses), and the collected RSSI sequence data may be collected at unequal time intervals. Therefore, we use interpolation and extrapolation to create RSSI data that are equally spaced in time.
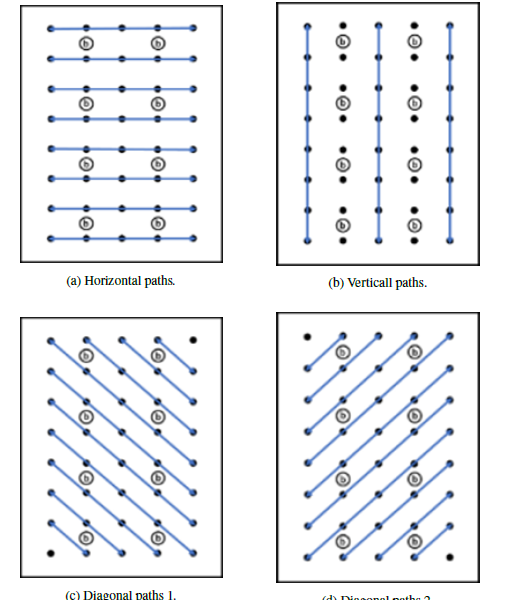
Figure 4: Beacon placement and path configuration for experiment A. Beacons are shown as Ob , and the dots indicate the grid points at which the position and the motion direction is evaluated.
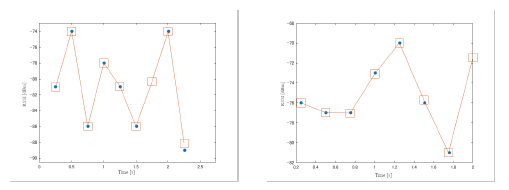
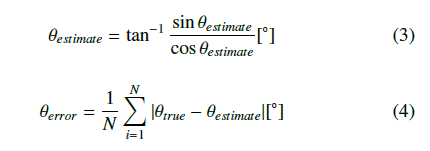
Figure 5: Examples of interpolation and extrapolation of RSSI data. The blue dots indicate the measured RSSIs, and the squares indicate the smoothed data used in the later estimation stages using DNNs.
Figure 5 shows an example of interpolation and extrapolation of RSSI data. In this figure, the collected RSSI data is represented by dots and the interpolated and extrapolated data by squares. In this experiment, RSSI data was collected while walking at a constant speed of 0.5 m/s. The subjects are expected to pass over the grid points in Figure 4 every 2 seconds. The RSSI to be acquired at exact timing is acquired from a data sequence that is supplemented at intervals of 0.25 s using interpolation or extrapolation. The interpolation is based on the piecewise cubic Hermitian interpolation polynomial (pchip) [28, 29], and the extrapolation is based on cubic spline interpolation [30, 31].
In the example in Figure 5 (a), the sample at 1.75 s was lost and was interpolated from samples before and after this interval. In Figure 5 (b), the sample at 2 s was not available and was extrapolated from preceding samples. Up to seven preceding samples and one succeeding sample in time are used to interpolate one coordinate in the collected data. Extrapolation uses up to 8 past samples. Since RSSI values in the real environment vary widely, it is not possible to process accurate RSSI data if the number of data used for interpolation and extrapolation is small. Thus, based on preliminary experiments, we decided to use the above-mentioned preceding and succeeding samples for smoothing as a compromise between accuracy and real-time constraints. We will also compare the accuracy without RSSI processing (no interpolation or extrapolation).
We will also examine whether categorization or continuous angular values are appropriate for estimating the direction of movement. The output layer of DNN is different depending on how to handle the movement direction. If the movement direction is output as a categorical value, the output layer will be 10 (x-, y-coordinates, and 8 additional outputs for one of 8 directional categories, i.e. 8 × 45°, as one-hot output). If the movement direction is output as a continuous value, the output layer of DNN will be 4 (x-, y-coordinates, and sinθ and cosθ values).
To compare the accuracy of the position estimation, we created a heat map showing the average estimation error for all coordinates and the average estimation error for each coordinate with each RSSI processing method. The average position estimation error, d, is calculated as in (2).
Here, N is the number of estimations, and x and y are the true coordinates, and xi and yi are estimated x and y positions. As stated before, to treat the movement direction as a continuous value in the DNN, the output of the DNN is set to be sinθ and cosθ. Therefore, the error in estimating the direction of movement, θerror, is calculated as shown in (3) and (4).
sinθestimate
N
i=1
Here, θtrue is the true direction of movement, and sinθestimate and cosθestimate are estimated sin and cos values output from the DNN.
3.2. Experiment B: Comparison of estimation accuracy by placement and number of installed beacons
The number and placement pattern of the installed beacons were set as shown in Figure 6 in this experiment to investigate the effect of beacon placement and the number of beacons.
Beacons were placed on the chair at regular intervals as shown in Figure 6, and a total of 40 grid points (5 × 8) were set at 1 m intervals. As in Experiment A, a total of 31 vertical, horizontal and diagonal linear paths were assumed, and data were collected by moving at a constant speed of 0.5 m/s repeatedly from the edge of each path. The collected RSSI data were interpolated to obtain the exact RSSI measured at the estimated grid points. All movement directions were treated as continuous values. Figures 6 (a) to (d) show the configuration of the beacon placement to compare estimation accuracy for four patterns using four beacons. In Figures 6 (d) to (f), the number of beacons to be placed is varied to compare the estimation accuracy. The calculation of the estimation accuracy is done in the same way as in Experiment A.
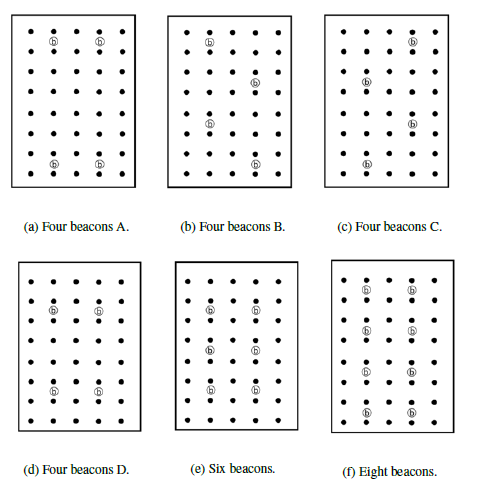
Figure 6: Beacon placement for experiment B. Beacons are shown as Ob , and the dots indicate the grid points at which the position and the motion direction is evaluated.
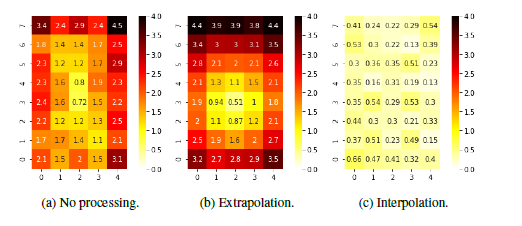
Figure 7: Position estimation error using movement direction with continuous values.
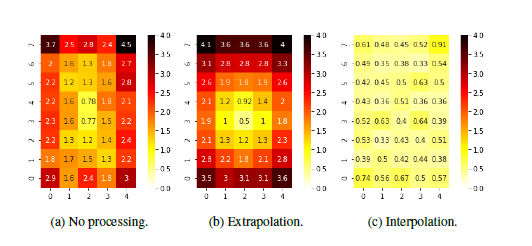
Figure 8: Position estimation error using movement direction with categorical values.
4. Results and Discussions
4.1. Experiment A
The experimental results are shown in Figure 7 through 10 and Tables 2, 3, and 4, respectively.
Table 2: Average direction of movement estimation error with continuous direction values. The path direction notations are L:horizontal right to left, R: horizontal left to right, U: vertical bottom to far top, D: vertical top to near bottom, UL: diagonal lower right to upper left, LL: diagonal upper right to lower left, UR: diagonal lower left to upper right, LR: diagonal upper left to lower right, and All: average over all directions.
| Direction | Average estimation error [ ° ] | ||
| No processing | Extrapolation | Interpolation | |
| All | 115.96 | 78.28 | 12.96 |
| L | 59.02 | 73.76 | 10.75 |
| R | 57.48 | 76.02 | 14.72 |
| U | 159.49 | 109.44 | 14.38 |
| D | 143.86 | 73.51 | 11.12 |
| UL | 131.55 | 89.99 | 10.27 |
| LL | 130.26 | 53.65 | 15.44 |
| UR | 156.59 | 90.53 | 7.14 |
| LR | 123.78 | 67.81 | 17.68 |
Table 3: Average direction of movement estimation error with categorical direction values.
| Direction | Average estimation error [ ° ] | ||
| No processing | Extrapolation | Interpolation | |
| All | 112.60 | 85.24 | 10.61 |
| L | 57.09 | 38.44 | 10.99 |
| R | 45.15 | 100.83 | 12.78 |
| U | 164.79 | 90.36 | 10.52 |
| D | 136.71 | 80.18 | 11.10 |
| UL | 135.48 | 65.16 | 9.34 |
| LL | 119.57 | 53.65 | 12.96 |
| UR | 153.00 | 98.91 | 3.13 |
| LR | 125.68 | 96.35 | 15.28 |
Table 4: Direction estimation error distribution by angle error range.
| Error range | Occurrences | |
| Continuous | Categorical | |
| 157.5 ≤ θ ≤ 180.0 | 13 | 9 |
| 112.5 ≤ θ ≤ 157.5 | 18 | 25 |
| 67.5 ≤ θ ≤ 112.5 | 78 | 102 |
| 22.5 ≤ θ ≤ 67.5 | 314 | 269 |
| 0.0 ≤ θ ≤ 22.5 | 2011 | 2029 |
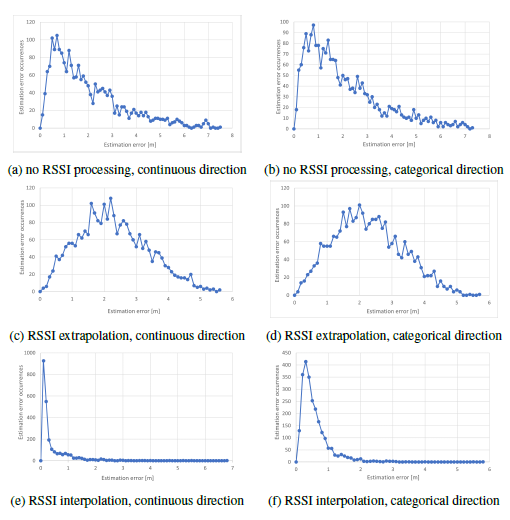
Figure 9: Position estimation error distribution by RSSI processing method and angular expression.
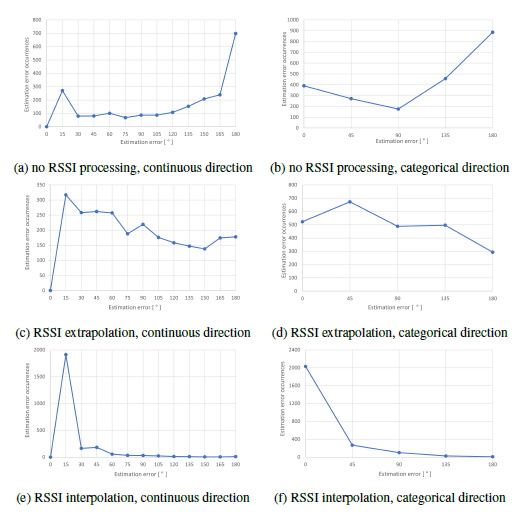
Figure 10: Direction estimation error distribution by RSSI processing method and angular expression.
Figures 7 and 8 show the position estimation results when the direction of movement is treated as a continuous value and when it is treated as a categorical value, respectively. The average error at each grid position is color-coded as shown in the color bars. Figs. (a), (b), and (c) in both figures show the average estimation error at each grid position when RSSI is not processed, extrapolated, and interpolated, respectively. Note that we trained and tested the DNN with the same RSSI sequence handling, i.e., applying no processing on the RSSI data in both training and testing to get (a), applying extrapolation to both the training and test data for (b), and interpolation to both the training and test data for (c), respectively.
The average position estimation errors for the three methods in Figure 7 were 1.777 m, 2.069 m, and 0.330 m, respectively. The average estimation errors of the three methods in Figure 8 were 1.812 m, 2.061 m, and 0.469 m, respectively. These results show that interpolation can provide much higher position estimation accuracy. On the other hand, the difference in the treatment of the direction of movement (categorical vs. continuous) does not seem to have a significant impact on the accuracy of position estimation.
Tables 2 and 3 show the direction estimation errors when the direction of movement is treated as a continuous value and when it is treated as a categorical value, respectively. Table 4 also compares the error range distribution of both continuous and categorical direction. From Table 2 and 3, we can see that interpolation is still effective in estimating the direction of movement. However, depending on how the direction of movement is treated, the magnitude of the error remains the same for both categorical and continuous values. This is also evident in Table 4, where we can see that both methods generate approximately the same number of instances with errors in each range. It should be added, however, that the advantage of using continuous values is that if the number of categories of directions to be estimated needs to be changed, a new labeling and learning process is required, whereas this is not necessary when using continuous values.
Figures 9 and 10 show the distribution of the position estimation error and the direction estimation error for each combination of RSSI preprocessing and moving direction handling, respectively. These correspond to conditions included in Figures 7 and 8 and also Tables 2 and 3. In these figures, the occurrences of the position estimation errors are plotted for every 0.1 m interval. The error in the direction of movement is plotted in 15° increments for continuous values, and in 45° increments for categorical values. The rather large increment for categorization was because we designed the categorization in these increments, while the continuous value treatment allows arbitrary intervals, for which we arbitrarily used bins in 15° increments for error analysis. From the results, we can see that the interpolation for both position and direction of movement estimation is stable with little error overall. In particular, when the direction of movement is treated as a continuous value and the RSSI values are interpolated, the position estimation error peaks in the range of 0.0 to 0.2 m, as shown in Fig. 9e. For the direction of movement, a peak can be seen in the range of 0 to 15°, as shown in Fig. 10e . This tendency is not seen in the extrapolation or unprocessed cases, indicating the effectiveness of interpolation. The large average position estimation error with extrapolation compared to unprocessed RSSI is probably due to the inaccuracy of RSSI calculation based on past data and the inability to remove RSSI variations by extrapolation alone. However, the extrapolation succeeded in slightly reducing the estimation error of the direction of movement. From these results, we conclude that interpolation is the best method out of the three tested for processing RSSI for both indoor position and direction of movement estimation.
4.2. Experiment B
The experimental results of Experiment B are shown in Figures 11 through 14, and Tables 5 and 6.
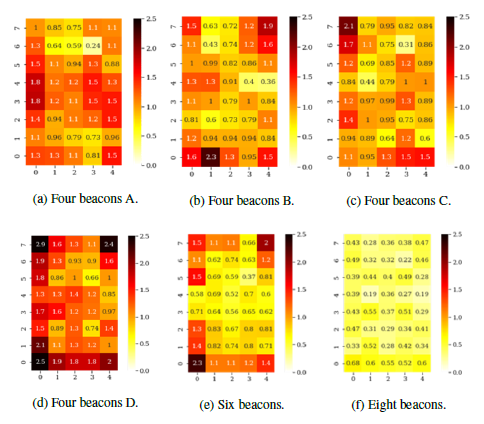
Figure 11: Position estimation error for experiment B.
Table 5: Average direction of movement estimation error with various beacon placement pattern.
| Direction | Average estimation error [ ° ] | |||
| (a) | (b) | (c) | (d) | |
| All | 38.93 | 36.18 | 36.56 | 47.94 |
| L | 38.06 | 35.31 | 32.21 | 39.65 |
| R | 36.82 | 44.22 | 43.03 | 35.17 |
| U | 46.98 | 36.56 | 37.11 | 83.21 |
| D | 42.01 | 37.12 | 47.06 | 48.26 |
| UL | 44.88 | 39.67 | 34.91 | 45.81 |
| LL | 35.49 | 37.44 | 34.85 | 40.98 |
| UR | 31.83 | 25.40 | 29.72 | 35.20 |
| LR | 38.70 | 33.24 | 34.82 | 63.49 |
Table 6: Average direction of movement estimation error vs. the number of beacons.
| Direction | Average estimation error [ ° ] | ||
| (d) | (e) | (f) | |
| All | 47.94 | 33.45 | 10.61 |
| L | 39.65 | 26.64 | 10.99 |
| R | 35.17 | 18.63 | 12.78 |
| U | 83.21 | 62.89 | 10.52 |
| D | 48.26 | 25.46 | 11.10 |
| UL | 45.81 | 32.36 | 3.13 |
| LL | 40.98 | 31.60 | 15.28 |
| UR | 35.20 | 29.99 | 9.34 |
| LR | 63.49 | 48.15 | 12.96 |
Figures 13a through 13d and 14a through 14d show the relationship between the position and direction estimation error and corresponding number of occurrences for the four beacon installation patterns (A, B, C, and D). These correspond to conditions in (a), (b), (c), and (d) in Figure 11 and Table 5. In these Figures, the position estimation error is plotted every 0.1 m, and the error in the direction of movement is plotted in 15° increments. In the case of four beacons used, we can see a large peak in the position estimation error distribution at less than 1 m in all patterns. However, the wide range and the multiple peaks of the estimation error distribution indicate that stable estimation is not possible. As for the moving direction estimation error, a peak can be seen around 15°, again in all patterns. We point out that beacon pattern D contains notable error occurrence distribution up to 180° compared to other patterns, in which the occurrences generally converge to a small number of instances at larger error values.
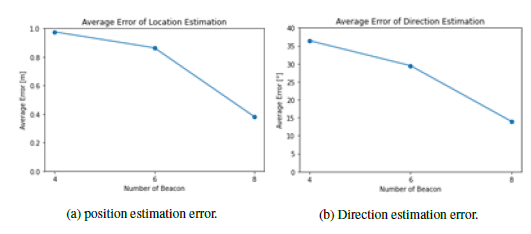
Figure 12: Position and direction estimation error vs. number of beacons
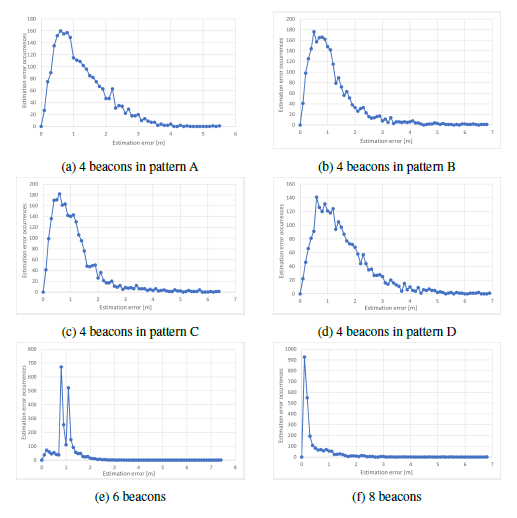
Figure 13: Position estimation error distribution by number of beacons and its placement.
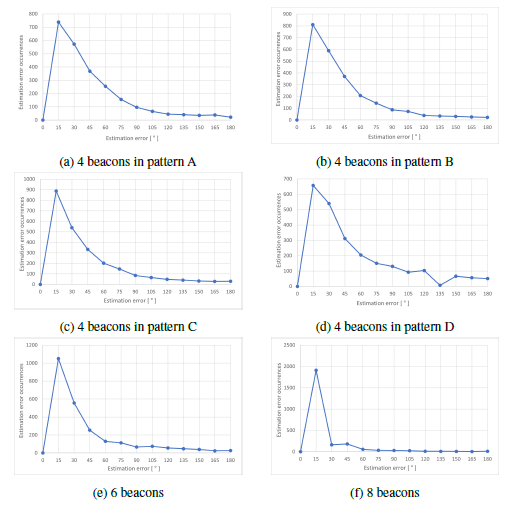
Figure 14: Direction estimation error distribution by number of beacons and its
Table 7: Comparison of average position estimation errors.
|
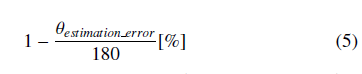
Figures 13d through 13f and 14d through 14f show the relationship between the estimation error and the corresponding number of occurrences with 4, 6, and 8 installed beacons. They correspond to conditions in (d), (e), and (f) in Figure 11 and Table 6. In terms of position estimation error, the distribution of estimation error is shown in a rather wide range, often showing a notable number of occurrences up to about 3 m with four beacons. In the case of six installed beacons, there are two large peaks close to 1 m. In the case of eight installed beacons, there is only one large peak close to 0 m. These seem to indicate that increasing the number of beacons contributes to stabilizing the position estimation. As for the error in the estimation of the direction of movement, the peak of the error generated is in the range of 0 to 15° for any number of beacons, but the large estimation error is reduced when the number of beacons is increased. In particular, when there are 8 beacons installed, the percentage of estimation errors of 45° or more for all directions of movement in the test data is 7.3%. We believe this is sufficient accuracy for the intended application of our system.
Table 6 also compares the estimation error of the direction of movement when the number of beacons is 4, 6, and 8. From this Table, we can see that the estimation error becomes smaller as the number of beacons increases, similar to the position estimation results. The estimation accuracy percentage can be calculated using
(5), where θestimation error [°] (0 ≤ θestimation error ≤ 180) is the angle estimation error.
θestimation error
From (5), the estimation accuracy of 4 beacons is 73.4%, that of 6 beacons is 81.4%, and that of 8 beacons is 94.1%. Therefore, the estimation accuracy of 8 beacons is 20.7% higher than that of 4 beacons. From the above results, we can say that increasing the number of beacons contributes significantly to the improvement of stable estimation accuracy, both in terms of position and motion direction. Thus, for a room with a size similar to the one in this study, the average value of the position estimation error can be expected to be well below 1 m, and the average movement direction estimation error can be expected to be around 10° if 8 beacons are used, which can both be considered to be sufficient accuracy for practical indoor navigation.
Although it is quite difficult to compare estimation results with other schemes since they will differ in terms of conditions (room size, number of APs/beacons and their placement, etc.), we have summarized the position estimation error comparison in Table 7. From this table, it seems safe to say that the proposed system achieves comparable or better estimation accuracy compared to the other similar methods. There is no data on movement direction estimation accuracy to compare with the proposed method, however.
5. Conclusion
In this study, we investigated an indoor position and direction estimation system consisting of a smartphone and BLE beacons. The RSSI measurements of multiple BLE beacons were fed into a DNN model that estimated both position and direction of movement simultaneously. Multiple time instances of the RSSI of the BLE beacons were used for the estimation. The post-processing of the RSSI of the BLE beacons and the number of beacons required for accurate estimation were considered. The results showed that temporal interpolation is the most effective post-processing of RSSIs before using them as input data for DNN models. In particular, interpolation contributes to the stabilization of the accuracy of the estimation of the direction of movement. Eight beacons in a space of 5 m × 8 m resulted in an average position estimation error of 0.330 m for all grid positions in this room, and a total error of 10.61° in the estimation of the direction of movement. We believe this is one of the most accurate estimations even among methods that rely on fingerprints. We also showed that the estimation of the direction of movement should be treated as a continuous value to increase the accuracy of the direction of movement estimation. Regarding the placement pattern and the number of beacons required, we confirmed that sparsely and evenly distributed beacons and a sufficient number of beacons contribute to stable estimation. In the measurement tested room, when 8 beacons were installed, the percentage of estimation errors of 45° or more for all directions of movement in the test data was 7.3%, significantly less than with a smaller number of beacons. With this level of accuracy, we believe that the system can be applied to actual indoor navigation systems.
In this experiment, we measured RSSIs with no obstacles in the surroundings. However, when we consider actual usage scenarios, objects and people in the room often become obstacles. Since we used multiple RSSI sequences to train the DNN model, the models may be able to handle some deviation in the RSSI measurements due to object placement owing to the generalization capabilities of the DNN. However, some form of reinforced learning will become necessary to handle an extensive amount of deviations due to the introduction of obstacles. This is currently out of the scope of this paper but is planned to be investigated in the future. We also assume the system to be used on the same floor and thus assume that the z-axis values are fixed. Multiple floor navigation systems will be investigated in the future as well.
Additionally, all user paths modeled in this work were simple straight paths at constant speeds. We would like to further expand our model to handle more complex paths, consisting of different direction and speed combinations.
Conflict of Interest
The authors declare no conflict of interest.
Acknowledgment
The authors would like to thank the members of the Kondo Laboratory for their useful discussions.
- H.G. Shin, Y.-H. Choi, C.-P. Yoon, “Movement Path Data Generation from Wi-Fi Fingerprints for Recurrent Neural Networks,” Sensors, 21(8), 2021, doi:https://doi.org/10.3390/s21082823.
- S. H. Marakkalage, B. P. L. Lau, Y. Zhou, L. Ran, C. Yuen, W. Q. Yow, K. H. Chong, “WiFi Fingerprint Clustering for Urban Mobility Analysis,” IEEE Access, 9, 69527–69538, 2021, doi:https://doi.org/10.1109/ACCESS.2021.3077583.
- Z. E. Khatab, A. Hajihoseini, S. A. Ghorashi, “A Fingerprint Method for In- door Localization Using Autoencoder Based Deep Extreme Learning Machine,” Sensors, 2(1), 2018, doi:https://doi.org/1109/LSENS.2017.2787651.
- M. Abbas, M. Elhamshary, H. Rizk, “WiDeep: WiFi-based Accurate and Ro- bust Indoor Localization System using Deep Learning,” in IEEE International Conference on Pervasive Computing and Communication, Kyoto, Japan, 2019, doi:https://doi.org/10.1109/PERCOM.2019.8767421.
- X. Wang, L. Gao, S. Mao, S. Pandey, “CSI-based Fingerprinting for Indoor Lo- calization : A Deep Learning Approach,” IEEE Transactions on Vehicular Tech- nology, 66(1), 763–776, 2017, doi:https://doi.org/10.1109/TVT.2016.2545523.
- C. Takahashi, K. Kondo, “Indoor Positioning Method for Augmented Au- dio Reality Using iBeacons,” in 2015 IEEE Global Conference on Con- sumer Electronics (GCCE 2015), 468–469, Osaka, Japan, 2015, doi:https://doi.org/10.1109/GCCE.2015.7398636.
- C. Takahashi, K. Kondo, “Accuracy Evaluations of an Indoor Position- ing Method Using iBeacons,” in 2016 IEEE Global Confer-ence on Con- sumer Electronics (GCCE 2016), 425–426, Kyoto, Japan, 2016, doi:https://doi.org/10.1109/GCCE.2016.7800465.
- X. Zhao, Z. Xiao, A. Markham, N. Trigoni, Y. Ren, “Does BTLE measure up againstWiFi? A comparison of indoor location performance,” in European Wireless 2014, 263–268, Barcelona, Spain, 2014.
- Z. Chen, H. Zou, H. Jiang, Q. Zhu, Y. Soh, L. Xie, “Fusion of WiFi, Smart- phone Sensors and Landmarks Using the Kalman Filter for Indoor Localization,” Sensors, 15(1), 715–732, 2015, doi:https://doi.org/10.3390/s150100715.
- H. Yanagimoto, K. Hashimoto, T. Matsuo, “Indoor Positioning Estimatio Us- ing BLE Beacons,” in The 13th International Joint Symposium on Artificial Intelligence and Natural Language Processing (iSAI-NLP 2018), 124–128, Pattaya, Thailand, 2018.
- J. Paek, J. Ko, H. Shin, “A Measurement Study of BLE iBeacon and Geometric Adjustment Scheme for Indoor Location-Based Mobile Applications,” Mobile Information Systems, 2016, 2016, doi:https://doi.org/10.1155/2016/8367638.
- K. Echizenya, K. Kondo, “Estimation of indoor position and motion direction for smartphones using DNN to BLE beacon signal strength,” in 2020 IEEE International Conference on Consumer Electronics Taiwan, (ICCE-TW), Taoyuan, Taiwan, 2020, doi:https://doi.org/10.1109/ICCE-Taiwan49838.2020. 9258282.
- K. Echizenya, K. Kondo, “The Effect of Density and Placement of BLE Bea- cons on Indoor Location and Motion Direction Estimation Accuracy,” in 2021 Asia-Pacific Signal and Information Processing Association Annual Summit and Conference (APSIPA-ASC), APSIPA, Tokyo, Japan, 2021.
- T. Kitagawa, K. Kondo, “Evaluation of a Visually Handicapped Navigation System Using 3D Audio on a Smartphone under Realistic Conditions,” in 2018 IEEE Global Conference on Consumer Electronics (GCCE 2018), 467–468, Nara, Japan, 2018, doi:https://doi.org/10.1109/GCCE.2018.8574718.
- K. Tasaki, T. Takahashi, S. Ibi, S. Sampei, “3D Convolutional Neural Network- Aided Indoor Positioning Based on Fingerprints of BLE RSSI.” in 2020 Asia- Pacific Signal and Information Processing Association Annual Summit and Conference (APSIPA-ASC), Auckland, New Zealand, 2020.
- Z. Chen, Q. Zhu, H. Jiang, H. Zou, Y. Soh, L. Xie, R. Jia, C. Spanos, “An iBeacon Assisted Indoor Localization and Tracking System,” in The 14th In- ternational Conference on Information Processing in Sensor Networks (IPSN ’15), Seattle, WA, USA, 2015.
- Mathworks, “Piecewise Cubic Hermite Interpolating Polynomial (PCHIP),” https://www.mathworks.com/help/matlab/ref/pchip.html.
- F. N. Fritsch, R. E. Carlson, “Monotone Peicewise Cubic Interpolation,” SIAM Journal of Numerical Analysis, 17, 238–246, 1980, doi:https://doi.org/10.1137/ 0717021.
- Mathworks, “Cubic spline data interpolation (spline),” https://www.mathworks.com/help/matlab/ref/spline.html.
- M. Hadwan, R. U. Khan, K. I. M. Abuzanouneh, Towards a Smart Campus for Qassim University: An Investigation of Indoor Navigation System, vol- ume 5 of Advances in Science, Technology and Engineering Systems Journal, Springer-Verlag, 2020, doi:10.25046/aj050699.
- J. Paek, J. Ko, H. Shin, “A Measurement Study of BLE iBeacon and Geometric Adjustment Scheme for Indoor Location-Based Mobile Applications,” Mobile Information Systems, 2016, 2016, doi:https://doi.org/10.1155/2016/8367638.
- K. Echizenya, K. Kondo, “Estimation of indoor position and motion direc- tion for smartphones using DNN to BLE beacon signal strength,” in 2020 IEEE International Conference on Consumer Electronics Taiwan, (ICCE-TW), Taoyuan, Taiwan, 2020, doi:https://doi.org/10.1109/ICCE-Taiwan49838.2020. 9258282.
- K. Echizenya, K. Kondo, “Comparison of RSSI Processing Methods for Improved Estimation Accuracy in BLE Indoor Position and Movement Es- timation System Using DNN,” in 2021 IEEE Global Conference on Con- sumer Electronics (GCCE 2021), 171–172, IEEE, Kyoto, Japan, 2021, doi: https://doi.org/10.1109/GCCE53005.2021.9622021.
- K. Echizenya, K. Kondo, “The Effect of Density and Placement of BLE Bea- cons on Indoor Location and Motion Direction Estimation Accuracy,” in 2021 Asia-Pacific Signal and Information Processing Association Annual Summit and Conference (APSIPA-ASC), APSIPA, Tokyo, Japan, 2021.
- T. Kitagawa, K. Kondo, “Evaluation of a Visually Handicapped Navigation System Using 3D Audio on a Smartphone under Realistic Conditions,” in 2018 IEEE Global Conference on Consumer Electronics (GCCE 2018), 467–468, Nara, Japan, 2018, doi:https://doi.org/10.1109/GCCE.2018.8574718.
- K. Tasaki, T. Takahashi, S. Ibi, S. Sampei, “3D Convolutional Neural Network- Aided Indoor Positioning Based on Fingerprints of BLE RSSI.” in 2020 Asia- Pacific Signal and Information Processing Association Annual Summit and Conference (APSIPA-ASC), Auckland, New Zealand, 2020.
- Z. Chen, Q. Zhu, H. Jiang, H. Zou, Y. Soh, L. Xie, R. Jia, C. Spanos, “An iBeacon Assisted Indoor Localization and Tracking System,” in The 14th In- ternational Conference on Information Processing in Sensor Networks (IPSN ’15), Seattle, WA, USA, 2015.
- Mathworks, “Piecewise Cubic Hermite Interpolating Polynomial (PCHIP),” https://www.mathworks.com/help/matlab/ref/pchip.html.
- F. N. Fritsch, R. E. Carlson, “Monotone Peicewise Cubic Interpolation,” SIAM Journal of Numerical Analysis, 17, 238–246, 1980, doi:https://doi.org/10.1137/ 0717021.
- Mathworks, “Cubic spline data interpolation (spline),” https://www.mathworks.com/help/matlab/ref/spline.html.
- C. de Boor, A Practical Guide to Splines, Applied Mathematical Sciences, Springer-Verlag, 1978.