Design of an Off-Grid Hybrid Energy System for Electrification of a Remote Region: a Case Study of Upper Blink Water Community, South Africa

Adv. Sci. Technol. Eng. Syst. J. 7(5), 17–26 (2022);
 DOI: 10.25046/aj070503
Electrifying or connecting remote and isolated communities to the national grid is very difficult and expensive. This challenge is due to the geographic locations of these isolated communities and terrain that needs navigation when installing transmission lines to transmit power to the communities. This article presents a case study of the design of a hybrid energy system for electrification of a remote region in South Africa. Upper blink water is about 20km away from the national grid. An effort has been made to design hybrid energy system which consists of solar photovoltaic (PV), diesel generator and battery storage. Homer software used to evaluate the technical characteristics and efficiency of the proposed hybrid energy system. Reticmaster software used to calculate the voltage drops of distribution lines to the residential houses of the communities. The results show that it is feasible to supply the isolated community with the proposed hybrid energy system. The average electricity cost is R1.1093c/kWh and the amount of diesel fuel per year is 16685L/year.
1. Introduction.
This article comes as results of previously presented and an extension of a paper originally presented in the IEEEAFRICON 2021 conference [1]. Electrical Energy is among of the most vital resources in the world and its usefulness across the globe cannot be emphasised. The use of electricity is widespread in manufacturing, telecommunication, many other field such as residential and commercially[1]. Electricity can be produce by variety of sources including nuclear, hydro, wind solar, and thermal. Electricity can be classified into two main groups namely, sources of non-renewable energy and renewable energy. The demand for energy across the world is constantly rising. The increase of energy demand is a result of population growth, economic development and the introduction of many electrical appliances. In addition, the cost of power generation, availability of resources, environmental effects, and other factors have brought many challenges to provision of electricity to many communities in the world [2]. Electrification of remote and isolated communities is a significant issue when discussing future energy access in a country[3]. South Africa has an average of 89% grid access in 2016, with renewable energy sources contributing 11%[4]. According to the 2016 statistics, coal accounted for 69 percent of South Africa’s primary energy supply. Crude oil had a 14 percent share, nuclear had a 3% share and natural gas had a 3% share of the industry[4]. Many communities have been given access to electricity through South African government programs, among other programs; through private sector investments in wind energy, small hydro and biomass[4]. Off-grid hybrid energy systems has gained a lot of popularity due to its ability to operate in remote areas where the conventional grid cannot be access. In most cases, storage units used to complement the intermittent power generation from renewable energy sources such as solar and wind. Several research studies been carried out to ascertain the feasibility of hybrid energy systems in providing electricity to remote regions [3]. Modelling and cost analysis of a hybrid energy system for a remote island in Bangladesh – St. Martin Island were done using HOMER software [5]. The proposed hybrid energy system consists of solar PV, wind turbine and diesel generator. HOMER software is used to determine the most cost effective configurations among a set of system options for electricity requirement of 53 kWh/day primary load with 10 kW peak load[5]. The results from the analysis showed that the proposed hybrid energy system gives a cost of electricity COE of USD 0.224 and a total net present cost (NPC) of USD60, 832.93. The renewable power generation contribution to the total electricity requirement for the island is 77 percent. Another case study been done for a health clinic in a rural area in southern Iraq[6]. HOMER software used to estimate the system size and its life cycle cost. The total daily load of the health clinic is 31.6 kWh. The analysis showed that the optimal system initial cost, net present cost, and electricity cost is US$50,700, US$60,375, and US$0.238/kWh, respectively [6]. Based on the literature reviews, the Homer software been adopted in this paper to analyse the feasibility of the proposed hybrid energy system. The analysis of the voltage drop for transmitting the power to the community residential houses conducted using Reticmaster software. Upper blink water is the community selected as a case study for design of hybrid energy system. It is located in Fort Beaufort, Eastern Cape, South Africa consisting of 43 households and is about 20km away from the national grid.
2. Case study description.
2.1. Weather and Location.
The community of Upper Blink Water is located about 20 kilometres from the national power grid. Because electricity is scarce in Upper Blink Water, an alternative energy sources required. This area considered one of the sunniest in the Eastern Cape Province. This community reached using GPS coordinates of latitude: -32034’0.01”, longitude: 26032’60’’. Figure 1 shows the temperature range in Upper Blink Water community area. It varies between 2.6°C and 31.8°C with a median temperature of 17.5°C based on the long-term average. This data obtained from NASA (National Aeronautics and Administration) Perdition of Worldwide Energy Resource Power database[7].
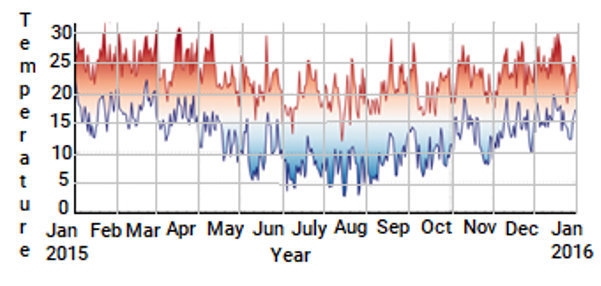
Figure 1: Ambient Temperatures throughout year.
Table 1 and Figure 2 shows the solar radiation for the considered area. The area experiences annual average radiation of 6.33 kWh/m²/d. and daily solar energy yield ranges between 2.5 kWh/m²/d and 8.8 kWh/m²/d. The highest solar radiation occurs during the summer season between Jan –Apr and Aug-Dec. The lowest solar radiation experienced during the winter season between May-July. The monthly average solar radiation data was taken from NASA (National Aeronautics and Administration) Perdition of Worldwide Energy Resource Power database[7].
Table 1: Upper Blink Water Community average solar radiation
| Month | Clearness Index | Daily Radiation (kWh/m2/day) |
| Jan | 0.74 | 8.8 |
| Feb | 0.71 | 7.8 |
| Mar | 0.81 | 7.5 |
| Apr | 0.90 | 6.5 |
| May | 0.72 | 4.0 |
| Jun | 0.54 | 2.6 |
| Jul | 0.50 | 2.5 |
| Aug | 0.47 | 3.5 |
| Sep | 0.82 | 6.9 |
| Oct | 0.73 | 7.5 |
| Nov | 0.71 | 7.7 |
| Dec | 0.73 | 8.7 |
2.2. Load Model
Upper Blink Water community expected load shown in Table 2. Lights, cookers, and entertainment expected to be use by the community. The author collected data through site visits, interviews with community members, and questionnaires. Table 2 and Figure 2 summarize the results. Table 2 shows the community expected load. The details of the interviews and questionnaires not detailed in this article.
In Figure 3, all the households in the community are show with their load profiles. A peak load of 13.1kW estimated for the evening. This load expected as many people will go home after returning from work, and they will use electricity to warm the water for bath and to cook.
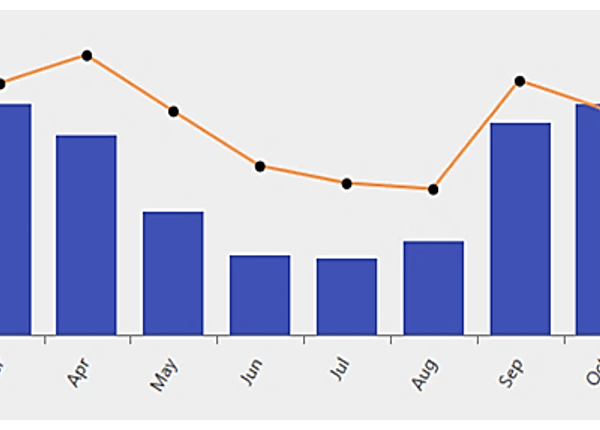
Figure 2: Monthly Average Solar Irradiance
Table 2: Expected usage of Electricity by Upper Blink water community.
| Load of the Community | Peak load (W) | Average Load(W) | |
| Lighting | LED lights | 7W | 7W |
| Entertainment | TV/Video/Satellite | 120W | 120W |
| Radio | 20W | 20W | |
| Laptop | 50W | 50W | |
| Smart Phone Charger | 1W | 1W | |
| Cooking | Stove (4 plate) | 3000W | 1500W |
| Stove(2 plate) | 2000W | 1000W | |
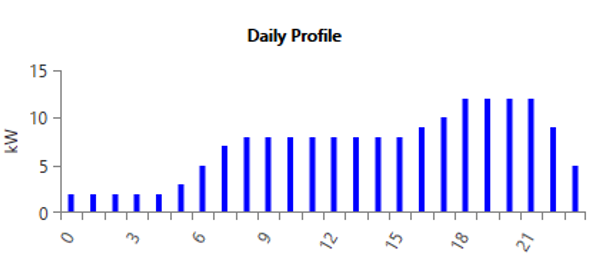
Figure 3: Load Profile for the case study.
3. Proposed Energy System Design configuration.
The HOMER software, NREL’s micro-power optimization model is employed to evaluate a range of equipment options over varying constraints to optimize the proposed hybrid energy system[8]. It gives a list of feasible system configuration options that are rank according to their cost effectiveness. Figure 4 shows a schematic block diagram for the proposed hybrid energy system.
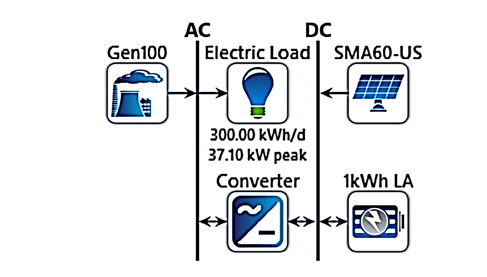
Figure 4: System Design Configuration for Upper Blink water.
3.1. System components Description
The following are the major components of the proposed hybrid energy system:
- Photovoltaic Cells (SMA60 – US) PVs are the primary power converters. Solar energy converted into electricity using semiconductors. A photovoltaic cell usually produces only one or two watts of power, which is quite small. When photovoltaic cells connected together, they produce more power. These units are called modules. Each module connected to other modules to form large units known as panels and arrays. A polycrystalline panel was considered for this research study. The efficiency of polycrystalline panels is very high. It is necessary to use a bypass diode (Schottky diode) between the battery bank and the panels to protect them from reverse current. Table 3 shows the polycrystalline solar PV cells specifications used in this paper
Table 3: Solar panel specifications[9].
| Electrical Characteristics at Standard Test Conditions (STC). | ||
| Module Type: TW P -72
Peak Power Watts-Pm[W] Open Circuit Voltage-Voc[V] Short Circuit Currents Isc[A] Maximum Power Voltage -Vm [V] Maximum Power Current- Im [A] Module efficiency [%] |
325
325 45.6 9.28 37.1
16.8 |
Solar panel |
| Electrical Characteristics at Normal Operating Cell Temperature (NOCT) | ||
| Peak Power Watts-Pm [W]
Open Circuit Voltage-Voc [V] Short Circuit Currents Isc [A] Maximum Power Voltage -Vm [V] Maximum Power Current- Im [A]
|
225
41.4 7.26 33.4
6.74 |
Solar Array |
| “Note1. Standard Test Conditions (STC): irradiation 1000W/m2
AM1:5: ambient temperature 250C according to EN 60904-3; 2. Nominal Operating Cell Temperature (NOCT): Irradiance 800W/m2; Wind speed 1m/s; cell temperature 450C; ambient temperature 200C. Tolerance of Pm 0-+5%, Measuring uncertainty of power +-3%, Performance deviation of Voc [V], Isc[A],Vm [V] and Im [A]:+-5%” |
||
- Battery Bank (315kWh LA): The solar panels generate excess electricity that is stored in the battery. This research study utilized flooded lead acid batteries because they have a long lifespan and are inexpensive per amp hour. During the day, excess energy generated by the solar panels charges the batteries. The battery storage will discharged at night and in the early morning when the sun is not out, providing electricity to the community load.The batteries were set to a state of charge (SOC) of 30% and 90%, respectively. A combination of these settings prevents deep discharges and overcharging of the batteries respectively.
- Charge Controller: Charge controllers manage the current flowing between the batteries and the panels. The purpose of this device is to prevent battery overcharging. A charge controller usually includes special electronics that level out the charging process automatically[4]. Batteries are prevented from being overcharged by charge controllers that block reverse current. The MPPT charge controller is selected for this research study since it uses a multiple stage charge method based on the PV conditions[10].
- Inverter (Converter): By using an inverter, DC electricity can be converted to AC electricity. An inverter converts DC voltage from solar panels to AC voltage. An inverter classified according to the format of its output wave, its output power, and its type of installation. Since an inverter changes the form of electricity, sometimes referred to as a power conditioner. Modified sine waves (MSWs) or pure sine waves are both possible output waveforms of an inverter[11]. The use of MSW inverters is usually more economical and efficient than sine wave inverters, while sine wave inverters offer higher performance and can operate on virtually any load. Sunny Central Technologies’ MSW inverters were selected because they have a maximum power point tracking capability (MPPT) and utility fault protection capabilities[6]. Depending on the system voltage and output voltage requirements, inverted systems with 400V AC 3-phase and 230V AC single-phase output voltages selected.
4. Proposed Energy System Sizing.
4.1. Solar PV Module sizing.
When sizing the solar panels the total daily energy (E), the average sunny hours per day, and the system voltage (Vdc) are used. A tool called the Distribution Pre electrification Tool (PET) is used to predict community electricity consumption and demand for a 15-year period[12]. This research study used 1,29kVA of After Diversity Maximum Demand (ADMD) power and 300 kWh of total load in its research. An ADMD calculated based on the government-specified income for a rural village in South Africa. Using 1.2kVA ADMD per household with a circuit breaker size of 20 Amps, a household income of R1500 per month would equal a Government pension rate of R1500 per month[12].
According to Figures 5 and 6, the site expected to have a maximum demand for electricity and electric consumption.
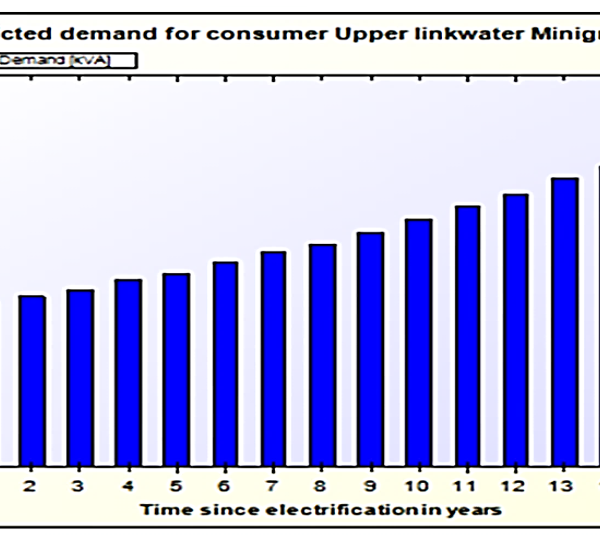
Figure 5: 15-year period-predicted electricity demand by the community[12].
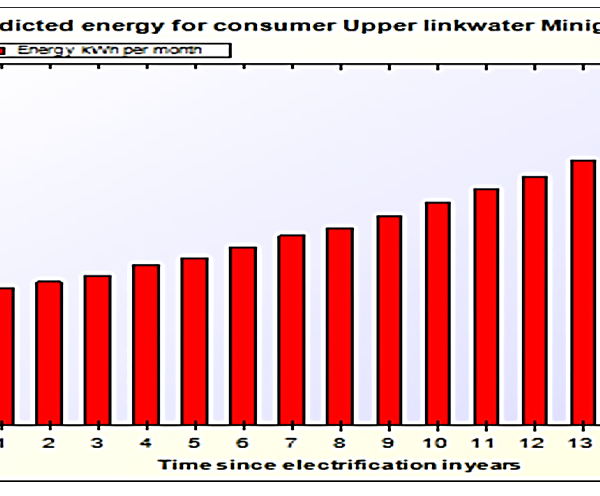
Figure 6: 15-year period-predicted electricity usage by the community[12].
Equations (1) – (5) are required to calculate the PV array (WP) and the maximum power required to operate the solar module.
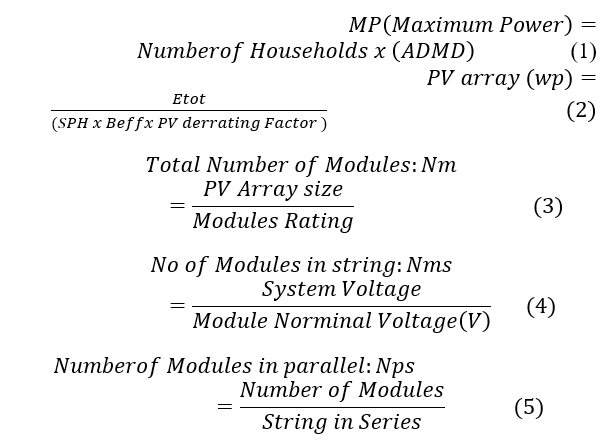
where: Etot: Total energy Demand (Wh/d) = 300 kWh.
SPH: Solar Peak Hour (h/d) =6.3
Beff: Battery efficiency (%) = 80%
PV der: PV derating factor (percentage) = 80%
4.2. Sizing of battery bank.
Batteries arranged into battery banks according to their voltage ratings and the needs of the system, which may be in series or parallel. The voltage of the battery usually chosen based on the energy system and the load. Batteries power photovoltaic systems connected to the grid. They are used as backup power supply during times when there is no sunshine. 12V battery voltage selected for this proposed hybrid energy system. Equations (6) – (10) are required to calculate the battery size and number of battery required for the system.
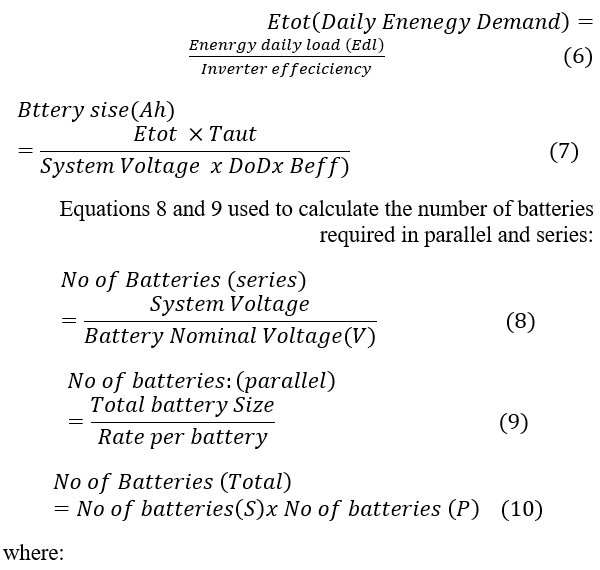
Etot (WH) =Daily energy demand
Beff: =Battery efficient typically: 80%
VBB =Battery nominal voltage: 2VDC
DOD= Depth of discharge: 80%
Taut: =Number of days of autonomy: two.
Selected Battery Ah Rating = 1500 Ah
Selected system voltage = 360 VDC
Since the system, voltage is 360VDC, the number of 12 volts batteries required in series is:
4.3. Sizing of inverter (converter).
An inverter converts DC voltage from solar panels to AC voltage. An inverter classified according to the format of its output wave, its output power, and its type of installation. Since an inverter changes the form of electricity sometimes referred to as a power conditioner. Modified sine waves (MSWs) or pure sine waves are both possible output waveforms of an inverter. The use of MSW inverters is usually more economical and efficient than sine wave inverters, while sine wave inverters offer higher performance and can operate on virtually any load. Sunny Central Technologies’ MSW inverters were selected because they have a maximum power point tracking capability (MPPT) and utility fault protection capabilities[6]. Depending on the system voltage and output, voltage requirements, inverted systems with 400V AC 3-phase and 230V AC single-phase output voltages are selected.The inverter selected based on the following characteristics:
- Must have a D.C input voltage of between 240V and480V to minimize cable sizes.
- Must have efficiency at full load of above 95% tominimize losses.
- Must have the ability to perform maximum power point tracking to minimize the number of panelsMust have an in-built battery charging features.
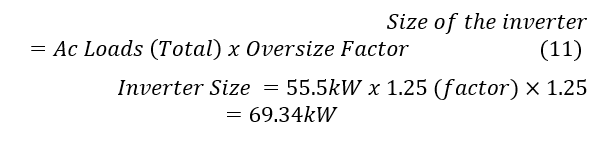
The inverter size is determined as follows:
An oversize factor of 1.25 is normally used in the sizing of an inverter for any energy system. In the case of an unexpected increase in load, the oversize factor is applied, otherwise if the actual calculated size of the inverter is used it will overheat and/or burn due to current flow increase. The size of inverter chosen for each phase is 30 kW.
4.4. Backup Generator.
Diesel generators are also essential components of a hybrid energy system. Using different energy sources, power generators generate electricity by converting the motion of combustion engines into kinetic energy. The diesel generators (back up) selected according to their maximum power and voltage requirements. The backup generator used if the PV power generation system cannot meet the entire load.
The backup generator should have the ability to operate independently for at least a few days, providing enough energy until reaching its maximum output power. This is necessary especially during days when the sun is not shining. The backup generator selected based on the maximum power required and on the loading voltage required. The backup generator used to supply the load during the time when PV power generation supply is not able to supply the entire load. A diesel generator of 80 kW used in the case study. The backup generator is connected to the ac bus of the proposed hybrid energy system. Minimum output of the generator is set at 25 kW. The back-up generator should be able to run at least 2 days independently and supply the necessary power up to its maximum power output. Table 4 shows the specifications of the backup generator used in the case study.
Table 4: Back-up generator specifications.
| Quantity | Value | Units |
| Electrical Production | 13,677 | kW |
| Minimum Electrical Output | 25.0 | kW |
| Maximum Electrical Output | 67.2 | kW |
| Fuel consumption | 14,992 | L |
| Specific Fuel consumption | 0.365 | L/kWh |
| Fuel Energy Input | 49,120 | kWh/year |
| Mean electrical Efficiency | 31.1 | % |
| Hours of operation | 547 | hrs./year |
| Number of starts | 389 | starts/year |
| Operational life | 27.4 | Yr. |
| Capacity Factor | 1.56 | % |
| Fixed generation cost | 58.8 | R/hr. |
| Marginal generation cost | 4.87 | R/kWh |
4.5. Reticulation Simulation.
Reticmaster is a network analysis tool, which used to calculate voltage drops, sizing cables and calculating fault currents. The Low Voltage reticulation design chosen in this proposed design based on Eskom specifications for Low Voltage reticulation. This done in order to determine the line lengths and conductor sizes to cover the area. The distribution system consists of two main lines leaving the supply side of the proposed hybrid energy system. The total length of the distribution lines is about 2 km including minor connecting lines. All distribution lines need to fulfil Eskom standards. The electrical grounding is facilitated at the community houses. The number of connected houses is 43 households. Table 5 shows the length of the distribution lines and the number of community houses connected.
Table 5: Length of Distribution Lines.
| Northern lines | |
| Main line length | 741 m |
| Line 1 | 114 m |
| Line 2 | 120 m |
| Line 3 | 100 m |
| Line 4 | 270 m |
| Line 5 | 82 m |
| Line 6 | 55 m |
| Number of Households connected | 28 |
| Southern Lines | |
| Main line length | 595 m |
| Number of connections | 15 |
| Total length of Distribution lines | 1 336 m |
| Total number of connections | 43 |
Figure 8 shows a snapshot of part of the reticulation design using Reticmaster software.
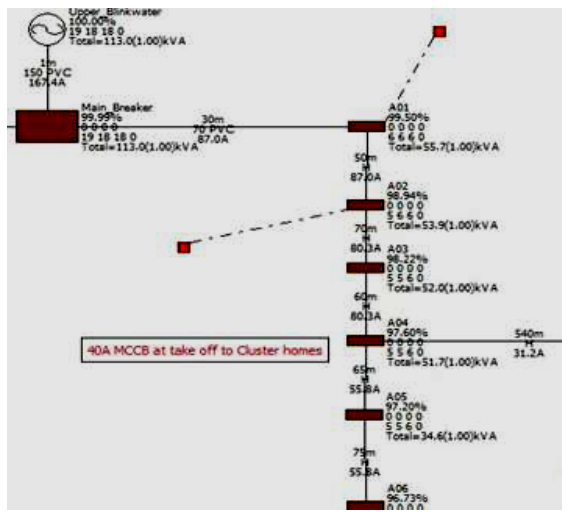
Figure 7: Low Voltage simulation using Reticmaster
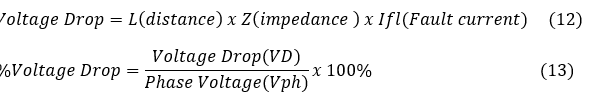
Due to the layout and spread of the village, the Low Voltage lines are longer and therefore thicker conductors used so that the voltage profiles are within the statutory limits. Equations (12) and (13) used to calculate the voltage drops, sizing cables and calculating fault currents.
5. Results and Discussions.
The analyses and results generated or obtained from the HOMER and Reticmaster software for this proposed system. The objective is to get the lowest cost per kWh and the lowest NPC of an off-grid hybrid energy system. Table 6 and 7 optimization results and optimal least cost off-grid hybrid energy system for Upper Blink-water.
Table 6: Optimization Results for the research study.
| Power Generation components (Mix) | Total Net Present Cost
(NPC) |
Cost of Electricity (COE) | Renewable fraction (%) |
| Solar PV/ Diesel Gen Battery/Inverter | R1.68M | 1.23 | 87.2 |
Table 7: Optimal least cost off-grid hybrid energy system for Upper Blink-water
| Cost Summary | System Architecture | Electrical | ||||
| Total NPC | R1.68M | PV Array | 60kW | Components | Production | Fraction (%) |
| Levelized
COE |
R1.23/kWh | Diesel Generator | 100kW | PV Array | 127,475kWh/yr | 90.3 |
| Operation Cost | R113.15 | Batteries | 180x 12V strings | Diesel Generator | 13,677kWh/yr | 9.69 |
| Inverter | 30kW | Total | 141.152kWh/yr | 100 | ||
| Rectifier | 30kW | |||||
| Dispatch
Strategy |
Homer Cycle Charging | |||||
The annual PV power production is 127 475 kWh/yr. Figure 7 shows the PV power output for the whole year. It can be clearly seen that during the winter period between May – July the PV power output is lowest. This is because of the low solar radiation experienced during this period. In summer, period between the months of September – April the solar radiation is high and thus high PV power output experienced during this period.
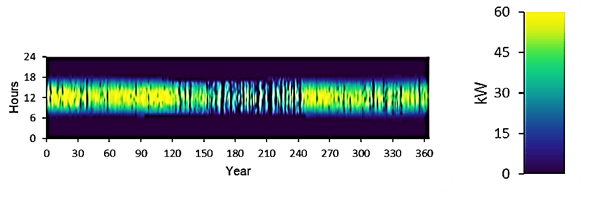
Figure 8: PV Power Output.
The total amount of electricity produced by the hybrid energy system in a given year. Figure 8 shows the electrical production proposed model. The total electrical production calculated is 141,152kWh/y.
The annual throughput of the battery bank is 56,509 kWh/y. Figure 8 shows the state of charge of the battery bank for the whole year. The graph shows that the state of charge of the battery bank is higher during summer season than in the winter period. This is because during the summer season the PV power out is very high and is able to supply the whole community load and the excess power used to charge the batteries.
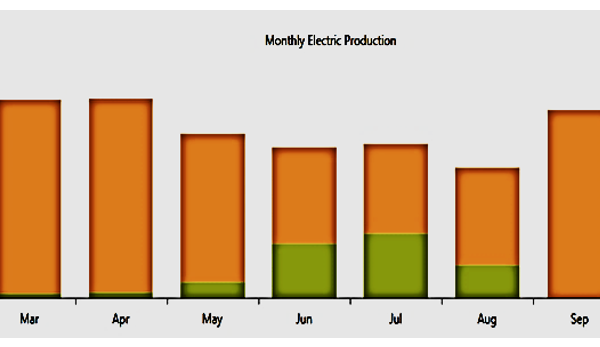
Figure 9: Electrical production for the proposed model.
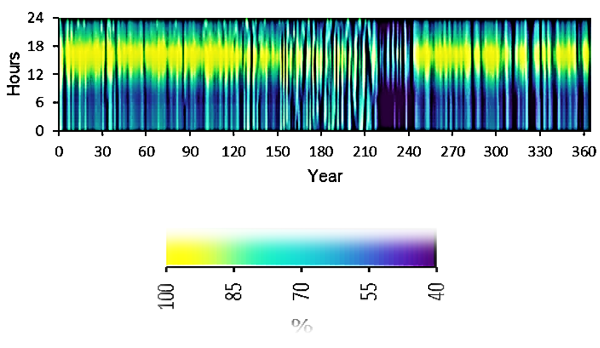
Figure 10: Battery State of charge.
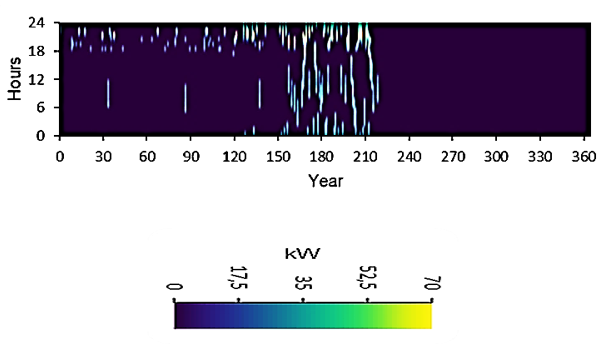
Figure 11: Generator Power Output.
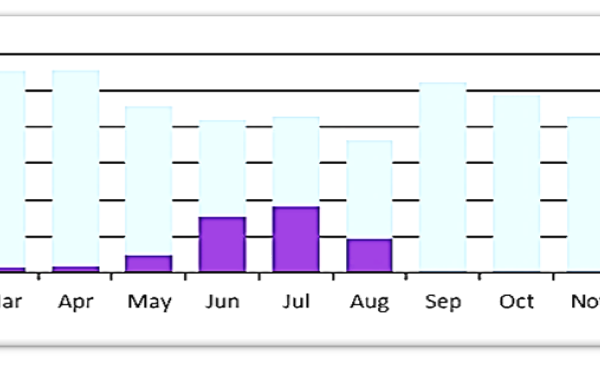
Figure 12: Energy balance of the hybrid energy system.
Figure 10 below shows the operation of the back-up generator. It is clear from the graph that the backup generator operated frequently during the winter period than in the summer period. The total number of hours of operation of the backup generator is 547 hours per year and it has 389 start-ups for the whole year. The total amount of fuel that is used by the generator is 4992 litres of diesel per year.
During the winter period between May and August shows that the PV power generation and the generator power is sometimes not adequate to supply the whole load. This indicated as energy not supplied in Figure 11. This means the operator of the hybrid energy system would have to load shed some of the community load. The shortage in electricity production by the PV generation unit is because of the low solar radiation that is experienced during the respective time. The PV power generation unit supplied 90.4% and the diesel generator only supplied 7.89 % of the total annual load for the community. The most expensive system configuration option is when only the diesel generator used to supply the total load.
Figure 12 shows the voltage drops for the different distribution lines that feeds power to the community houses. From the graph, shows that between the distances of 0 m – 156 m the maximum voltage drop is 4 %. The voltage drop increased as the length of the distribution line increases. A maximum voltage drop of 9 % occurs at a distance between 780m – 1560m.
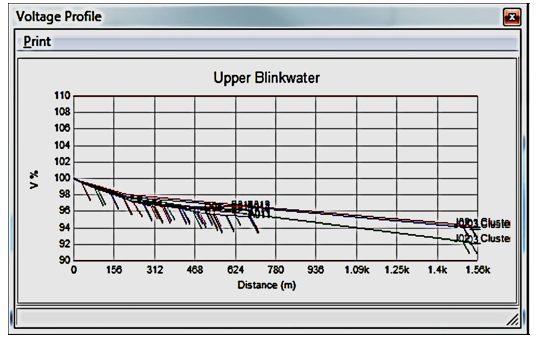
Figure 13: Voltage drops (%) vs Distance (m).
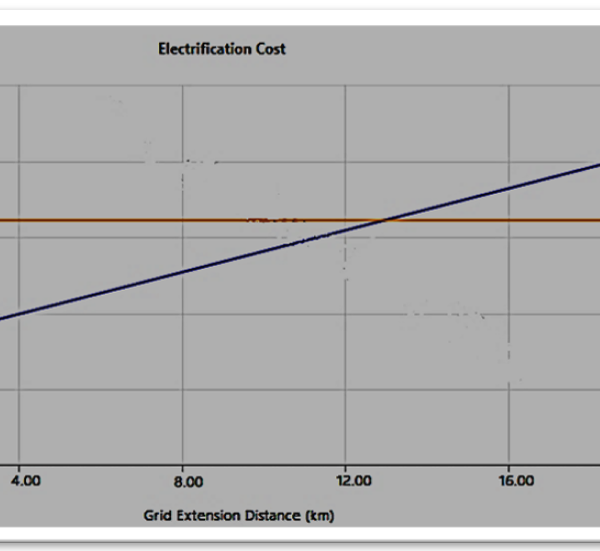
Figure 14: The breakeven distance for grid extension for proposed Upper Blink Water off grid.
When comparing grid extensions and off-grid hybrid energy systems is possible with the Grid Extension. An off-grid energy system was considered more appropriate during this research study than a grid extension. Upper Blink Water community is estimated to have an ICC (initial capital cost) of R22 000/km for the extension of the national grid. The annul O&M (operational and maintenance) cost examined is R8000/km and national grid power, power price is R0.107/kWh. Figure 14 present the results of break-even analysis showing the proposed hybrid energy system and grid extension for the electrification of Upper Blink Water. According to this figure 14, the breakeven grid extension distance is 12.2 km, which display that the designed stand-alone hybrid energy system is more cost effective than the grid extension as the nearest transformer from Upper linkwater is located 20 km away.
6. Conclusion
This article present a design of a hybrid energy system for a remote region as a case study. The main goal was to determine if solar PV could be used as an energy source for Upper Blink Water community in a reliable and cost-effective way. After many simulations conducted, it is show that solar power generation using solar panels is an effective alternative energy source where can be option for supplying isolated, remote areas where the grid extension or grid is not available. A cost-effective system configuration option for Upper Blink Water community in South Africa has been determined with the help of two software packages, HOMER and Reticmaster. The community consumes 300-kilowatt hours per day. A 60 kWp PV system, a total number 180 lead acid batteries (1500Ah, 12V), and a 30kW inverter were proposed for an off-grid hybrid energy system. Electricity costs on average was R1.1093 cents per kilowatt-hour, while the amount of diesel fuel consumed each year is 16685 litres. According to the optimal solution, stand-alone hybrid energy systems are economically feasible for rural electrification in remote, isolated and small communities, where the national grid require extension beyond 20 km. In this case, study the breakeven distance was found to be 12 km.
Conflict of Interest
The authors declare no conflict of interest.
Acknowledgment
The authors of this paper would like to acknowledge the Eastern Cape Department of Economic Development, Environmental Affairs and Tourism (DEDEAT) who sponsored this research project, in close collaboration with the Raymond Mhlaba Local Municipality(RLM), the Lower Saxony ministry of environment (MU), DEULA-Nienburg and the Deutsches Zentrum für Luftund Raumfahrt (German Aerospace Center) DLR institute. The authors also acknowledge the University of Johannesburg.
- L. Mbali and O. Dzobo, “Design of an off-grid hybrid pv/diesel energy system with battery storage for electrification of a remote region: A case study of upper blink water community, south africa,” IEEE AFRICON Conf., vol. 2021-Septe, 2021, doi: 10.1109/AFRICON51333.2021.9570944.
- A. N. R. Rt, “A nnual repo rt 2016,” 2016.
- H. Tazvinga, O. Dzobo, and M. Mapako, “Towards sustainable energy system options for improving energy access in Southern Africa,” J. Energy South. Africa, vol. 31, no. 31, pp. 59–72, 2020, doi: 10.17159/2413-3051/2020/V31I1A6504.
- Department of Energy, The South African Energy Sector Report 2019. 2019.
- N. Mahmud, “System for St . Martin Island Using HOMER,” 2013.
- A. Al-Karaghouli and L. L. Kazmerski, “Optimization and life-cycle cost of health clinic PV system for a rural area in southern Iraq using HOMER software,” Sol. Energy, vol. 84, no. 4, pp. 710–714, 2010, doi: 10.1016/j.solener.2010.01.024.
- NASA, “National Aeronautics and Space Administration Graphics Standards Manual Index Introduction 1 The NASA Logotype 2 Reproduction Art 3 Stationery 4 Forms 5 Publications,” 1976.
- Homer Energy, “Homer Pro,” Man. Homer Energy, pp. 1–241, 2019, [Online]. Available: https://www.homerenergy.com/pdf/HOMER2_2.8_HelpManual.pdf.
- G. A. Tumangkeng, “examining solar pv mini-grid system as a complement to grid extension for rural electrification with reference to yama community, northern ghana.,” J. EMBA, vol. 1, no. 4, pp. 78–85, 2013.
- O. Solar and B. P. Solutions, “Backup Power Solutions MPPT 60 150 Solar Charge Controller Make the most of your energy.”
- I. Guide, “Central Inverter SUNNY CENTRAL 500U.”
- E. Cape, “Pre Electrification Report Project name Project number Distributor name Upper linkwater Minigrid,” pp. 3–5, 2017.