DEM models Calibration and Application to Simulate the Phosphate Ore Clogging

Adv. Sci. Technol. Eng. Syst. J. 7(5), 79–90 (2022);
 DOI: 10.25046/aj070511
In different areas of industry (mining, food processing, pharmaceutical, manufacturing…), the problem of grain, aggregate and clusters flow arises during the handling activities especially loading and unloading. Thus, the study and control of the parameters that govern the flow of the granular medium and its interaction with its environment are key parameters to achieve the desired operational excellence and performance of these activities. The adhesion of granular materials on various surfaces of equipments (trucks surfaces, hoppers, silos…) is one of the major problems facing mining companies. In this paper we presented the Calibration of the Discrete Element Method (DEM) parameters for modeling phosphate ore built on the identification of the repose angle. This will help us to specify the correct inputs parameters that will be introduced for the modeling of adhesion phenomena. First we introduced the model contact which allow us to well define contact between phosphate particles-particles (or clusters-clusters) and phosphate particles (clusters) with tipper surface taking into consideration the cohesive and plastic nature of the contact. Secondly, we presented a calibration method based on the determination of the repose angle of the phosphate ore. This method allowed us, using fractional factorial designs and Box Behnken designs, to determine the optimal parameters for a more accurate simulation. Thirdly, we studied the impact of particle velocities on the tipper surface during charging and discharging of phosphate ore. This study allowed us to predict the areas most affected by the abrasion-erosion phenomenon caused by the impact of particles on the tipper surface. This calibration method allowed us to identify the optimal values for the key parameters that will be used later in the modelling of the phosphate clogging phenomenon on the surfaces of transport truck tippers in the mines.
1. Introduction
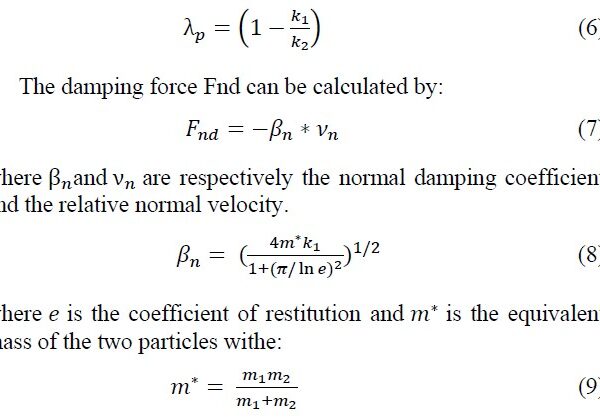
In recent years, the global fertilizer market has been characterized by a significant increase in consumption (1.7% /year since 2011), supported mainly by Asia which dominates the market and concentrates about 2/3 of global production and consumption [1]. The lowest possible purchase cost has become an important competitive factor which has led to the relocation of fertilizer production to areas with significant resources at low exploitation costs (Russia, Qatar, Iran, North Africa and probably in the long term the USA with the exploitation of shale gas). Since fertilisation contributes to both the quantity and quality of agricultural production on which the world’s food system is based, phosphate mining has become the linchpin of the world food security. Studies show how the consumption of phosphate rock, the origin of phosphorus which is a key element in the manufacture of fertilisers, will continue to increase over the coming years. In Morocco, it is estimated that phosphate production will reach 262 Mt in 2050 [1–4].
Clogging is one of the main problems that reduce the efficiency of phosphate extraction. This phenomenon results from the adhesion of the phosphate to different surfaces of the transport truck tipper. This blocked portion intensifies during the winter period, especially in the bottom and sides of the tipper [5]. This problem is called granular clogging.
The phosphate rock, used as raw material, comes from Benguerir mine. From a stratigraphic point of view, the Benguerir phosphate series is formed by an alternation of phosphate rock levels and sterile silico-carbonate levels (intercaler) (Figure 1) and the ensemble is capped by a carbonate slab called the Thersity slab.
It is very difficul to explore the charging and discharging for extraction in situ because of high-risk work conditions [6,7]. Thus, to minimise the cost of experiments and save time, a number of Discrete Element Method simulations (DEM) have been developed[8–12]. With DEM, we can investigate the mechanical and kinematic behaviour of granular materials. In recent years, researchers have carried out DEM simulations with grain shapes and sizes that are complex enough and large enough to be closer to reality, given that DEM was invented much earlier.[13]. the discrete elements method remains the most used calculation tool for the simulation of the various phenomena that appear during the handling of granular materials [14–21]. In the literature, and up to today, we have found three principal approaches used in the simulationt of problems of granular systems: the Monte Carlo approach [22-27], the cellular automation approach [28-31] and the DEM approache [32-34].The cell automation method and the Monte Carlo approaches have enabled the simulation of problems related to granular materials by taking into account only the geometric and statistical aspect, but without considering the real mechanical interactions between grains.. In contrast, the DEM method takes into account the interaction between particles by introducing different contact models. Thus it accurately reflects the mechanical phenomenon of the grain packing. It can generate differents particle size distributions, with varying geometric characteristics and surfaces, as well as various material ratios from the analyzed sample.
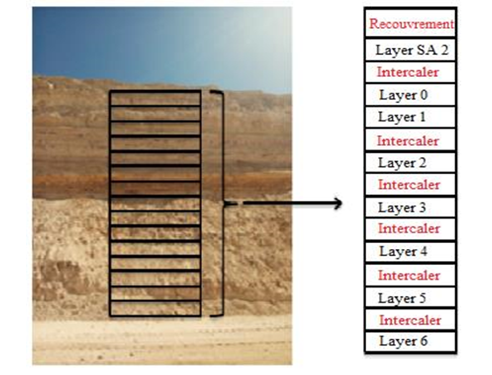
Figure 1: Layered decomposition of Benguerir phosphate [5]
However, what influences the precision of the simulation is the parameter settings [22]. Precise simulations can only be performed if the parameters of the granular materials are well defined. The settings of the process parameters, the nature of the contacts that govern the phenomenon and the behaviour of the materials influences the simulation results[23].
A crucial phase in the development of a discrete element method is the identification of the simulation parameters, namely the specific granular material parameters (Young’s modulus,bulk density and Poisson Coefficient) and the parameters related to the nature of the contacts (the particle-wall and particle-particle friction coefficients and the coefficients of restitution). As a result, a calibration of the setup parameters is strongly required to obtain accurate values for the DEM simulation[24–27].
Simulation on software in general requires values for the parameters of the model. For this purpose, there are two main methods for the DEM software to acquire these parameters of contact. The first one is the direct measurement method (DMM), and the second one is the bulk calibration method (BCM) [22,28–31]. The DMM approach is based on measuring values directly on the particle or contact level. Some properties are easily measured while others remain very difficult, depending on the size of the grains. Almost all attempts have been made at the millimetre level or above [32,33]. Although the values are being directly measured with a certain precision, this does not automatically imply that the DEM model will have the same level of precision at the global level [34–36]. This DMM would be precise if the contact is modelled in an accurate way that captures the physical behaviour of the contact and if both shape and size of the grains are precisely modelled. [37,38]. Precise modelling of grain shape and size is too complex when modelling real industrial cases. the calculation time and power limit of the simulators tend to lead to the selection of reasonably large grain sizes, while the shape of the particles cannot be accurately modelled. [39–41]. The BCM uses an approach where field measurements or laboratory tests are performed to quantify a specific parameter of the bulk granular material. Experiences are reproduced on software as closely as possible to the configuration and procedures in the laboratory or in the terrain. Simulation values are continuously iterated till the intended response corresponds to the measured one. The difference between the real shape and the virtual model of the grains requires a calibration of the contact parameters [30,31,42,43].
In the DEM simulation, the contact model is a crucial factor that affects the precision level of the simulation. In order to get closer to the actual situation, different contact models appeared in a number of several applications [44–53]. In this study, we used two contact models for our simulation. The Johnson-Kendall-Roberts (JKR) is used for the particle-tipper contact, and the Edinburgh-Elasto-Plastic-Adhesion (EEPA) is used for the particle-particle contact [45]. Furthermore, The modelling of the real shape is important in a discrete element simulation, and the more the geometrical characteristics of the real particles are related to the numerical particles, the closer the results of the numerical simulation are to the real behaviour of the material [54–59]. In the ideal case the grain geometry is retrieved using a rotary scanner as illustrated in the work of Chen Yanhui et al [58] which allows to obtain the contours of a particle with precision.
In this work we calibrated DEM for phosphate ore in order to define the parameters of the contact models between the phosphate particles themselves and the surface of the tipper of the ore transport truck. This work will allow us to model with DEM the phenomenon of phosphate adhesion during unloading. We presented the contact models we used, followed by the calibration method adopted during this work which is based on the calibration of the angle of repose. The size, shape and distribution of the phosphate particles used in the calibration were studied. We used the fractional factorial designs and Box Behnken designs to determine the influence of the different calibration parameters on the angle of repose.
2. Edinburgh-Elasto-Plastic-Adhesion (EEPA) model for the particle-particle contact
The Edinburgh Elasto-plastic adhesion EEPA model was introduced by Morrissey [60], and implemented in EDEM® as an option [53], to model cohesive materials with elasto-plastic behaviour such as phosphate and clay. It is an extension of the hysteretic spring model but this time with non-linear behaviour. This model is able to highlight the history of stress dependence of cohesive granular materials with uniaxial consolidation experiments [53]. Mohajeri et al.[74] highlighted the ability of EEPA to generate behaviour that is dependent on the history of previous loads, which is not the case for Hertz-Mindlin, since it’s an elastic model. For this purpose, we chose the EEPA to model particle-particle contact of phosphate ore.
2.1. EEPA Force: Normal Direction
This model is an extension of the linear hysteretic model of Walton and Braun [61] , allowing tensile forces to develop and also allowing non-linear force-displacement behaviour (overlap) as shown in Figures 2 and 3. The load-displacement curve is defined by the constant pull-off force , the loading branch stiffness , the loading-unloading branch stiffness , the minimum force , the adhesion branch stiffness ,and the plastic overlap (deformation).
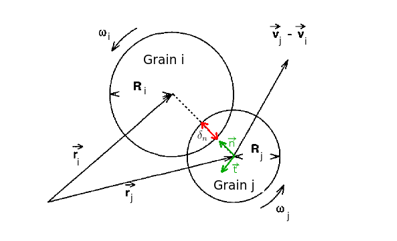
Figure 2: Formalism used during a contact [62]
The normal force F_n is composed of two forces, which show its plastic character, namely the hysteretic spring force F_hys and the damping force F_nd.
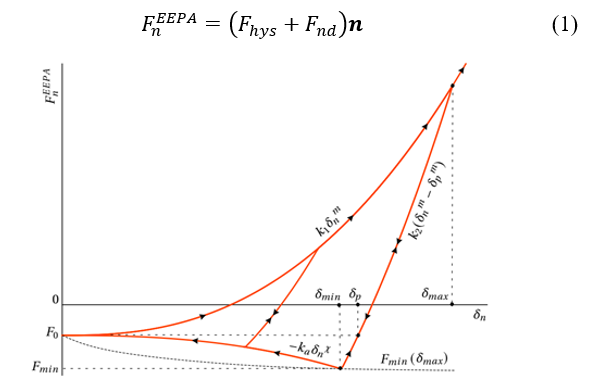
Figure 3: EEPA model force-displacement relation in the normal direction[63]
where e is the normal unit vector at the point of contact at the centre of the two particles.
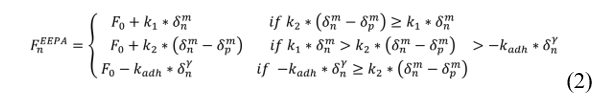
where n is the adhesion force constant, and are respectively the total normal overlap and the plastic overlap. The loading stiffness is given by:
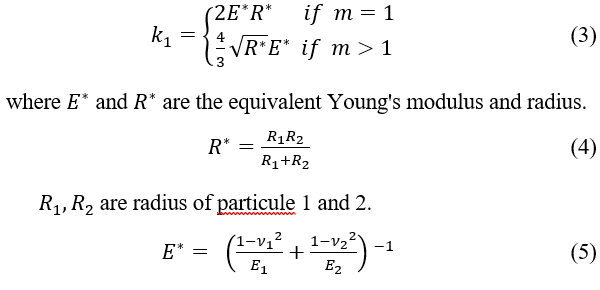
are Young’s modulus of particule 1 and 2.
are Poisson’s ratio of particule 1 and 2.
For our study we took 1.5 as the value of the non-linear slope exponent n. is defined as the contact plasticity ratio and is given by:
2.3. EEPA Force: Force in the Shear Direction
The tangential force Fs is composed of two forces namely tangential damping force Fs and tangential spring force Fs .
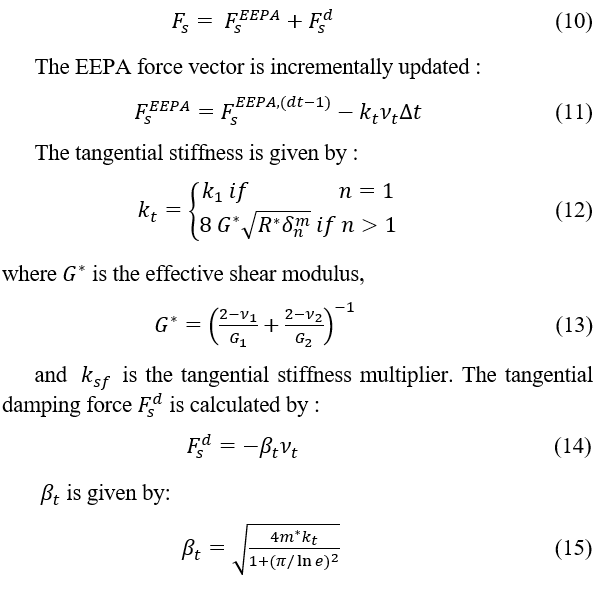
For the stability of the model, tangential force take a critical value :
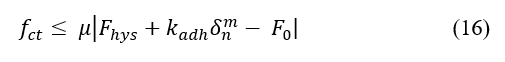
where u is the friction parameter.
3. Johnson-Kendall-Roberts (JKR) Contact Model
Johnson, Kendall and Roberts theory (JKR) [64] introduced adhesion between different surfaces, induced by their surface energies. The (JKR) model is often used to model adherence when caused by capillary forces [60,65–67]. This phenomenon of adhesion has the effect of increasing the contact surface, independently of the load, and justifies the need for a negative force for the release of the surfaces. The theory of the JKR model has been detailed in the work of Jiacheng Zhou et al. [68].
For the collision detection, the Sweep and Prune algorithm remains the most famous algorithm used in contact detection when applying the discrete element method[69,70]. This method gives each particle a rectangle parallelepiped that contains it exactly, and the boundaries of this box define on each x, y and z axis a moving interval [xmin , xmax], [ymin , ymax] and [zmin , zmax] respectively (figure 4). The collision of the particles occurred if there is an intersection between the intervals on one of the three axes.
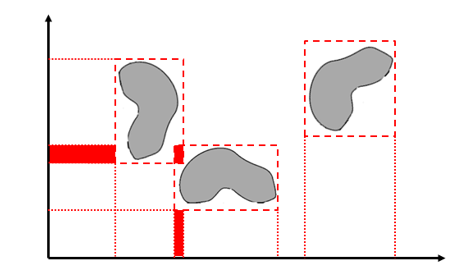
Figure 4 : Principle of the Sweep and Prune algorithm
4. Calibration methodology and parameter analysis
4.1. Angle of repose calibration
To generate results close to reality based on simulations of real industrial processes, the inputs relating to the granular materials must be as accurate as possible. The difficulties encountered in the use of DEM lie in the experimental determination of the grain properties ( shapes, sizes, coefficient of restitution, rolling friction, grain-grain friction and grain-wall friction, density of gains). Consequently, it is necessary to calibrate the input parameters to achieve satisfactory results. [31]. The calibration procedure consists of determining the value of an input parameter by direct measurement such as AoR, bulk density and particle size distribution[71], we then proceed with a series of adjustments until the coincidence between the measured values and the simulated values. A necessary condition is that the tests and measurement method must be reproducible in the laboratory so that the coefficients of interaction can be easily determined.
The angle of repose During a flow, a material forms a natural pile whose slope, defined with the horizontal, forms the natural angle of repose (AoR). It is used to describe the mechanical properties of granular materials. . The natural angle of repose is constant for a given material, but varies with its moisture content [72]. It is used when studying collapsing, stratifiing and segregating. The AoR does not depend only on the mechanical properties of the particles, like density, friction static coefficient and friction dynamic coefficient, but also on the intrinsic properties like shape, geometry and the size of the particles as well as the bulk forming methods [72–75]. When the input values are set, the identification of interaction parameters such as static friction, rolling friction and restitution coefficients must be carried out. These parameters have the ability to considerably affect the nature of the flow. Thus they are very often used as calibration parameters [31,76] [22,77].
The cylinder lifting (Figure 5) is a common experiment for obtaining the AoR of granular materials [78,79]. The device is basically similar to the one commonly used in litterature, whose principle consists essentially in translating a cylinder suspended upwards [79,80].
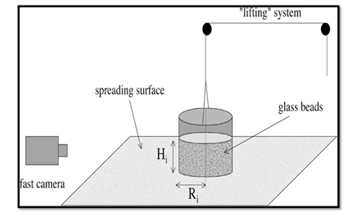
Figure 5 :Controlled hollow cylinder test [78]
Roessler et al [29,73] investigated the influence of the dimensions of the test rig and the particle size distribution on the calibration test based on the angle of rest test using a lifting cylinder and they showed that the results remain invariant . The translation speed of the cylinder is considered as a parameter influencing the AoR. Thus the experiment has provided invariant results for granular materials subjected to static stresses when lifting speeds are low.
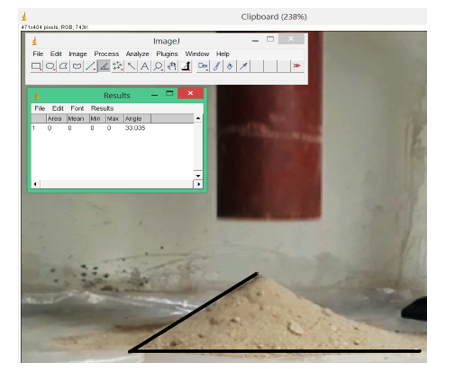
Figure 6: Phosphate AoR test
For our test, 15 kg of mixed phosphate layers (SA2, C1, C2, C3, C4, C5 and C6) is used to carry out the Talus angle test. Inside a cylinder with an internal diameter of 200 mm and a height of 30 cm, a quantity of the Phosphate’s particules are glued in such a way that the flow does not interact with the cylinder material. Similarly, on the support on which the phosphate mass will stand, a quantity of phosphate grains is glued to avoid interaction between the particles and the support (Figure 6). Consequently, the interaction of the particles with the material of the cylinder and the support will be neglected. The cylinder was lifted at a speed of 0.05 m/s [29].
The AoR test was designed to investigate the influence of grain-grain interaction parameters on output variables (angle of repose in our case). We repeated this physical test several times, to have an average of the AoR responses. This average will constitute the target value to be reached during the calibration of the interaction parameters in the EDEM® software. This angle is calculated by measuring the base diameter of the phosphate cone and its height (Figure 7,8).
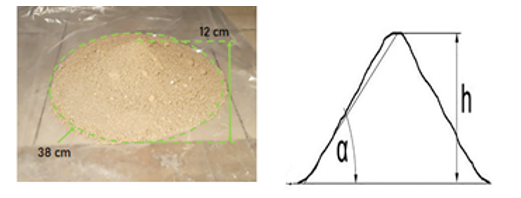
Figure 7: Angle of repose of Phosphate
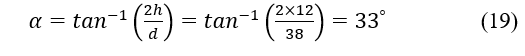
, are respectively the height and the diameter of the phosphate cone. Thus the characteristic angle of repose of the phosphate is 33°. For the verification we used the software ImageJ [81] and the results are shown in Figure 6. This value will therefore be the calibration target in the following.
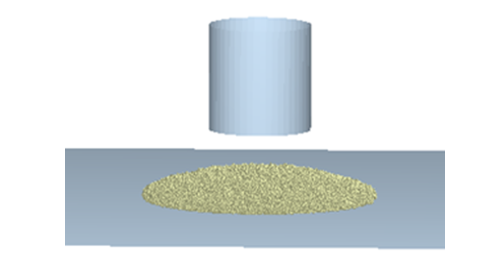
Figure 8: Simulation of the AoR test with EDEM® software
4.2 Particle size distribution and shape
4.2.1 Particle size and distribution
The dimensional distribution of the grains in percentage is determined using dry particle size analysis of samples of phosphate of mass M=1.5 Kg (10 samples). This test is the oldest, most common and most economical test described in the NP 18-560 standard. It consists in classifying the different particles constituting the sample by a series of nylon sieves nested one inside the other, with decreasing openings from top to bottom. The phosphate, dried for 24 hours in an oven at T=120°C to avoid agglomeration of the grains due to the presence of water, is placed at the top and the classification is then obtained by vibrating all the sieves for 5 min. At the end of the test, the rejection from each sieve is weighed (Table1) and the percentage of each size is presented in Figure 9. This study showed that most of the overall mass is concentrated in the 150 μm to 500 μm range.
Table 1: Results of the particle size analysis of phosphate
| Sieve size µm | Retained (g) | Retai-ned (%) | Retained cumulat-ive (g) | Retained cumulative (%) | Cumulati-ve sieve (%) |
| 2000 | 49.8 | 3.32 | 49.8 | 3.32 | 96.68 |
| 800 | 172.05 | 11.47 | 221.85 | 14.79 | 85.21 |
| 500 | 399.45 | 26.63 | 621.3 | 41.42 | 58.58 |
| 250 | 399 | 26.6 | 1020.3 | 68.02 | 31.98 |
| 150 | 280.5 | 18.71 | 1300.95 | 86.73 | 13.27 |
| 80 | 150.3 | 10.02 | 1451.25 | 96.75 | 3.25 |
| 45.3 | 3.02 | 1496.55 | 99.77 | 0.23 |
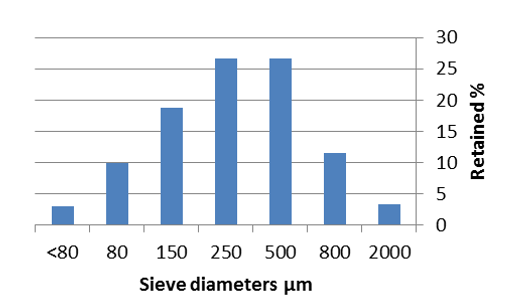
Figure 9: Grain size distribution of phosphate
For the simulation we are asked to enter the particle size distribution of the granular material. For this purpose a statistical test of normality will be carried out to check whether the data in Table 1 follow a normal distribution. The distribution is symmetrical, bell-shaped. It would seem that it can be modelled by a normal distribution. To confirm this, we construct Henry’s line. Henry’s line is used to approximate the average and standard deviation of the observations of a variable when only the frequencies of its values are available (Figure 10). The distribution can therefore be considered Gaussian. The estimated population average is 390.8µm and the standard deviation is . The software results show that the coefficient of determination R2 = 0.907 and the corrected coefficient of determination = 0.91. These two values indicate that our model is very reliable and can be applied to describe the influence of factors on the response.
4.2.2. Particle shape
The modelling of the real shape is important in a discrete element simulation, and the more the geometrical characteristics of the real particles are related to the numerical particles, the closer the results of the numerical simulation are to the real behaviour of the material [57,59,82]. In the ideal case the grain geometry is retrieved using a rotary scanner [58] which allows to obtain the contours of a particle with precision. In this work, and in order to carry out a three-dimensional modelling of the geometry of an irregular Phosphate particle, samples of each layer of the Benguerir Phosphate are taken to view the structure of their grains under an electronic microscope (Figure 11). Several particle images were taken to select the most representative in terms of size and angularity in order to produce an STL file of the outer shape of a Phosphate particle using CATIA V5 software and which has a geometry roughly gathering almost all the details of the real particles.
The EDEM® software allows users to specify the particle geometry through the so-called “multi-sphere” model, which selects spheres of different sizes to fill the inner volume of the numerical particle geometry, and with the non-linear least squares optimisation the solutions are refined to to reach the minimum error value for mass and shape. When the STL file is entered into the software, different types of particles can be generated in such a way that the shape and size of the particle can be modified by changing the number of bonded spheres and their sizes. However, the calculation time increases exponentially with the number of bonded spheres.
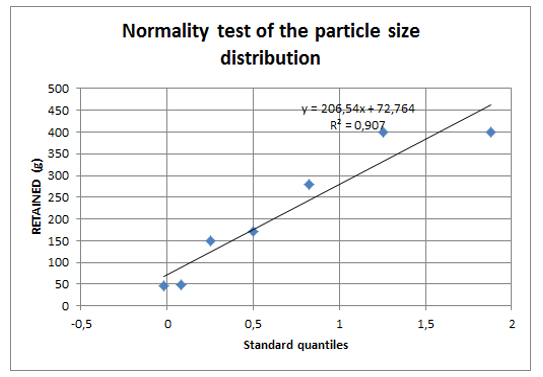
Figure 10: Henry line of particle size distribution
In order to minimise time of simulation, McDowell et al. [83], consider that combining a number of spheres greater than eight can give satisfactory simulation results (Figure 12).
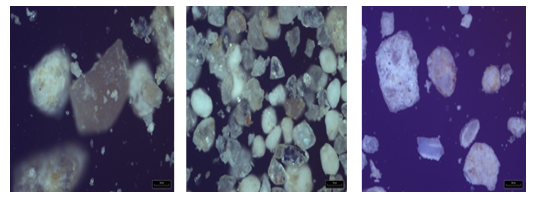
Figure 11: Phosphate grain of sample C1, C3,C6 taken by electronic microscope
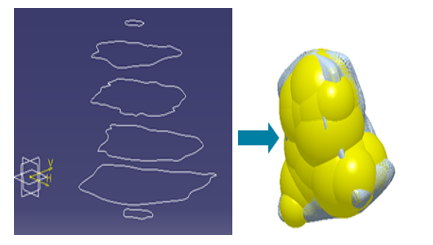
Figure 12: Particle constructed using the ‘multi-sphere’ method from STL files
5. Test results according to the fractional factorial design
For our simulation process, the DEM was applied, and the EDEM® software was chosen in this research [84]. The EEPA contact model was adopted , with a value of 9.81 m/s2 for the gravitational acceleration. The inputs parameteres applied in our simulation are presented in Table 2,3,4.
Table 2 :Values of some simulation parameters
| Young’s modulus E (Pa) | Shear modulus G (Pa) | Poisson Coef. ( ) | Average density ) | |
| Phosphate | 2.5 | 0.25 | 2404 |
Table 3 :Results of the shear cell test
| Reference layer | C (KPa) | (°) |
| C3 | 30 | 33 |
Table 4 :Results of the odometer test
| Layer reference | shear index (Cc) | Swell index (Cs) |
| C6 | 0.193 | 0.010 |
The developers of the EDEM® software recommend using a experimental plan to adjust the properties of the granular material. Thus, a fractional factorial design [85,86] with two levels of resolution and five factors will be used to study the five inter-granular interaction factors in sixteen experiments (Figure 13). For this purpose, an initial range of these interaction parameters was determined on the basis of the literature [5,87,88] and on the basis of the GEMM integrated material data library in the EDEM® software.
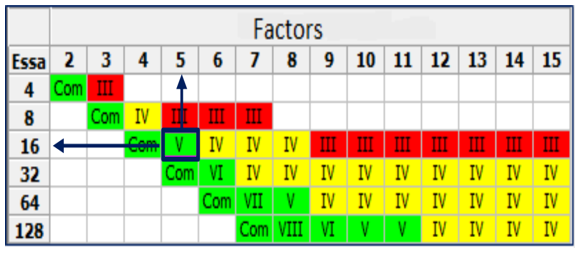
Figure 13: Choice of experimental plan
Table 5 :Model parameter ranges
| Parameter | Identifier | Low level | High level |
| Coefficient of restitution | A | 0.15 | 0.75 |
| Static friction coefficient | B | 0.2 | 1 |
| Rolling resistance coefficient | C | 0 | 0.3 |
| Surface energy (J/m2) | D | 0.3 | 1.5 |
| Pull-off constant | E | -0.009 | 0 |
This library helps the software user through a set of questions (field of application, density, experimental angle of repose) to set likely values of the parameters to model the physical phenomenon (Table 5). The fractional factorial design will be used first to analyse the relationships between the parameters potentially influencing the AoR. Once the influencing factors have been determined, a response surface design analysis will be carried out to accurately determine the parameter values of the model.
The results of the test according to the fractional factorial design are presented in Figure 14. It can be seen that the angle of repose has a large range of variation with a maximum and minimum value of 47.92° and 14.3° respectively, which suggests the influence of certain simulation parameters on the angle of repose.
We conducted a more in-depth analysis of the model results reported on the graph (Figure 15). The significance of the factors can be seen intuitively and is in the following decreasing order: coefficient of static friction > surface energy > coefficient of rolling resistance > coefficient of restitution > pull-off constant.
Based on Figure 16 we state that the four parameters: coefficient of rolling resistance, surface energy and static friction coefficient of the particles have a great influence on the AoR of the phosphate mass, Unlike the other parameters, with an order of influence as follows: coefficient of static friction > surface energy > coefficient of rolling resistance.
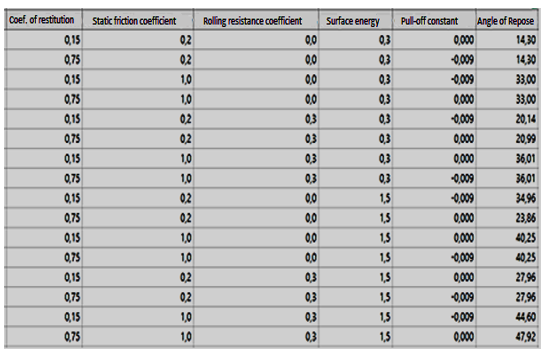
Figure 14: Simulation results following the fractional factorial design
As the parameters contact coefficient of restitution and pull-off constant have no significant effect on the response of the angle of repose of the phosphate mass, their values will be set at the low levels shown in Table 6.
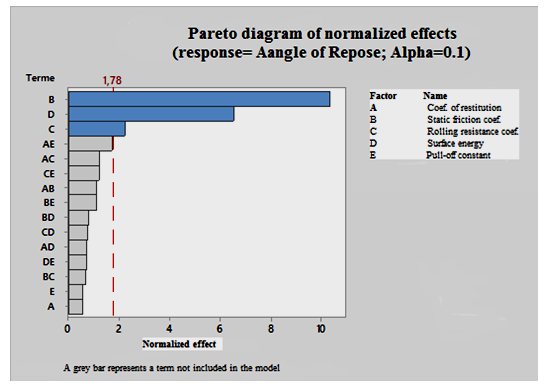
Figure 15: Significance of study factors
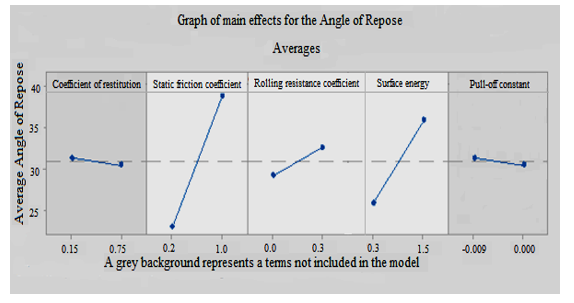
Figure 16: Factors influencing the Angle of Repose
Table 6: Values of non-significant parameters
| Non-significant parameter | Value |
| Coefficient of restitution | 0.15 |
| Pull-off constant | -0.009 |
6. Results of the simulation according to Box Behnken’s planTest [89–91]
After the determination of the significative factors for the angle of repose through the fractional factorial design it is necessary to find the exact values of these parameters retained to arrive at a correct modelling of the behaviour of the phosphate. For this purpose the Box Behnken design of experiments are used to find the quadratic relation that links these parameters, considered continuous this time, to the ‘angle of repose’ response. A three-factor response surface design is chosen and will be studied in 15 trials as recommended by the Minitab software (Figure 17).
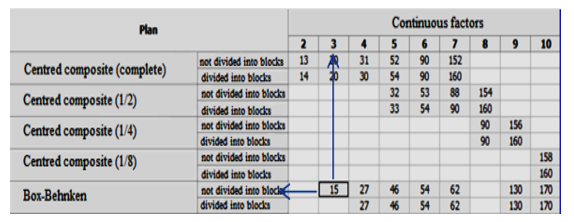
Figure 17 :Choice of plan of experiments
From an analysis of the responses of simulation the angle of repose in Figure 14, it can be seen that the (AoR) approaches the experimental value for ranges of coefficient of friction, coefficient of rolling resistance and surface energy in the intervals [0.4; 1], [0; 0.4] and [0.8; 1.2] respectively. Thus these intervals will form the basis of the study using Box Behnken plan. The results of the numerical simulation following the test matrix are shown in Figure 18 , and it can be seen that the responses are close to the results of the previous fractional plan. In addition, a quadratic regression model is established by the software MiniTab (Equation 20) which has a coefficient of determination of 98.58% close to 1 (i.e.) it has a high reliability.
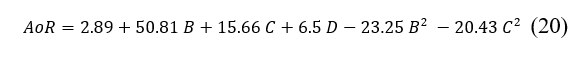
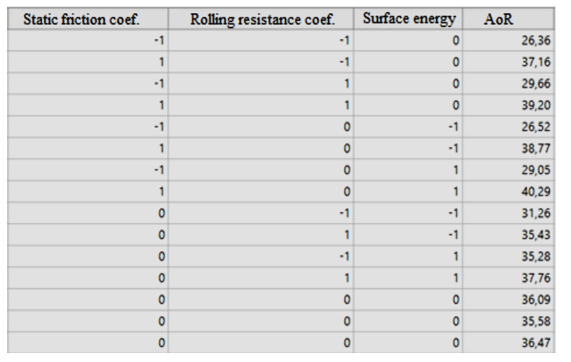
Figure 18: Simulation results following the Box Behnken plan
7. Analysis of the interaction effect of the regression model
In this test, the AoR of the phosphate mass is used as an indicator for evaluating the regression model. Response surfaces and contour diagram of the pairwise interaction of the different parameters that affect the angle of repose are shown in Figures 19 and 20. An analysis of the parabolas that exist on the response surface curve shows the existence of a non-linear dependence of the AoR on the coefficient of static friction and the coefficient of rolling resistance. These quadratic dependencies are illustrated in the model of Equation 20 with the square term of the coefficient of static friction and rolling resistance. As shown in Figures 19 and 20, the angle of repose increases with the increase in surface energy. When this energy increases, it will lead to a stronger adhesion between the particles, which will lead to the creation of new aggregates that will give more stability to the granular material. This will make particle collapse more difficult and therefore the angle of rest will increase. Similarly the AoR increases with the increase of the coefficient of static friction since the friction contradicts the movement of the particles on each other and thus the angle of the phosphate pile increases. The figures 21 and 22 show that while the rolling resistance coefficient of the particles increases the repose angle of the phosphate volume increases. This is because the rolling resistance prevents the particles from rolling down the slope of the granular cone, which contributes to the increase in the angle of repose.
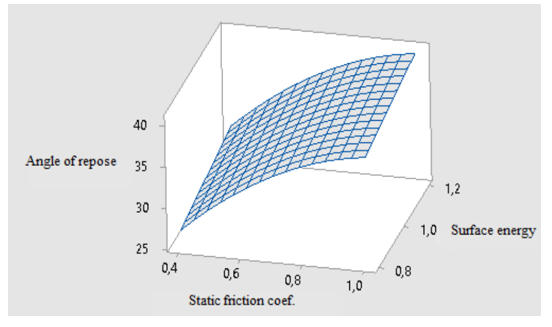
Figure 19: Variation of the angle of repose with surface energy and the static friction coefficient
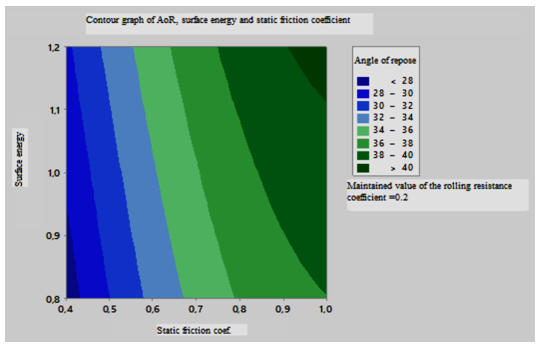
Figure 20: Contour graph of AoR, surface energy and static friction coefficient
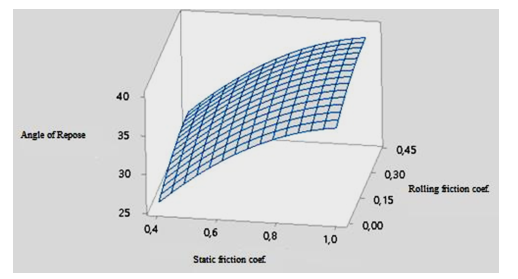
Figure 21: Variation of the AoR as a function of the surface energy and the rolling resistance coefficient
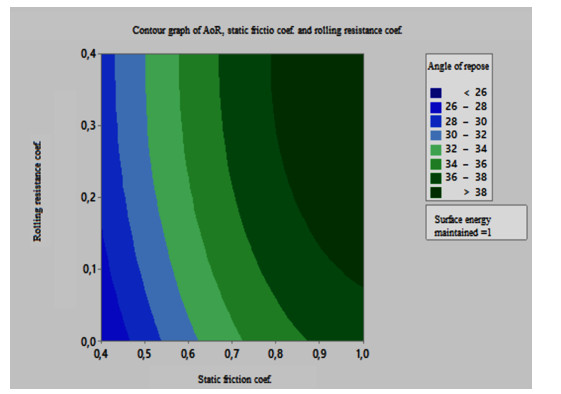
Figure 22: Contour graph of the AoR as a function of the surface energy and the rolling resistance coefficient
8. Results and discussion
The repose angle AoR of the phosphate mass measured by field test was 33°. We taked this real angle as the response value and used the contours above and take as values of significant parameters the following values:
Table 7: Optimised values of the simulation parameters
| Parameters | Values |
| Static friction coef. | 0.7 |
| Rolling resistance coef. | 0.3 |
| Surface energy | 1j/m2 |
A simulation under EDEM® was performed under the optimised parameters and the angle of repose for phosphate ore was 34.38°. We compared the test results with the simulation results. The relative error was 4.19%. This error value shows that the optimised parameters can be utilised as a reference for the characteristics of the phosphate.
9. Particle velocities
In this section we will investigate the impact of particle velocity on the contact with the tipper surface during loading and unloading. During the first few moments of loading of the tipper by the loader bucket, the simulation results show that the area most affected by the falling grain is in the front part of the tipper as shown in Figure 23. This configuration is quite natural since the particles leaving the bucket are accelerated by gravity to find this area on the tipper first, and then the grains that follow will be oriented towards the sides once the angle of repose exceeds the AoR of the phosphate.
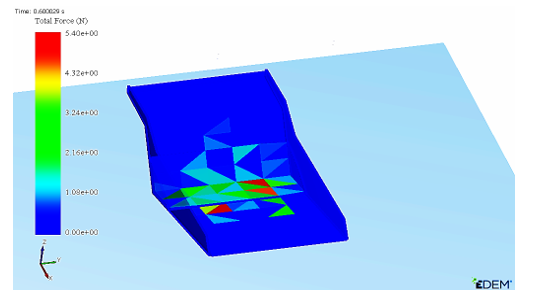
Figure 23: Area of first impact on the tipper
Just before the collision,the particles have a maximum kinetic energy, as they are accelerated by gravity to reach a maximum speed of 3.92 m/s during the first contacts with the tipper (Figure 24). This maximum falling speed starts to decrease as the granular material accumulates in the tipper since the height of fall decreases (figure 25).
Of course, this area of first impact can move on the tipper depending on the position of the loader bucket. Thus, the amplitude of the falling speed will depend on the height of the bucket. Figure 26 shows the decrease in the value of the maximum particle velocity (2.75 m/s) in the case of the reduction of the drop height. However, the position of the filler was fixed according to multiple observations of the truck loading operation in the field or on website videos.
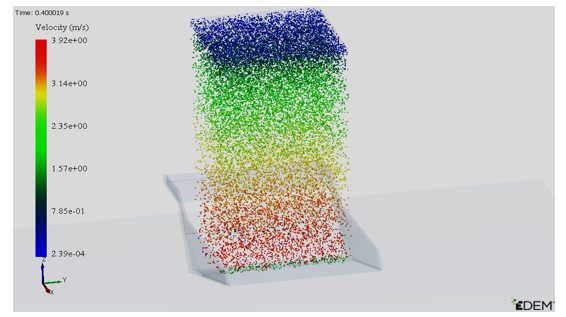
Figure 24: Maximum impact speed
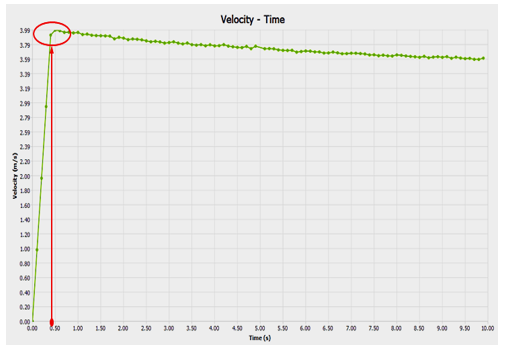
Figure 25: Variation of maximum particle velocities
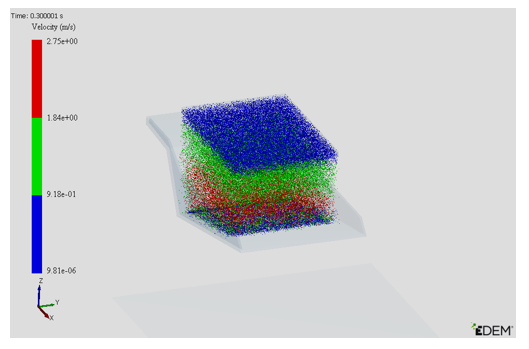
Figure 26: Decrease in particle velocity with decreasing of drop height
This data predicts that the front part of the tipper will be more exposed to abrasive erosion due to the high rates of direct collision of the particles against the tipper during the early loading phase. This is confirmed by the presence of pits and cavities in the same area on the tippers . These pits will increase the flow angle and consequently trap the phosphate grains and give rise to the nucleation of the clogging phenomenon.
10. Conclusion
In this work, we studied phosphate ore using the discrete element method. The study is devoted to the calibration of the DEM based on the angle of repose. The simulation parameters are calibrated and optimized by combining the results from the various physical tests and the DEM simulation with the EDEM® software. We took the value of the angle of repose as the target for the simulation response values, and using the Minitab software, we were able to analyze and optimize the simulation parameters using the response surface method. These physical parameters that significantly affect the AoRt were selected, and the interaction between them was analyzed to determine optimal values. We also applied the fractional factorial design test, and the results are analysed to determine the influence of each of the factors and it was found that the angle of repose depends only on the coefficient of static friction, the surface energy and the rolling resistance coefficient. In addition we used Box-Behnken response surface methode. The results were analysed and we established the regression model of the significant factors on the angle of repose. This model predicts an increase in the angle of repose as the significant factors increase. The results show that when the surface energy, static friction coefficient and rolling resistance coefficient take the values: 1 J/m2, 0.7 and 0.3 respectively, the simulation results are consistent with the experimental test result and the error in the angle of repose obtained is 4.19%.
A study was conducted on the impact of particle velocity on the surface of the tipper during loading and unloading. This study allowed us to predict that the front part of the tipper will be more exposed to abrasive erosion due to the high speed of direct collision of the particles against the tipper during the beginning of the loading phase, which corresponds perfectly to the reality in the field.
This work constitutes the first part for the study of phosphate or clogging. Indeed, the identification of the different parameters that define phosphate by the calibration method will allow us to better model the phenomenon with the DEM method. The study of the impact velocities will be used to model the stresses and strains on the tipper surface during the loading and unloading of the phosphate in our next work.
Conflict of Interest
The authors declare no conflict of interest.
- FAO, Marché mondial des engrais: bilan du resserrement actuel du marché ., ROME, 2022.
- FAO, World fertilizer trends and outlook to 2020, 2017.
- N. Alexandratos, J.B. Fao, “WORLD AGRICULTURE TOWARDS 2030 / 2050 The 2012 Revision ESA Working Paper No . 12-03.”
- P. Christmanna, “A forward look into rare earth supply and demand: A role for sedimentary phosphate deposits?,” Procedia Engineering, 83, 19–26, 2014, doi:10.1016/j.proeng.2014.09.005.
- M. Medkour, Y. Najih, J. Bengourram, A. El Ghmari, M. Bachaoui, H. Latrache, M. Mabrouki, “Mechanical and thermal characterization of natural phosphate: Clogging understanding (Part 1),” Materials Today: Proceedings, 51, 2032–2039, 2022, doi:10.1016/j.matpr.2021.06.261.
- I. Louw, “Potential radiological impact of the phosphate industry in South Africa on the public and the environment ( Paper 1 ),” Journal of Environmental Radioactivity, 217(February), 106214, 2020, doi:10.1016/j.jenvrad.2020.106214.
- J. Duarte, A.T. Marques, Occupational Accidents in the Mining Industry — A Short Review, Springer International Publishing: 61–69, 2019, doi:10.1007/978-3-030-14730-3.
- J. Shen, A. Roberts, C. Wheeler, “Dem simulations on gate loads and bin storage characteristics before discharge,” Powder Technology, 383, 280–291, 2021, doi:10.1016/j.powtec.2021.01.028.
- M.J. Mohajeri, W. De Kluijver, R.L.J. Helmons, C. Van Rhee, D.L. Schott, “A validated co-simulation of grab and moist iron ore cargo : Replicating the cohesive and stress-history dependent behaviour of bulk solids,” Advanced Powder Technology, 32(4), 1157–1169, 2021, doi:10.1016/j.apt.2021.02.017.
- J. Sun, H. Chen, J. Duan, Z. Liu, Q. Zhu, “Mechanical properties of the grooved-wheel drilling particles under multivariate interaction influenced based on 3D printing and EDEM simulation,” Computers and Electronics in Agriculture, 172(July 2019), 105329, 2020, doi:10.1016/j.compag.2020.105329.
- M. Haustein, A. Gladkyy, R. Schwarze, “Discrete element modeling of deformable particles in YADE,” SoftwareX, 6, 118–123, 2017, doi:10.1016/j.softx.2017.05.001.
- C. Ramírez-Aragón, J. Ordieres-Meré, F. Alba-Elías, A. González-Marcos, “Comparison of Cohesive models in EDEM and LIGGGHTS for simulating powder compaction,” Materials, 11(11), 1–17, 2018, doi:10.3390/ma11112341.
- B.C. Burman, P.A. Cundall, O.D.L. Strack, “A discrete numerical model for granular assemblies,” Geotechnique, 30(3), 331–336, 1980, doi:10.1680/geot.1980.30.3.331.
- J. Jahnke, M. Burger, “PARAMETER IDENTIFICATION FOR SOIL SIMULATION BASED ON THE DISCRETE ELEMENT METHOD AND APPLICATION TO SMALL SCALE SHALLOW PENETRATION TESTS,” 332–342, 2019.
- Y. Zhu, J. Gong, Z. Nie, “Particuology Shear behaviours of cohesionless mixed soils using the DEM : The influence of coarse particle shape,” Particuology, 55, 151–165, 2021, doi:10.1016/j.partic.2020.07.002.
- F.-V.D. Luc Scholtès, “A DEM model for soft and hard rocks : Role of grain interlocking on strength,” Journal of the Mechanics and Physics of Solids, 61, 352–369, 2013, doi:10.1016/j.jmps.2012.10.005.
- D. Yan, J. Yu, Y. Wang, L. Zhou, K. Sun, Y. Tian, “A Review of the Application of Discrete Element Method in Agricultural Engineering : A Case Study of Soybean,” 1–18, 2022.
- L.K. Nordell, “Particle flow modeling: transfer chutes & other applications,” International Materials Handling Conference (BELTCON 9), Johannesburg, South Africa, 1–16, 1997.
- D.B.B. Hastie, a. P.P. Grima, P.W.W. Wypych, “Validation of particle flow through a conveyor transfer spoon via particle velocity analysis,” Bulk Europe 2008, (March 2015), 1–5, 2008.
- T. Gröger, A. Katterfeld, “On the numerical calibration of discrete element models for the simulation of bulk solids,” Computer Aided Chemical Engineering, 21(C), 533–538, 2006, doi:10.1016/S1570-7946(06)80100-8.
- M.D. Sinnott, P.W. Cleary, “The effect of particle shape on mixing in a high shear mixer,” Computational Particle Mechanics, 3(4), 477–504, 2016, doi:10.1007/s40571-015-0065-4.
- S. Zhang, M.Z. Tekeste, Y. Li, A. Gaul, D. Zhu, J. Liao, “Scaled-up rice grain modelling for DEM calibration and the validation of hopper flow,” Biosystems Engineering, 194, 196–212, 2020, doi:10.1016/j.biosystemseng.2020.03.018.
- B. Soltanbeigi, A. Podlozhnyuk, C. Kloss, S. Pirker, J.Y. Ooi, S.A. Papanicolopulos, “Influence of various DEM shape representation methods on packing and shearing of granular assemblies,” Granular Matter, 23(2), 1–16, 2021, doi:10.1007/s10035-020-01078-y.
- S. Huang, J.X. Huang, Y.S. Mo, Z.F. Zhang, “Study on Wear Properties of the Flow Parts in a Centrifugal Pump based on EDEM-Fluent Coupling,” Reneng Dongli Gongcheng/Journal of Engineering for Thermal Energy and Power, 35(1), 62–69, 2020, doi:10.16146/j.cnki.rndlgc.2020.01.010.
- B.M. Ghodki, M. Patel, R. Namdeo, G. Carpenter, “Calibration of discrete element model parameters: soybeans,” Computational Particle Mechanics, 6(1), 3–10, 2019, doi:10.1007/s40571-018-0194-7.
- Y. Tan, Y. Yu, J. Fottner, S. Kessler, “Automated measurement of the numerical angle of repose (aMAoR) of biomass particles in EDEM with a novel algorithm,” Powder Technology, 388, 462–473, 2021, doi:10.1016/j.powtec.2021.04.062.
- M. Mousaviraad, M. Tekeste, K.A. Rosentrater, “CALIBRATION AND VALIDATION OF A DISCRETE ELEMENT MODEL OF CORN USING GRAIN FLOW SIMULATION IN A COMMERCIAL SCREW GRAIN AUGER,” 60(4), 1403–1415, 2017.
- M.J. Mohajeri, H.Q. Do, D.L. Schott, “DEM calibration of cohesive material in the ring shear test by applying a genetic algorithm framework,” Advanced Powder Technology, 31(5), 1838–1850, 2020, doi:10.1016/j.apt.2020.02.019.
- T. Roessler, A. Katterfeld, “DEM parameter calibration of cohesive bulk materials using a simple angle of repose test,” Particuology, 45, 105–115, 2019, doi:10.1016/j.partic.2018.08.005.
- A. Boikov, R. Savelev, V. Payor, A. Potapov, “Universal Approach for DEM Parameters Calibration of Bulk Materials,” 2021.
- C.J. Coetzee, “Review: Calibration of the discrete element method,” Powder Technology, 310, 104–142, 2017, doi:10.1016/j.powtec.2017.01.015.
- N. Kassotakis, V. Sarhosis, M. V Peppa, J. Mills, “Quantifying the effect of geometric uncertainty on the structural behaviour of arches developed from direct measurement and Structure-from-Motion ( SfM ) photogrammetry,” Engineering Structures, 230(December 2020), 111710, 2021, doi:10.1016/j.engstruct.2020.111710.
- M. Marigo, E.H. Stitt, “Discrete element method (DEM) for industrial applications: Comments on calibration and validation for the modelling of cylindrical pellets,” KONA Powder and Particle Journal, 32(32), 236–252, 2015, doi:10.14356/kona.2015016.
- S. Kirsch, “Avoiding ambiguity in DEM in-situ calibration for dry bulk materials,” Minerals Engineering, 145(July 2019), 106094, 2020, doi:10.1016/j.mineng.2019.106094.
- J. Quist, M. Evertsson, “Framework for DEM Model Calibration and Validation,” Proceedings of the 14th European Symposium on Comminution and Classification, (September), 103–108, 2015.
- T.A.H. Simons, R. Weiler, S. Strege, S. Bensmann, M. Schilling, A. Kwade, “A ring shear tester as calibration experiment for DEM simulations in agitated mixers – A sensitivity study,” Procedia Engineering, 102, 741–748, 2015, doi:10.1016/j.proeng.2015.01.178.
- G. Ma, Z. Sun, H. Ma, P. Li, “Calibration of Contact Parameters for Moist Bulk of Shotcrete Based on EDEM,” Advances in Materials Science and Engineering, 2022, 2022, doi:10.1155/2022/6072303.
- G.K.P. Barrios, R.M. de Carvalho, A. Kwade, L.M. Tavares, “Contact parameter estimation for DEM simulation of iron ore pellet handling,” Powder Technology, 248, 84–93, 2013, doi:10.1016/j.powtec.2013.01.063.
- C. Chen, J. Gu, Z. Peng, X. Dai, Q. Liu, G.Q. Zhu, “Discrete element modeling of particles sphericity effect on sand direct shear performance,” Scientific Reports, 12(1), 1–14, 2022, doi:10.1038/s41598-022-09543-9.
- Z. Zhao, G. Jiang, R. Mao, “Effects of particle sizes of rock phosphate on immobilizing heavy metals in lead zinc mine soils,” 14(2), 258–266, 2014.
- Z. Wang, Y. Fang, W. Feng, X. Tian, J. Lin, “Comparative Study on Particle Size Effect of Crushable Granular Soils through DEM Simulations,” 2022, 2022, doi:10.2113/2022/1608454/5558342/1608454.pdf.
- S. Ben Turkia, D.N. Wilke, P. Pizette, N. Govender, N.E. Abriak, “Benefits of virtual calibration for discrete element parameter estimation from bulk experiments,” Granular Matter, 1–16, 2019, doi:10.1007/s10035-019-0962-y.
- E.X.Z.. P.Z.. Z.H. Jiang, “Discrete Element Method of Coke Accumulation : Calibration of the Contact Parameter,” IFAC-PapersOnLine, 241–245, 2018, doi:10.1016/j.ifacol.2018.09.425.
- A.V.B.. R.V.S.A.P., “DEM Calibration Approach : Implementing Contact Model,” Journal of Physics: Conf. Series, 2018.
- Z. Wu, X. Wang, D. Liu, F. Xie, L. George, Z. Zhang, Q. Tang, “Calibration of discrete element parameters and experimental verification for modelling subsurface soils,” Biosystems Engineering, 212, 215–227, 2021, doi:10.1016/j.biosystemseng.2021.10.012.
- Y. Su, Y. Xu, T. Cui, X. Gao, G. Xia, Y. Li, “Determination and interpretation of bonded- particle model parameters for simulation of maize kernels,” Biosystems Engineering, 210, 193–205, 2021, doi:10.1016/j.biosystemseng.2021.08.022.
- Z. Zhao, H. Li, J. Liu, S.X. Yang, “Control method of seedbed compactness based on fragment soil compaction dynamic characteristics,” Soil and Tillage Research, 198(January), 104551, 2020, doi:10.1016/j.still.2019.104551.
- L. Zhang, C.Q. Ru, “A refined JKR model for adhesion of a rigid sphere on a soft elastic substrate,” Journal of Applied Mechanics, Transactions ASME, 86(5), 1–11, 2019, doi:10.1115/1.4042574.
- J. Hellwig, R.M.P. Karlsson, L. Wågberg, T. Pettersson, “Measuring elasticity of wet cellulose beads with an AFM colloidal probe using a linearized DMT model,” Analytical Methods, 9(27), 4019–4022, 2017, doi:10.1039/c7ay01219e.
- A. Papangelo, R. Lovino, M. Ciavarella, “Electroadhesive sphere-flat contact problem: A comparison between DMT and full iterative finite element solutions,” Tribology International, 152(May), 106542, 2020, doi:10.1016/j.triboint.2020.106542.
- S. Richesson, M. Sahimi, “Hertz-Mindlin Theory of Contacting Grains and the Effective-Medium Approximation for the Permeability of Deforming Porous Media,” Geophysical Research Letters, 46(14), 8039–8045, 2019, doi:10.1029/2019GL083727.
- M.J. Mohajeri, R.L.J. Helmons, C. van Rhee, D.L. Schott, “A hybrid particle-geometric scaling approach for elasto-plastic adhesive DEM contact models,” Powder Technology, 369, 72–87, 2020, doi:10.1016/j.powtec.2020.05.012.
- S.C. Thakur, J.P. Morrissey, J. Sun, J.F. Chen, J.Y. Ooi, “Micromechanical analysis of cohesive granular materials using the discrete element method with an adhesive elasto-plastic contact model,” Granular Matter, 16(3), 383–400, 2014, doi:10.1007/s10035-014-0506-4.
- A. Hafez, Q. Liu, T. Finkbeiner, R.A. Alouhali, T.E. Moellendick, J.C. Santamarina, “The effect of particle shape on discharge and clogging,” Scientific Reports, 11(1), 1–12, 2021, doi:10.1038/s41598-021-82744-w.
- P. Vangla, N. Roy, M.L. Gali, “Image based shape characterization of granular materials and its effect on kinematics of particle motion,” Granular Matter, 20(1), 2018, doi:10.1007/s10035-017-0776-8.
- S.S. Ahmed, A. Martinez, “Effects of Particle Shape on the Shear Wave Velocity and Shear Modulus of 3D Printed Sand Analogs,” Open Geomechanics, 3(1), 1–18, 2022, doi:10.5802/ogeo.9.
- D. Höhner, S. Wirtz, V. Scherer, “A numerical study on the influence of particle shape on hopper discharge within the polyhedral and multi-sphere discrete element method,” Powder Technology, 226, 16–28, 2012, doi:10.1016/j.powtec.2012.03.041.
- Y. Chen, Z. Chu, X. Yu, “Research of The Influence of The Particle Geometry on The Accumulation of Repose Angle Based on DEM,” 154(Icmia), 38–46, 2017, doi:10.2991/icmia-17.2017.8.
- A. Khazeni, Z. Mansourpour, “Influence of non-spherical shape approximation on DEM simulation accuracy by multi-sphere method,” Powder Technology, 332, 265–278, 2018, doi:10.1016/j.powtec.2018.03.030.
- J.P. Morrissey, “Discrete Element Modelling of Iron Ore Fines to Include the Effects of Moisture and Fines,” 1–395, 2013.
- O.R. Walton, R.L. Braun, “Viscosity, granular‐temperature, and stress calculations for shearing assemblies of inelastic, frictional disks,” Journal of Rheology, 30(5), 949–980, 1986, doi:10.1122/1.549893.
- M.J. BOUTELOUP, Simulation numérique de la dynamique d’un lit granulaire cisaillé par un fluide visqueux, Institut National Polytechnique de Toulouse (INP Toulouse), 2017.
- C.J. Coetzee, Edinburgh-Elasto-Plastic-Adhesion (EEPA) Contact Model Implementation in PFC, Version 1.1, 2022, doi:10.13140/RG.2.2.13659.18724.
- K.L. Johnson, K. Kendall, A.D. Roberts, “Surface energy and the contact of elastic solids,” Proceedings of the Royal Society of London. A. Mathematical and Physical Sciences, 324(1558), 301–313, 1971, doi:10.1098/rspa.1971.0141.
- J. Hærvig, U. Kleinhans, C. Wieland, H. Spliethoff, A.L. Jensen, K. Sørensen, T.J. Condra, “On the adhesive JKR contact and rolling models for reduced particle stiffness discrete element simulations,” Powder Technology, 319, 472–482, 2017, doi:10.1016/j.powtec.2017.07.006.
- S.A. Carr, J. Liu, A.G. Tesoro, “Transport and fate of microplastic particles in wastewater treatment plants,” Water Research, 91, 174–182, 2016, doi:10.1016/j.watres.2016.01.002.
- R. Xia, B. Li, X. Wang, T. Li, Z. Yang, “Measurement and calibration of the discrete element parameters of wet bulk coal,” Measurement: Journal of the International Measurement Confederation, 142, 84–95, 2019, doi:10.1016/j.measurement.2019.04.069.
- J. Zhou, L. Zhang, C. Hu, Z. Li, J. Tang, K. Mao, X. Wang, “Calibration of wet sand and gravel particles based on JKR contact model,” Powder Technology, 397, 117005, 2022, doi:10.1016/j.powtec.2021.11.049.
- T. Capannini, Gabriele and Larsson, “Adaptive Collision Culling for Massive Simulations by a Parallel and Context-Aware Sweep and Prune Algorithm,” IEEE Transactions on Visualization and Computer Graphics, 24(7), 2064–2077, 2018, doi:10.1109/TVCG.2017.2709313.
- J.C. Monan Wang, “A review of collision detection for deformable objects,” Computer Animation and Virtual Worlds, 32(5), 2021, doi:https://doi.org/10.1002/cav.1987.
- A. Grima, D. Hastie, D. Curry, P. Wypych, R. La Roche, A. Grima, D. Hastie, L. Roche, “The beginning of a new era in design: Calibrated discrete element modelling Publication Details,” Australian Bulk Handling Review, 16(6), 14–21, 2011.
- H.M. Beakawi Al-Hashemi, O.S. Baghabra Al-Amoudi, “A review on the angle of repose of granular materials,” Powder Technology, 330, 397–417, 2018, doi:10.1016/j.powtec.2018.02.003.
- T. Roessler, A. Katterfeld, “Scaling of the angle of repose test and its influence on the calibration of DEM parameters using upscaled particles,” Powder Technology, 330, 58–66, 2018, doi:10.1016/j.powtec.2018.01.044.
- H. Nakashima, Y. Shioji, T. Kobayashi, S. Aoki, H. Shimizu, J. Miyasaka, K. Ohdoi, “Determining the angle of repose of sand under low-gravity conditions using discrete element method,” Journal of Terramechanics, 48(1), 17–26, 2011, doi:10.1016/j.jterra.2010.09.002.
- M. Khanal, M. Elmouttie, D. Adhikary, “Effects of particle shapes to achieve angle of repose and force displacement behaviour on granular assembly,” Advanced Powder Technology, 28(8), 1972–1976, 2017, doi:10.1016/j.apt.2017.04.016.
- H. Zhou, Z. Hu, J. Chen, X. Lv, N. Xie, “Calibration of DEM models for irregular particles based on experimental design method and bulk experiments,” Powder Technology, 332, 210–223, 2018, doi:10.1016/j.powtec.2018.03.064.
- F. Ye, C. Wheeler, B. Chen, J. Hu, K. Chen, W. Chen, “Calibration and verification of DEM parameters for dynamic particle flow conditions using a backpropagation neural network,” Advanced Powder Technology, 30(2), 292–301, 2019, doi:10.1016/j.apt.2018.11.005.
- E. Lajeunesse, A. Mangeney-Castelnau, J.P. Vilotte, “Spreading of a granular mass on a horizontal plane,” Physics of Fluids, 16(7), 2371–2381, 2004, doi:10.1063/1.1736611.
- R. Cabiscol, J.H. Finke, A. Kwade, “Calibration and interpretation of DEM parameters for simulations of cylindrical tablets with multi-sphere approach,” Powder Technology, 327, 232–245, 2018, doi:10.1016/j.powtec.2017.12.041.
- H.T. Chou, C.F. Lee, Y.C. Chung, S.S. Hsiau, “Discrete element modelling and experimental validation for the falling process of dry granular steps,” Powder Technology, 231, 122–134, 2012, doi:10.1016/j.powtec.2012.08.001.
- W. Rasband, ImageJ https://imagej.net/downloads.
- D. Höhner, S. Wirtz, V. Scherer, “A study on the influence of particle shape and shape approximation on particle mechanics in a rotating drum using the discrete element method,” Powder Technology, 253, 256–265, 2014, doi:10.1016/j.powtec.2013.11.023.
- G.R. McDowell, O. Falagush, H.S. Yu, “A particle refinement method for simulating DEM of cone penetration testing in granular materials,” Geotechnique Letters, 2(7–9), 141–147, 2012, doi:10.1680/geolett.12.00036.
- N. Stoimenov, J. Ruzic, “Analysis of the particle motion during mechanical alloying using EDEM software,” IFAC-PapersOnLine, 52(25), 462–466, 2019, doi:10.1016/j.ifacol.2019.12.583.
- X. Li, Y. Du, L. Liu, Y. Zhang, D. Guo, “Parameter calibration of corncob based on DEM,” Advanced Powder Technology, 33(8), 103699, 2022, doi:10.1016/j.apt.2022.103699.
- W. Tinsson, Plans d’expérience: constructions et analyses statistiques (Mathématiques et Applications, 67), 2011.
- E. El Ouardia, “Étude de la calcination du phosphate clair de youssoufia (Maroc),” Afrique Science: Revue Internationale Des Sciences et Technologie, 4(2), 199–211, 2010, doi:10.4314/afsci.v4i2.61676.
- N. Abdenouri, M. Hasnaoui, H. Mazouz, “Effective moisture diffusivity during the phosphate drying. modeling and experimental study,” Materials Today: Proceedings, 51, 2071–2079, 2022, doi:10.1016/j.matpr.2022.01.346.
- D.P. Maurice Pillet, François Louvet, “Plan d’expériences ” Definitive Screening Design ” , une alternative crédible aux plans composites centrés ?,” in Qualita 2017, Bourges, France, 2017.
- C.C. Design, I. Variable, R. Surface, J.S. Rao, B. Kumar, “Box-Behnken Design 3D Blade root shape optimization Meta-Model Development,” 2018.
- E. Daems, Frédéric and Lognay, Georges and Romnee, Jean-Michel and Froidmont, “Application du plan d’expérience de Box-Behnken et de la méthodologie des surfaces de réponses pour optimiser une méthode de quantification de phyto-œstrogènes dans les fourrages,” 2015.