Developing CubeSat and AI Framework for Crowd Management Case of Short-Term Large-Scale Events
 , Asrar Mohammed Mutawi, Ibtihal Abduljalil Turkistani, Lujain Khalaf Alqurashi, Maha Talat Fattah, Malak Tammam Almogher, Reem Shaman Aldaher, Ruzan Ahmed Wali, Wafa Muidh Almalki, Yusra Muhamed Almubayed
Adv. Sci. Technol. Eng. Syst. J. 7(6), 114–125 (2022);
 DOI: 10.25046/aj070612
Many consequences can be resulted in mismanagement of crowd, which might get people injured or even lose their lives. Thus, crowd management helps in controlling overcrowded areas during events, and allowing authorities to monitor, manage and reduce incidents. Space science and technology have made huge leap in crowd management, let alone when this technology integrated with Artificial intelligent. Hence, space-based systems like CubeSats are seen as the best approach to help monitoring and providing various reasons. For instance, wide coverage footprint, collect specific area data simultaneously, assist in aerial photography, as well as providing wide range of wireless communications services that can integrate appropriately with AI and wearable devices. This work aims to design a CubeSat vehicle to manage crowds during short-term, large-scale events. The proposed system is, also, coupled with AI framework along with the camera and wearable devices to monitor the crowds’ performance continuously by relying on two aspects: Firstly, aerial imaging (e.g., photos and videos). Secondly, using wearable devices that can be worn to monitor vital signs of crowds. Moreover, the proposed system can independently relieve congestion, as well as notify the ground controller of all problems to take further actions. The obtained results confirm that the proposed innovative solution is for crowd management with accuracy reached 95%, and MSE equal to 0.049.
1. Introduction
CubeSats are small cubic shape satellites designed in 1999 orbits around the earth in the (LEO) layer with is the low earth at +400 km height form the sea surface. These aerial nano vehicles can do missions despite their differences in size and structures (e.g., 1U, 2U, up to 6U), where mass ranges from 1k to 6kg. A CubeSat has two types of components Payload (which are the physical components of the CubeSat) and Platform (which are several systems to fulfil the mission). Unquestionably that CubeSat is less expensive than large satellites in terms of manufacture and launch, besides its close distance to the ground that gives advantages of rapid data transmission. Noticeably, these nano satellites are more accessible to various companies or even individuals since its affordable cost and short time to development and implementation [1-3].
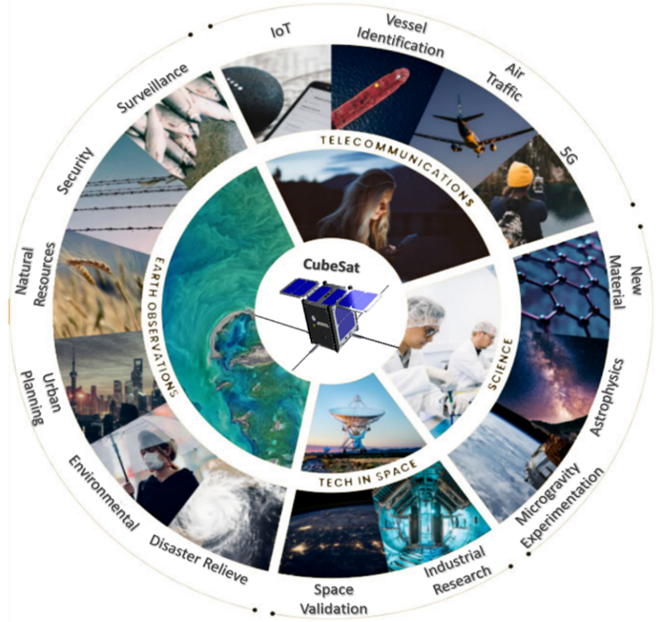
Figure 1: CubeSat wide range of applications.
The Fourth Industrial Revolution conceptualizes fast change to technology, industries, and societal patterns and processes in the 21st century. Where it changes the way businesses operate in daily tasks with information technologies, allows improving operations, decreasing costs, improving the quality of life and processes. Including Artificial Intelligence (AI), Internet of Things (IoT), Internet of Medical Things (IoMT), and wearable devices. These technologies can integrate with CubeSat and deliver wide range of smart applications. Figure 1 demonstrates Cubesat wide range of applications that around topics like telecommunications, science space, and earth observations [4-6].
Temporary event or short-term large-scale events (e.g., sports, social, cultural) require an extra measure of planning, coordination, and management; thus, they can heavily benefit from CubeSat and its wide range applications such as commercial applications (e.g., telecommunications, remote sensing, high-resolution aerial imagery, ship tracking and monitoring). Additionally, such small satellites help in more domains like [7-9]:
- Technology demonstration in strict environment of space to test new instruments or materials.
- Academia and educational projects to get a unique hands-on experience in emerging space undertakings from design to launch and operations
- Crowd management via integration between an aerial imaging capability with AI that help to describe crowd movements, issue early warning, and then take actions. Where authorities and countries need to manage the crowds’ events especially those large-scale short-term events, where the safety and security of people must be ensured.
Many authors have stressed the that the research on CubeSats for communications is still in its early phase. IoT, Internet of Space Things (IoST), low-power long-range networks, Iridium communications, earth-remote sensing, and machine learning are opened research areas for CubeSats. The following section 2 presents related study review work in support to the design; then concludes by highlighting research gaps and our own research motivations. Section 3 describes the proposed model design from communication and serious gaming perspectives. Then, evaluation of the proposed framework and discussing results is presented in section 4. Section 5 concludes.
2. Related Study
This section presents a representative illustration of the related research works in the literature, where a set of criteria have been used to meet this research’s scope. The criteria of this related study include different aerial platform type, aerial imaging and crowed management using AI techniques at low-altitude missions. This section concludes by highlighting research gaps and draw our own research motivations.
Researchers in [10] have proposed a framework via Unmanned aerial vehicle (UAV) for Crowd Control and Health Management System (CCHMS). The CCHMS system consists of two subsystems. The first is a Disaster Control and Management System (DCMS), which aimed at reducing the risk of stampedes and other disasters; while the second is a Healthcare Management System (HMS) to ensure safety and wellbeing of people in crowded zones. Their system is used various kinds of wireless and mobile tools including: Fog Computing, Smart Phones, Smart Digital Street, IP-Cameras, Radio Frequency Identification (RFID), Voice Alarm, Light Alarm, and Global Positioning System (GPS). The Proposed Algorithm for Stampede Detection (ASD) depends on integration among the number of objects, edge detection, and Hough transformation to ensure higher reliability when sending notifications to human observer in order to take suitable decisions and actions promptly. We noticed that the accuracy of headcount by ASD was more than 94% in most of ASD applied to a virtual image.
Authors in [11] followed a predictive approach to crowd analysis via ground camera, where they tend used geometric methods such as ORCA system to struggle in medium density scenarios where agile manoeuvres are important and it is provide to estimate the accuracy of the simulation for a particular crowd situation. This technique is based on scanning the area and then identifying the crowd and its density, finally tracking it.
A crowd counter technique is introduced in [12] that counts the crowds’ heads using a Canon crowd counting technology. Obtained results show that using this a high-quality network camera in conjunction with AI framework offered a notable advantage of minimal distortion and a high-resolution result. Attention-Based Real-time CrowdNet (ARCN) decoding model is presented in [13], which is a computationally efficient density estimation-based crowd counting model that perform crowd-counting from UAV images in real-time with high accuracy. The key idea of this model is to add a “Convolution Block Attention Module” (CBAM) blocks between the bottleneck layers of the MobileCount architecture to focus on crowds and ignore background information of the obtained images. The proposed ARCN model achieved low error rates as it was a Mean Absolute Error (MAE) of 19.9 and Mean Squared Error (MSE) of 27.7.
Researchers in [14] presented a study for crowd monitoring system using UAV that equipped with sensors, and communication infrastructure to transmit sensory data to a control station. This can be done by estimating and geo-referencing of the crowd density levels using image processing tools. The process starts with people detection using image segmentation and geo-referencing for mapping the crowd levels. Then, the density of the crowds can be estimated through converting segmented images into binary images. Where these imaged appear as white region, while other images feature appear in black colour to calculate image properties (e.g., area). The proposed work showed that the image segmentation used can detect and distinguish people and estimate crowd-level density with good results. However, the position and direction of camera movement on the UAV should be optimized.
Authors in [15] use a real-time crowd monitoring and management system to classify social distance using YOLO V4 object detection technology. The detected people are tracked by surrounding boxes using Deepsort, overlapping sites become symbolize high density. The whole system is about social distance detection, network design, deep sorting-based tracking, and distance classification algorithm. Results seem reasonable only for short range distances using cameras installed via ground camera.
Researchers in [16] propose a method to manage the crowd by keeping track of the count of the people. They have developed a system using a Raspberry Pi 3 board that consists of an armv8 CPU to detect human heads as dots and provide a count of humans in the region using OpenCV-Python. Human tracking is achieved by indicating the direction of movement of a person. The obtained results showed an average level of accuracy where not every head in the frame was detected.
Researchers in [17] proposed an approach for crowd counting method called SCNet via drone images. The method based on cascaded deep convolutional neural networks (CNN). It works by extracting high-level features to generate density maps that represent an estimation of the crowd count with respect to the scale variations in the images. A dataset named ViseDrone2020 used for training and testing of the proposed method. The evaluation process was done by comparing the proposed method with ten state-of-the-art methods, in addition to testing the proposed method on different datasets and noisy images. The experiments shows that the proposed model (SCNet) was more efficient for crowd counting and the quality of the density map. Besides the quantity of the crowd count estimation was comparatively better than other existing methods without the presence of noise.
In [18], low-altitude aerial images collected by a UAV that integrated with an AI model was presented to count crowds in a specific situation. The basic idea of their approach was to deploy an end-to-end CNN model to generate a density estimation map on edge of AI devices. They evaluated a range of neural network architectures to find ones appropriate for on-board image processing using edge computing devices. Through these experiences, it has been concluded that using a Xavier NX platform shows a sufficient computational power with good accuracy. Also, noticed that the accuracy of the input image greatly affects the prediction quality and should be considered an important factor before moving on to a more complex neural network model to improve accuracy.
Authors in [19] proposed an approach for tackling crowd management via satellite. Many modules have been proposed for crowd management, some were visual sensing methods such as satellite images, video sequences or infrared thermography; while others were non-visual sensing methods such as smart bracelets or hotspot Wi-Fi in smartphones. The proposed collaboration was between satellite images, thermography, and wearable devices. Results of the proposed system showed high accuracy for proper crowd management. Yet, crowd density should be calculated in a real-time to make decisions.
Authors in [1] proposed a novel lightweight and fast convolutional neural network (FCN) to learn a regression model for crowd counting via images captured from drones. A learning system was initially based on a multi-input model trained on two different views of the same input. First, real-world images; Second, corresponding synthetically created “crowd heatmaps”, which was used to help the FCN focusing on the most important parts of the images. The derived model achieved promising results on the tested images. Researchers in [20] developed an automatic people counting system using digital image processing technique that integrate with a drone called “Otsu’s method”. The captured images were firstly compared between RGB and HSV colour model. Then, the HSV colour model has been chosen for the thresholding process due to its high accuracy. Results of the proposed system has achieved a good image processing with total accuracy of 91%.
Authors in [21] present a multi-UAV for crowd monitoring system to monitor group of moving walking individuals using an auction paradigm that distribute targets among UAVs and genetic algorithms. The monitoring aims to track and record the position of targets, where all targets should be visited during a surveillance period and reducing time between the visits made to each target. The system can be used for law enforcement applications, helping authorities monitor crowds to identify and track suspicious individuals. System results show a good performance under various situations.
A decision-making process on board a UAV was proposed in [22] to enhance search and rescue operations during natural or man-made catastrophes via multi-agent architecture. It was used to deploy multi-agent systems aimed at retrieving and analysing information by using mobile robots, which are usually UAVs, and for providing support to the decision-making process in environments affected by natural disasters. The architecture has been structured into layers provides communication and cooperation mechanisms among agents and envisages defining a set of agents with different roles. This work shows a good example when using space-based system for aerial imaging that serve different purposes.
Researchers in [23] used a Digital Elevation Model (DEM) to detect individuals in crowded areas from very high-resolution satellite images using street classification approach. The proposed approach aims to eliminate high objects on streets using shadow information, and using DEM of the region, which is automatically generated using stereo satellite images to eliminate buildings. After applying feature selection using selected local features as observations, a probability density function (pdf) was generated. Obtained pdf helps detecting crowded regions and some of the individual people automatically. Results indicate the possible usage of the proposed approach in real-life for mass events to provide a rough estimation of the location and size of crowds from satellite data. Table 1 shows a comparison of the related research windup.
Table 1: Related study wind-up.
| Ref. | Platform | Intelligent Framework | Contribution | Issues |
| [1] | UAV | FCN | Lightweight and fast convolutional
method to create heat maps of crowds to enrich the semantic contents |
Images should be enhanced, while maintaining computing power & real-time response |
| [10] | UAV | CCHMS | Higher reliability and accuracy of headcount | Short distance, and limited crowds |
| [11] | Ground Cameras | ML | Crowds are represented as dots for better crowd management | It is not clear if the crowd is passing through a confined space |
| [12] | UAV | AI | A counter on several cameras that count crowds & represent them as dots | Coordination and well- mounted cameras are needed for better coverage |
| [13] | UAV | CNN | Good level of accuracy | Complexity and Giga flops increase |
| [14] | UAV | Image processing tools | The control station processes the sensory data and if any urgent situations noticed, alert the field staff | Similarity in colours of the surrounding setting lead to less crowds management |
| [15] | Ground Cameras | DL
& Tracking Techniques |
Prevention of Covid-19 in public places | Due to short monitoring distance complexity increases and more cameras is required |
| [16] | A camera on walls | OpenCV-Python | Average level of accuracy | The camera cannot track in large or crowded places |
| [17] | UAV | CNN and VGG-16 | Density map quality and crowd count estimation are comparatively better than other existing methods without the presence of noise | Increase UAV altitude, and weather conditions would affect accuracy and increase noise |
| [18] | UAV | CNN | Good level of prediction accuracy | UAV altitude affect the quality of the prediction, it should be optimized |
| [19] | Satellite | Image processing tools | Combination between two or more different image processing tools creates accurate results. | – High complexity, so optimization is needed
– High altitudes reduces resolution |
| [20] | UAV | Otsu’s | Successful estimation of crowds and good image processing with total accuracy | Difficulty to remove the unwanted objects from images less than 2500 pixels |
| [21] | UAV | GAs | Good level of monitoring the position of individual targets | Complexity and delay for processing |
| [22] | UAV | Multi-agent | Good performance for fusing info to assess the level of risk | Natural disasters could affect the UAV performance due to low altitude |
| [23] | Satellite | DEM | Detect crowds automatically and remotely with very high-resolution | DEM images lead to the inability to determine the crowds properly |
Based on the wind-up related studies on Table 1, the research gaps have been identified, so we draw our own research motivations and proposed model. To our best knowledge and based on the related study, no work has been done to have a fully CubeSat that integrate with integrate properly with AI and wearable devices for crowd management in short-term large-scale events and help in making smart decisions. Therefore, our proposed novel contribution is motivated to cover this gap, and to achieve such an aim the following objectives need to be pursued:
O1. Designing CubeSat platform with its software and hardware capabilities for crowed management.
O2. Developing an AI framework to integrate with CubeSat and wearable devises to monitor crowds and their health status.
O3. Manufacturing and implementing intelligent CubeSat.
3. Proposed System Model
The consequences of poor crowd management are catastrophic, where people can be injured or lose their lives. Therefore, crowd management aims to provide a healthy environment that adheres to the highest standards of prevention and safety. It is rational to consider advanced technologies to design a system that can fulfil the crowd management. This paper is aimed to manage crowds and monitor their health status in temporary events using integrated AI framework, and wearable devices that worn by terrestrial crowds. This has been done by coupling a fully autonomous CubeSat that paired with Histogram of Oriented Gradients (HOG) and OpenCV techniques that work harmoniously together to enhance crowed management. Using wearable devices that can be worn to monitor vital signs of crowds. Moreover, the proposed system can independently relieve congestion, as well as notify the ground controller of all problems to take further actions. This section is mainly focusing on two parts, which are: conceptual model, followed by mathematical calculation of the proposed system.
3.1. Conceptual Model
The proposed system has a CubeSat with its payloads to manage crowds of temporary events using integrated AI framework, and wearable devices that worn by terrestrial crowds. The integrated system can be visualized as per Figure 2, which consists of the space segment and ground segment. The former has a CubeSat platform with its payloads including an ultraHD camera paired with the proposed AI framework, a GPS sensor, a transceiver module, which is responsible for wireless communication between the CubeSat and ground segment before transmitting the gathered data to the cloud for further storage and analysis. The latter segment includes a Ground Control Centre (GCC), which acts as a focal point between two segments and host gateways to external networks. This segment deals with the wearable device that worn by terrestrial crowds to monitor vital signs, which in turn help detecting health status of them and then give solutions and/or take actions when needed.
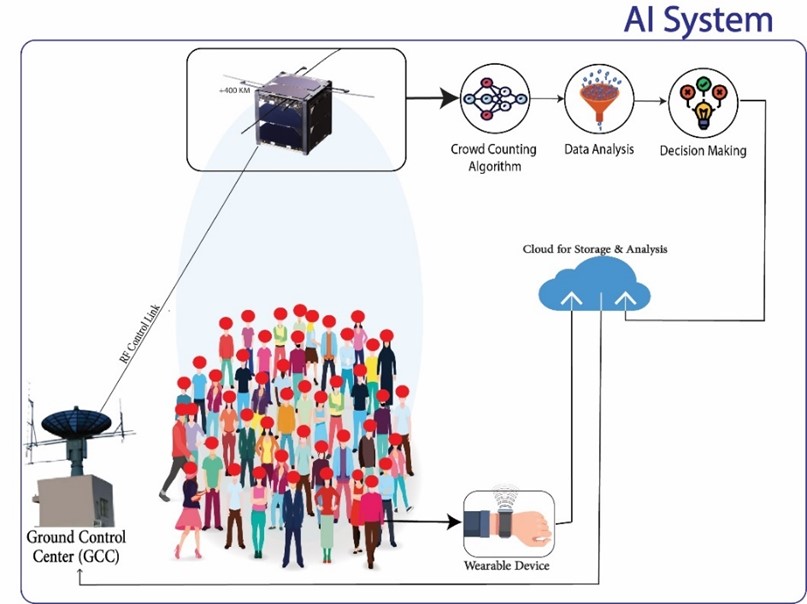
Figure 2: Proposed Work System.
The CubeSat is responsible for collecting multimedia data and then transmitting them to the cloud for proposing and storage. The CubeSat along with its integrated AI system will take a picture of the crowds and treat them as dots. Additionally, the proposed system includes a crowd counter algorithm to calculate the crowded area. Then, analyses of these data to make appropriate decision, which can be predefined actions, which makes crowd management much easier as there is no need for human intervention in some situations. For instance, guide the crowds towards empty paths, open and /or close the doors. Through wearable devices that allow us more accurate results not only by monitoring health status of the crowds, but also in counting them via Wi-Fi sensors that can be distributed in the target area. It is worth to mention that the cloud should deal with two inputs: input from the CubeSat, which provides aerial imaging and numbers; input from the wearable devices. The data can be visualized and analysed in the database associated with the user interface.
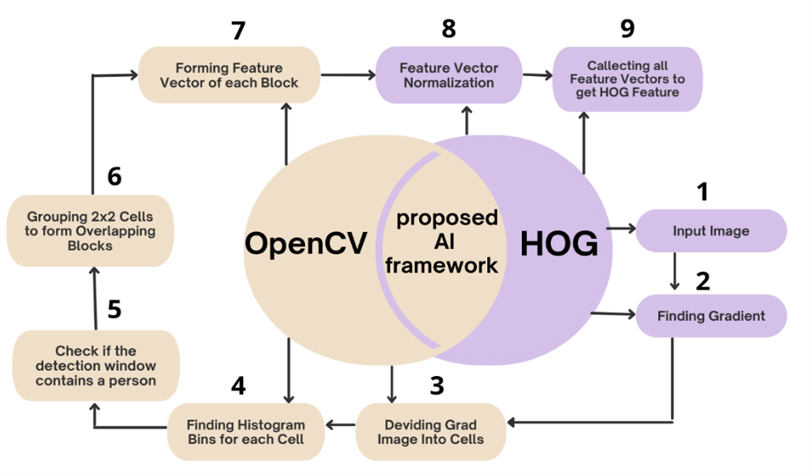
Figure 3. The Proposed System Algorithm.
The proposed AI framework consist of two brains as per Figure 3; First, the HOG, which is responsible for the Accumulated method to count the crowds and deal with them as dots. It directly extracts feature from the scene and uses a regression model to map the relationship between the extracted features and the people count does not need to precisely detect each individual or track every motion pattern. Which is more flexible and scalable. The HOG prosses starts by dividing an aerial image into cells and localize features are extract from each cell region. Second: Using the OpenCV library, the SVM classification is applied to decide if the detection window contains a person using the block histograms. Every cell needs to train a regression function mapping localized features to local count and the global count is obtained by accumulating all the local counts processing speed is proved to be fast enough for real-time application.
The workflow of the proposed system focuses on the collaboration between multimedia that obtained from the CubeSat and wearable devices to manage the crowd. Where the CubeSat can cover a large footprint area as well as participate in making decisions to manage the crowd; While the wearable devices integrate with CubeSat and help identifying people as points and keep them connected to the Internet and transmit their health status, besides help in monitoring the crowds. The proposed system workflow as the following steps:
- CubeSat start operation by monitoring a targeted area,
- CubeSat counts the crowds and consider them as dots using HOG framework,
- Wearable devices start operation by monitoring the crowds’ health status,
- The proposed AI framework analyses multimedia to understand crowd conditions and detect health status,
- When actions needed, solutions would be either predefined actions, or admin actions,
- Notifications should be sent regularly to the GCC.
3.2. Mathematical calculation
This subsection gives a mathematical outline of both the link budget predictions, as well as the proposed AI framework [24-29]. Regarding the link budget predictions this would include Free Space Path Loss (FSPL), Receiver Signal Strength (RSS), Signal to Interference and Noise Ratio (SINR), and Throughput. Used FSPL assumes a transmit antenna and a receive antenna to be located in an otherwise empty environment. Neither absorbing obstacles nor reflecting surfaces are considered. In particular, the influence of the earth surface is assumed to be entirely absent. RSS it is a measurement of the discrepancy between the data and an estimation model and when the receiver moves away from the transmitter RSS helps to estimate the coverage range when the signal weakens. SINR is a measure of Signal Quantity and Interference and Noise Quantity RSS is effective through distance, when distance increase RSS decrease. Throughput is the amount of data received by the user in a unit of time. Therefore, equations of the link budget predictions can be seen as per equations (1) to (4):
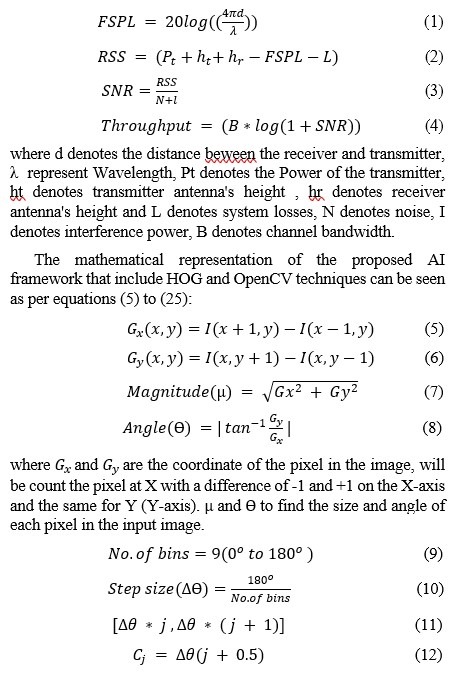
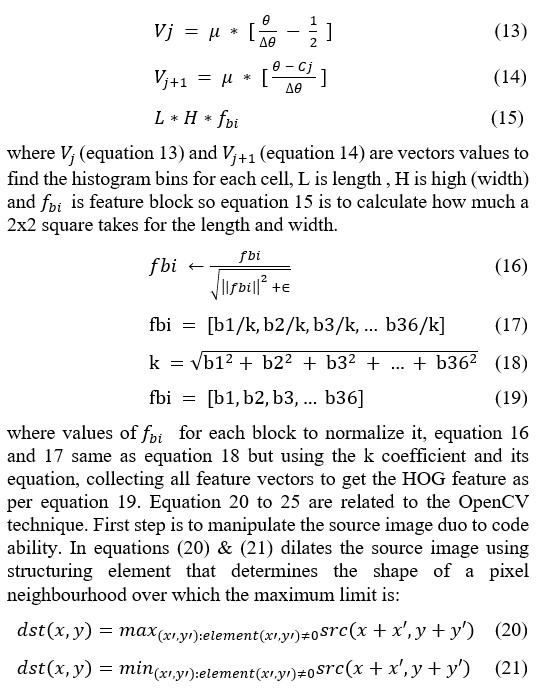
Each part is divided into cells (there is no specific number to choose cell, the larger the image, the more cells), and each cell contains dots, and each dot is a bin, so will be use equation 9 (No. Of bins) and 10 (ΔƟ) to find number of bins, equation 11 is to find bin boundaries, finally (equation 12) is to find centre of the bin, then will be collect all the cells, the block, the features and convert them to vector.
where src is the input image; the number of channels can be arbitrary, dst is output image of the same size and type as src.
Then, by using equation (22) the horizontal and vertical lines are detected over the image and the lines intersection point. The histogram of src is calculated. Considering that the sum of histogram bins is 255.
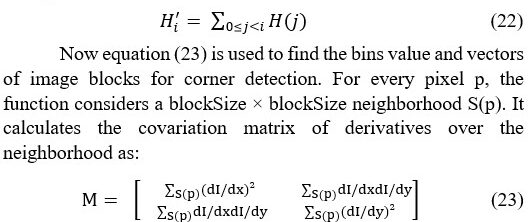
After that, it finds vectors and values of M and stores them in the destination image as (λ1, λ2, x1, y1, x2, y2). Where λ1, λ2 are the non-sorted values of M, x1, y1 are the vectors corresponding to λ1, x2, y2 are the vectors corresponding to λ2. Then, for each pixel (x,y) a 2×2 gradient covariance matrix M(x,y) over a blockSize×blockSize neighbourhood is calculated as the local maxima. Then, the horizontal and vertical lines are used to detect people which is compute as following is equation (24):

where XblockSize is neighborhood size, k size is the aperture parameter for the Sobel operator, and BorderType is pixel extrapolation method.
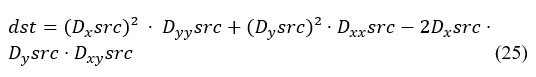
Equation (25) calculates the complex spatial derivative-based function of the source image. If the source image size was 224×244 pixels so it will be return to 224×224 pixels after being manipulated to detected people.
4. Simulation and Experimental Setup
This section aims to present the main components of simulating the proposed system. Then, outlining the hardware specifications of the experiment setup and the testbed structure. Figure 4 shows the CubeSat network communication architecture using Satellite Communications Simulation Toolbox in MATLAB. It is very useful tool to simulate, analyse, and visualize the motion and dynamics of CubeSat. This simulation toolbox provides standards-based tools and enormous parameters and network configurations for designing, simulating, and verifying satellite communications systems and links. This simulation step is vital to get early link budget predictions of the proposed CubeSat from perspectives of communication, size, and animation properties, before start manufacturing the CubeSat structure using 3D printers.
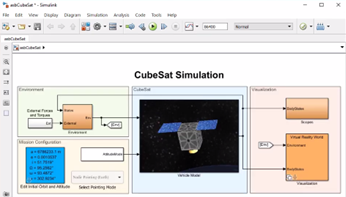
Figure 4: CubeSat network communication architecture.
Figure 5 shows the final CubeSat installation with all its hardware elements. We can see that the CubeSat contains kit of Cubesat: Structure, Raspberry Pi 4B, lens Camera Module, GPS Module, Wi-Fi Module (Transceiver), Power system includes power management, Solar Panel Cells and Battery; a HD camera is used for aerial imaging, GPS sensor for coordinating location of the CubeSat, a 5GHz module transceiver module to connect the drone with the GCC, a power system receives power from two sources that have been connected to a power management: Source 1: Solar Panel Cells that covers the CubeSat structure; Source 2 Battery as pack up if solar power somehow gets too low. All these hardware components are connected to the Raspberry Pi 4B microcontroller, which is fitted onboard the CubeSat.
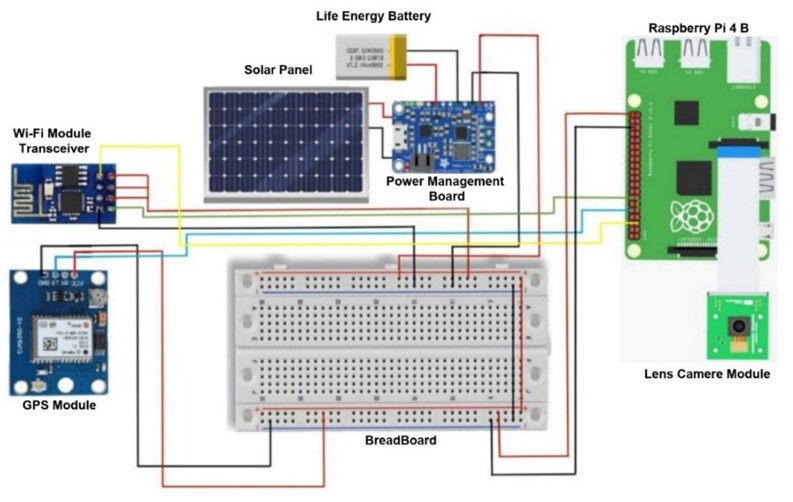
Figure 5: CubeSat Connection Diagram.
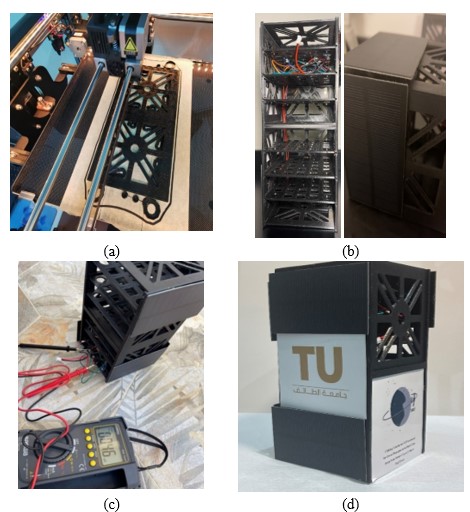
Figure 6: CubeSat structure, components, calibration, and final CubeSat platform.
Figure 6 (a) shows the CubeSat structure that is fabricated using a 3D printer, (b) represents the CubeSat structure when installing solar panels and other hardware components, (c) demonstrates the CubeSat platform under calibration and functional testing, (d) displays the final CubeSat platform. For the sake unification with global stranders, the CubeSat has been designed to meet the size and the weight capability of the 2U CubeSat, which is 10 cm × 10 cm × 22.70 cm; yet scalability is possible to be structure size of 3U, 6U, or 12U. The experiment was taken place in Taif city, Saudi Arabia, under supervision from Computer Engineering department at Taif university on the 9th of May 2022 at 15m altitudes. The experiment’s longitude and latitude are 40.4867323, and 21.3320348, respectively. A mission planner VNC software has been used when floating the CubeSat.
- Human dataset.
- Non-human dataset.
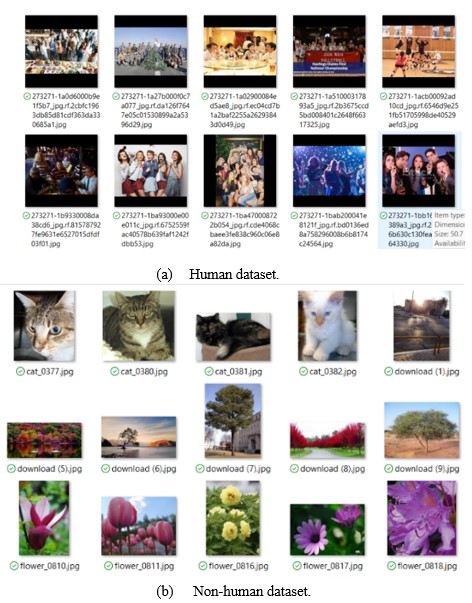
Figure 7: Samples of the dataset.
1700 images used as dataset, where 70% for training, 15% for testing, and 15% for validation. Figure 7 shows a sample of the dataset that includes (a) human dataset, (b) non-human dataset. The dataset is sourced from [30-34]. The sample of these two types has been chosen to make the model able to differentiate better between people in crowds and other elements. Another consideration has been taken is that dataset contains different crowds in different places and locations to train the model more precisely.
5. Implementation and Discussion
After defining the main parts of the proposed CubeSat design system along with the main structure of the testbed, this section highlights simulation predictions and practical measurements, respectively.
5.1. Simulation Predictions
The role of this subsection is to summarize and analyse simulation results of the proposed system in a way that will yield maximum insight and help with decision-making when implementing the model practically. So, a simulation work of the proposed CubeSat system has been discussed from two angles:
- Communication
- AI accuracy
5.1.1. Communication Predictions
The simulation has considered 5G multiple-input and multiple-output (MIMO) antenna to enhance diversity performance of the channel capacity, and therefore boost the reliability of wireless communication via the CubeSat. Such a consideration would not only contribute effectively to a last-mile connectivity, but also helps in reducing power consumption. Simulations have been done using Satellite Communications Simulation Toolbox in MATLAB. This subsection provides a description and interpretation of the simulation predictions based on the 2U CubeSat structure.
Figure 8 illustrates the predicted results of the PL, RSS, SINR, and T via the PL propagation model at CubeSat’s altitude of 400km, where neither absorbing obstacles nor reflecting surfaces are considered. The PL predicted result, where this parameter is seen as a crucial factor to monitor channel model performance and footprint range. The obtained PL are below the maximum permissible, which is 157dB. Clearly, PL increases with distance.
The RSS predicted result is mathematically depends on PL, so both predicted results appear comparable characteristics. Obtaining RSS help in approximating the coverage range, so wireless signals get weaker as the receiver moves away from the transmitter (the CubeSat in our case). The produced RSS were within the acceptable range and below the threshold, which is 140dBm. Boosting the RSS requires tunning of different parameters like transmission power to be increased. Yet, this might reduce flight time, so compromise should be applied. The SNR predicted result demonstrates a vital parameter that seen as a wireless link quality indicator. The SNR value is ranging between upper and lower bounds, where above values are viewed as wasted transmitter power, while lower ones are considered undesirable [35-38].
The predicted result of T considers as a vibrant parameter for livestreaming and/or HD multimedia transmission. Predicted result achieved high level of T that ranges around 70Mb/s at altitude of 400km, where there is a negative correlation with distance increase. Another observation is that using 5G MIMO antenna with its diversity capacities has helped in enhancing the throughput predictions.
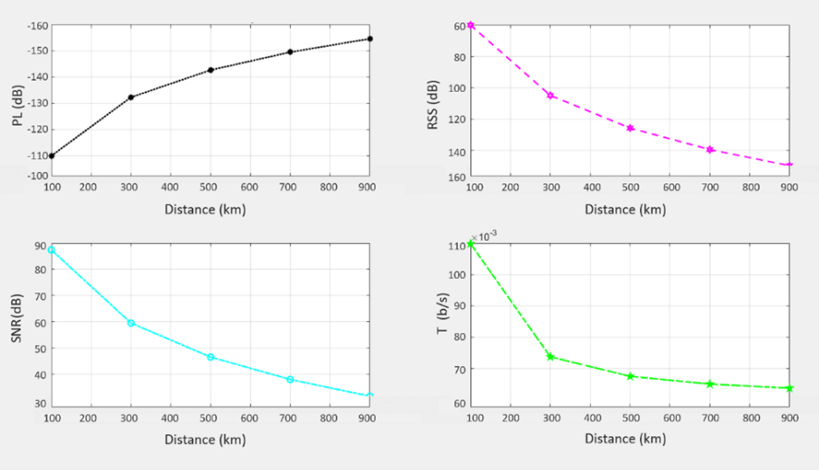
Figure 8: Link budget parameters of simulating the CubeSat.
Overall, the simulated propagation models and their generated predicted results of the full range of link budget parameters has been carried out at to monitor system performance, network planning and coverage to achieve perfect reception of the FSPL propagation model. Since this model is heavily depends on a Line of Sight (LoS) connectivity when calculating the link budgets, thus, it experiences less effect of shadowing and reflections, which in turn leads to wider coverage footprint. Unsurprisingly, reasonable results of link budget parameters would help in bridging wireless communication links between the CubeSat and GCC, ground users, as well as wireless to the cloud for storage and analysis in an efficient and timely manner [39-43].
- AI Accuracy Predictions
The proposed AI framework trained with dataset contains 2000 different images that been sourced from [44-46]. The dataset was divided as dataset 70% training, 15% testing, 15% validation. The simulation conducted using Python in visual studio code software. Mean Sequard Error (MSE), Confusion matrix for classification, and overall accuracy are the main performance indicators that used to evaluate the proposed AI model. The proposed AI framework trained into two stages:
First stage of training aims to focus on making the model differentiate between images that contain people or not using the HOG algorithm. Where after training, the accuracy reached 95% as Figure 9 shows.
Second stage of training aims to focus on crowd management, where it divides any crowd into three situations with a different colour represent each one: Normal, Medium, and Dangerous, as Table 2 shows. The number of people is adjustable and considered here for simplicity. Thus, an interface that developed by Anaconda3 specifically QT Designer tool software to show the result of via a detected image, so the interface shows the situation and them a suitable decision can be made.
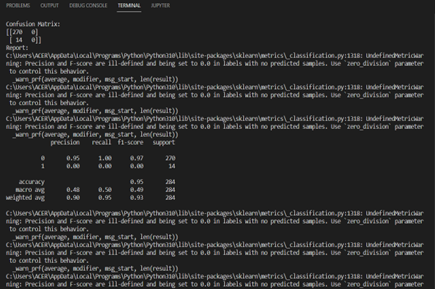
Figure 9: MSE accuracy of the trained AI model.
Table 2: Three situations of crowd management.
| Situation | Means | Action |
| Normal Situation | People < 15 | Watch only – no action is needed |
| Medium Situation | People 15-35 | Warning: a crowd began to form |
| Dangerous Situation | People > 35 | Alarm: take actions |
5.2. Practical Measurement and Implementation
This subsection presents the experimental results when implementing the proposed system. Where results are presented from two perspectives: Communication; then AI Accuracy, respectively. The launch of our CubeSat cannot be attained using a rocket since this need long logistics with national authorities. So instead, a trial launch of our CubeSat has been done with a tethered balloon that inflated with helium gas and anchored to the ground with a polyethylene rope. This simulates the aerial space environment with more control of the CubeSat platform. Before the launch, the weather forecast has been checked to ensure stability of both the CubeSat and the tethered balloon; hence, better connectivity and high multimedia resolution.
Figure 10 illustrators the implementation of the proposed CubeSat with it all payload components at 15m altitude. To check crowd management performance, some people have been gathered to check different crowding scenarios. Two communication software were utilized in this implementation: Acrylic, and Netspot. The first software uses 5G Wi-Fi Module, which is a complete set of Wi-Fi to diagnose the Wi-Fi performance including Wi-Fi coverage, security analysis and networks. The second software is used to collect all the details about the surrounding Wi-Fi networks and presents the wireless data as an interactive table. This allows to troubleshoot and improve your network coverage, capacity, performance, access point configurations, signal level, interference, noise, and many others.
Results from communication perspective are shown in Figures 11 and 12, where they present communication performance indicators of the proposed CubeSat to 5G Wi-Fi ground station at 15m altitude. Figure 11 shows the RSS and signal coverage levels using the Acrylic tool. The obtained RSS shows a reasonable average -75 dBm, where wireless signals get weaker as the receiver moves away from the CubeSat. It is worth to mention that RSS depends on PL, so both results appear comparable characteristics. Obtaining RSS help in approximating the coverage range, and strength. Figure 12 shows SNR is seen as a wireless link quality indicator. The obtained SNR result floats around 56 dB, which is a desirable value and viewed as acceptable level of power consumption.
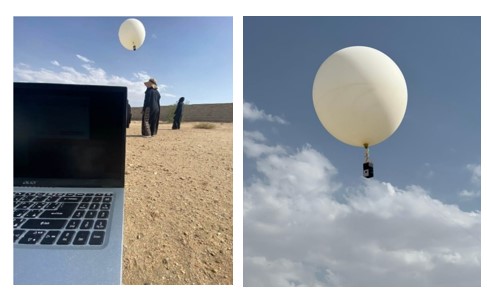
Figure 10: implementation of the proposed CubeSat with it all payload components.
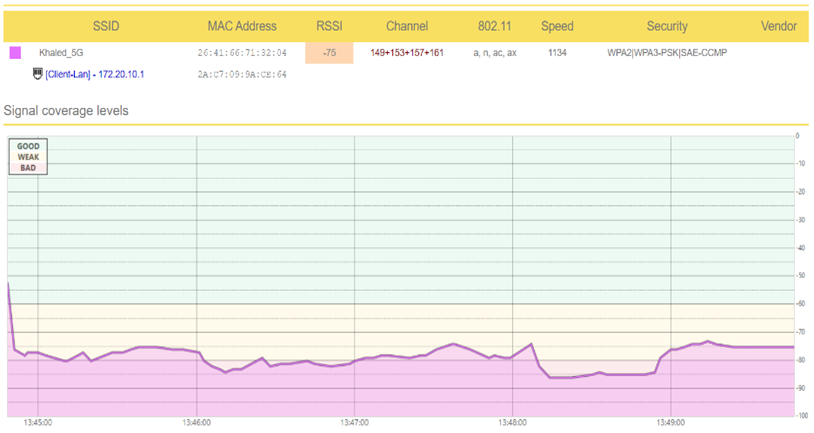
Figure 11: RSS and signal coverage levels of the proposed system using Acrylic tool.
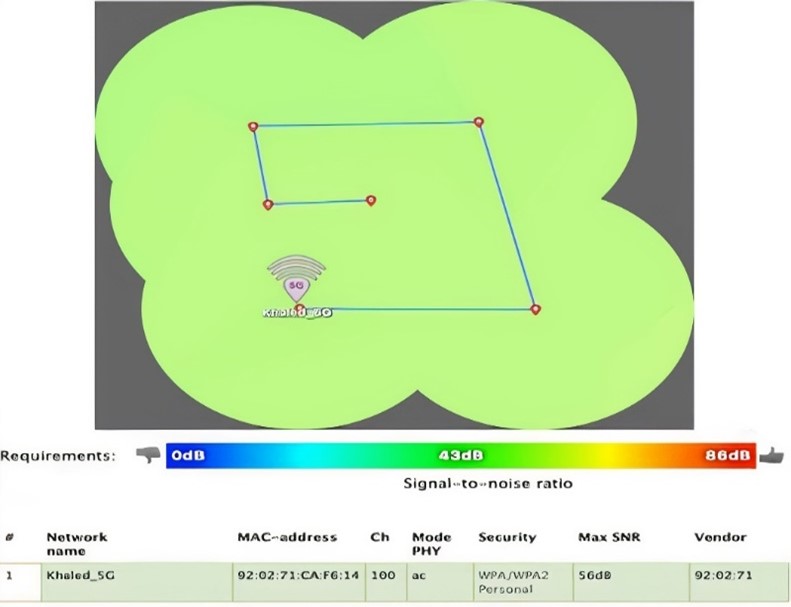
Figure 12: Signal & Noise of the proposed system using NetSopt tool.
Results from the AI framework performance perspective are presented in Figure 13 where it shows three crowd situations with a different colour represent each one. These three different situations have been evaluated from an altitude of 15m above the ground where the CubeSat locates. The first situation is being represented in green, which is normal status, so watch only – no action is needed. The second situation is yellow, which means a briefed action is needed. The third situation is red, which means dangerous, and actions must be taken. Where actions can be done by admin, and/or can be pre-defined ones, so the platform (CubeSat in our scenario) can act without the admin intervention (e.g., automatic opening or closing doors, directing people to alternative routes).
To note, the proposed AI framework includes the HOG technology, which enables tracking and detecting the places of people as dots to monitor the crowds. This has been completed with an efficient timeframe that does not exceed 4 seconds. Overall, all these three different situations have performed well based on the thresholds that have been assigned for each one. Another observed point is that the proposed AI framework deal with crowds as dots, which means it can count the number heads and send emergency alerts if needs be.
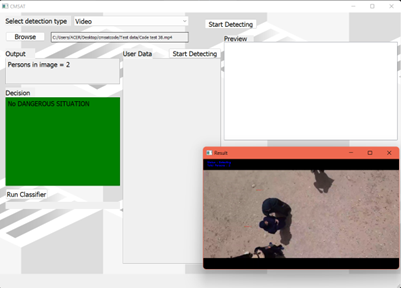
(a) Normal situation
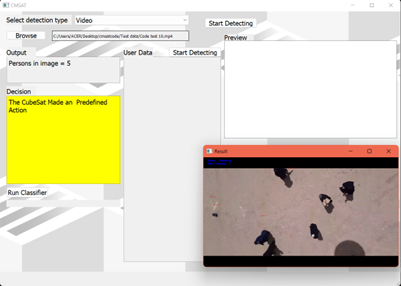
(b) Medium Situation
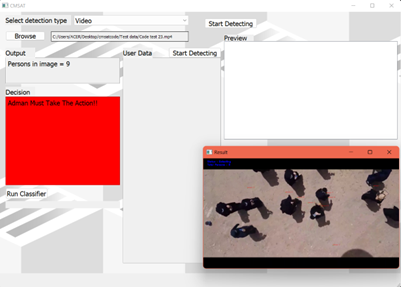
(c) Dangerous Situation
Figure 13: Three situations of crowd management using the proposed AI framework
Figure 14 shows that the crowds’ health status has direct link to crowd management. Hence, when crowds’ health status is good, that means no sequences happen that may affect the crowd management, as Figure 14 shows. On the other hand, in case of a health status of an individual inside the crowd is above the threshold (e.g., high temperature) the CubeSat take actions to manage the crowd correctly, which in turn can save lives. An example of this case, when the CubeSat locates the effected individual inside the crowd, send a notification to paramedics to provide the proper healthcare, besides if the CubeSat get linked to electronic doors to implement the decision to open and close the doors so that the congestion does not reach the stage of danger.
For sake of validation, a comparison graphic is shown in Figure 15 between the proposed system in relation to existing ones. Where it compares between to the MSE against signal to noise ratio (SNR). The average evaluation of the MSE at MSE shows that the proposed system is better than the other ones, where SNR is 12dB; While FCN and CNN recorded 21dB and 13.5dB, respectively. Clearly, the obtained value of the proposed system indicates 5% to 40% of an enhancement degree.
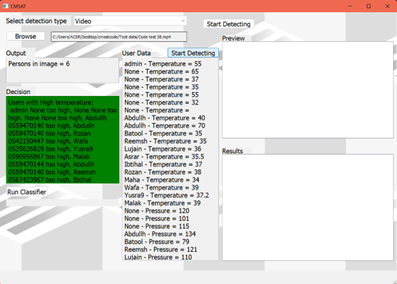
Figure 14: Crowds’ health status.
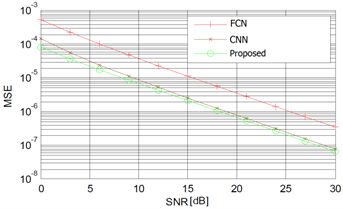
Figure 15: Crowds’ health status.
6. Conclusion and Future Work
To produce and organize a successful massive event, it requires set of procedures and planning to allow the crowds move in harmony and order. Therefore, developing an advanced system plays an important role in analysing the movement features of the crowds in crowded events and alerting about an ensuing stampede. To have such a system could reduce human intervention, help in ensuring security and safety of individuals and manage crowded areas by taking the necessary decisions in an efficient and intelligent manners effort. This paper aims to develop to create a CubeSat vehicle that contains an integrated with AI framework to manage crowds a short-term, large-scale events.
Both software and hardware capabilities have been considered in this work to monitor and evaluate various performance indicators of the proposed system. Preliminary results are shown the effectiveness of the proposed CubeSat with AI framework. Work has been done to train and test the algorithm and to ensure the highest accuracy rate and the lowest error rate. Developing an intelligent aerial inspection for crowd management can extended in the future to include multilayer aerial system (e.g., drone, balloon) for more heterogenous capability. Additionally, full deployment of these space-based vehicles and send them to space for real-life trail.
Conflict of Interest
The authors declare no conflict of interest.
Acknowledgment
The authors are grateful to the Deanship of Scientific Research at Taif University, Kingdom of Saudi Arabia for funding this project through Taif University Researchers Supporting Project Number (TURSP-2020/265).
- G. Castellano, C. Castiello, M. Cianciotta, C. Mencar, G. Vessio, Multi-view Convolutional Network for Crowd Counting in Drone-Captured Images, 588–603, 2020, doi:10.1007/978-3-030-66823-5_35.
- I.U. Zaman, A. Eltawil, O. Boyraz, “Wireless Communication Technologies in Omnidirectional CubeSat Crosslink: Feasibility Study and Performance Analysis,” IEEE Journal on Miniaturization for Air and Space Systems, 2(3), 157–166, 2021, doi:10.1109/jmass.2021.3079102.
- F. A. Almalki, “Comparative and QoS Performance Analysis of Terrestrial-aerial Platforms-satellites Systems for Temporary Events,” International Journal of Computer Networks & Communications, 11(6), 111–133, 2019, doi:10.5121/ijcnc.2019.11607.
- S.A. Alhusayni, S.K. Alsuwat, S.H. Altalhi, F.A. Almalki, H.S. Alzahrani, “Experimental Study of a Tethered Balloon Using 5G Antenna to Enhance Internet Connectivity BT – Intelligent Computing,” in: Arai, K., ed., Springer International Publishing, Cham: 649–663, 2021.
- F.A. Almalki, B.O. Soufiene, “Modifying Hata-Davidson Propagation Model for Remote Sensing in Complex Environments Using a Multifactional Drone,” Sensors, 22(5), 1786, 2022, doi:10.3390/s22051786.
- C. Essid, C. Abdelhamid, F.A. Almalki, O. Ali, H. Sakli, “New MIMO Antenna with Filtration for the Future Multiuser Systems in Satellite Communications,” Wireless Communications and Mobile Computing, 2022, 1–12, 2022, doi:10.1155/2022/1040333.
- F.A. Almalki, A.A. Albraikan, B.O. Soufiene, O. Ali, “Utilizing Artificial Intelligence and Lotus Effect in an Emerging Intelligent Drone for Persevering Solar Panel Efficiency,” Wireless Communications and Mobile Computing, 2022, 1–12, 2022, doi:10.1155/2022/7741535.
- F.A. Almalki, S.H. Alsamhi, M.C. Angelides, Internet of X-Enabled Intelligent Unmanned Aerial Vehicles Security for Hyper-connected Societies, Springer Nature Singapore, Singapore: 75–100, 2022, doi:10.1007/978-981-19-1960-2_5.
- F.A. Almalki, M. Aljohani, M. Algethami, B.O. Soufiene, “Incorporating Drone and AI to Empower Smart Journalism via Optimizing a Propagation Model,” Sustainability, 14(7), 3758, 2022, doi:10.3390/su14073758.
- M. Yamin, A.M. Basahel, A.A. Abi Sen, “Managing Crowds with Wireless and Mobile Technologies,” Wireless Communications and Mobile Computing, 2018, 1–15, 2018, doi:10.1155/2018/7361597.
- I. Karamouzas, N. Sohre, R. Hu, S.J. Guy, “Crowd space,” ACM Transactions on Graphics, 37(6), 1–14, 2018, doi:10.1145/3272127.3275079.
- D. Cazzato, C. Cimarelli, J. L. Sanchez-Lopez, H. Voos, and M. Leo, “A Survey of Computer Vision Methods for 2D Object Detection from Unmanned Aerial Vehicles,” Journal of Imaging, 6(8), 78, Aug. 2020, doi: 10.3390/jimaging6080078.
- S. Nag, Y. Khandelwal, S. Mittal, C.K. Mohan, A.K. Qin, “ARCN: A Real-time Attention-based Network for Crowd Counting from Drone Images,” in 2021 IEEE 18th India Council International Conference (INDICON), IEEE: 1–6, 2021, doi:10.1109/INDICON52576.2021.9691659.
- Ali Al-Sheary and Ali Almagbile, “Crowd Monitoring System Using Unmanned Aerial Vehicle (UAV),” Journal of Civil Engineering and Architecture, 11(11), Nov. 2017, doi: 10.17265/1934-7359/2017.11.004.
- S. Yadav, P. Gulia, N.S. Gill, J.M. Chatterjee, “A Real-Time Crowd Monitoring and Management System for Social Distance Classification and Healthcare Using Deep Learning,” Journal of Healthcare Engineering, 2022, 1–11, 2022, doi:10.1155/2022/2130172.
- S.S.A. Abbas, P.O. Jayaprakash, M. Anitha, X.V. Jaini, “Crowd detection and management using cascade classifier on ARMv8 and OpenCV-Python,” in 2017 International Conference on Innovations in Information, Embedded and Communication Systems (ICIIECS), IEEE: 1–6, 2017, doi:10.1109/ICIIECS.2017.8275988.
- O. Elharrouss, N. Almaadeed, K. Abualsaud, A. Al-Ali, A. Mohamed, T. Khattab, S. Al-Maadeed, “Drone-SCNet: Scaled Cascade Network for Crowd Counting on Drone Images,” IEEE Transactions on Aerospace and Electronic Systems, 57(6), 3988–4001, 2021, doi:10.1109/TAES.2021.3087821.
- B. Ptak, D. Pieczyński, M. Piechocki, M. Kraft, “On-Board Crowd Counting and Density Estimation Using Low Altitude Unmanned Aerial Vehicles—Looking beyond Beating the Benchmark,” Remote Sensing, 14(10), 2288, 2022, doi:10.3390/rs14102288.
- A.M. Al-Shaery, S.S. Alshehri, N.S. Farooqi, M.O. Khozium, “In-Depth Survey to Detect, Monitor and Manage Crowd,” IEEE Access, 8, 209008–209019, 2020, doi:10.1109/ACCESS.2020.3038334.
- M.S. Saidon, W.A. Mustafa, V.R. Rajasalavam, W. Khairunizam, “Automatic People Counting System Using Aerial Image Captured by Drone for Event Management BT – Intelligent Manufacturing and Mechatronics,” in: Bahari, M. S., Harun, A., Zainal Abidin, Z., Hamidon, R., and Zakaria, S., eds., Springer Singapore, Singapore: 51–65, 2021, doi: 10.1007/978-981-16-0866-7_4
- R.S. de Moraes, E.P. de Freitas, “Multi-UAV Based Crowd Monitoring System,” IEEE Transactions on Aerospace and Electronic Systems, 56(2), 1332–1345, 2020, doi:10.1109/TAES.2019.2952420.
- D. Vallejo, J.J. Castro-Schez, C. Glez-Morcillo, J. Albusac, “Multi-agent architecture for information retrieval and intelligent monitoring by UAVs in known environments affected by catastrophes,” Engineering Applications of Artificial Intelligence, 87, 103243, 2020, doi:10.1016/j.engappai.2019.103243.
- B. Sirmacek, P. Reinartz, “AUTOMATIC CROWD ANALYSIS FROM VERY HIGH RESOLUTION SATELLITE IMAGES,” The International Archives of the Photogrammetry, Remote Sensing and Spatial Information Sciences, XXXVIII-3/, 221–226, 2013, doi:10.5194/isprsarchives-XXXVIII-3-W22-221-2011.
- F.A. Almalki, A.A. Alotaibi, M.C. Angelides, “Coupling multifunction drones with AI in the fight against the coronavirus pandemic,” Computing, 104(5), 1033–1059, 2022, doi:10.1007/s00607-021-01022-9.
- N.-D. Nguyen, D.-H. Bui, X.-T. Tran, “A Novel Hardware Architecture for Human Detection using HOG-SVM Co-Optimization,” in 2019 IEEE Asia Pacific Conference on Circuits and Systems (APCCAS), IEEE: 33–36, 2019, doi:10.1109/APCCAS47518.2019.8953123.
- F.A. Almalki, M.C. Angelides, “Autonomous flying IoT: A synergy of machine learning, digital elevation, and 3D structure change detection,” Computer Communications, 190, 154–165, 2022, doi:10.1016/j.comcom.2022.03.022.
- OpenCV Open Source Computer Vision 4.6.0-dev, docs.opencv.org. [Online]. Available: https://docs.opencv.org/4.x/d7/dbd/group__imgproc.html
- K.S. Alqarni, F.A. Almalki, B.O. Soufiene, O. Ali, F. Albalwy, “Authenticated Wireless Links between a Drone and Sensors Using a Blockchain: Case of Smart Farming,” Wireless Communications and Mobile Computing, 2022, 1–13, 2022, doi:10.1155/2022/4389729.
- F.A. Almalki, M.C. Angelides, “An enhanced design of a 5G MIMO antenna for fixed wireless aerial access,” Cluster Computing, 25(3), 1591–1606, 2022, doi:10.1007/s10586-021-03318-z.
- Segmented nature, Kaggle.com, 2021 to 2022. [Online]. Available: kaggle datasets download -d lprdosmil/segmented-nature.
- Cat and Dog, Kaggle.com, 2018. [Online]. Available: kaggle datasets download -d tongpython/cat-and-dog.
- Animal Faces, Kaggle.com, 2020. [Online]. Available: kaggle datasets download -d andrewmvd/animal-faces.
- Crowd Counting, Kaggle.com, 2018. [Online]. Available: kaggle datasets download -d fmena14/crowd-counting.
- Human Crowd Dataset, Kaggle.com, 2021 to 2022. [Online]. Available: kaggle datasets download -d hilongnguyn/human-crowd-dataset.
- S.N. Chaudhri, N.S. Rajput, S.H. Alsamhi, A. V Shvetsov, F.A. Almalki, “Zero-Padding and Spatial Augmentation-Based Gas Sensor Node Optimization Approach in Resource-Constrained 6G-IoT Paradigm,” Sensors, 22(8), 3039, 2022, doi:10.3390/s22083039.
- S.H. Alsamhi, F.A. Almalki, H. AL-Dois, A. V Shvetsov, M.S. Ansari, A. Hawbani, S.K. Gupta, B. Lee, “Multi-Drone Edge Intelligence and SAR Smart Wearable Devices for Emergency Communication,” Wireless Communications and Mobile Computing, 2021, 1–12, 2021, doi:10.1155/2021/6710074.
- F.A. Almalki, S.H. Alsamhi, R. Sahal, J. Hassan, A. Hawbani, N.S. Rajput, A. Saif, J. Morgan, J. Breslin, “Green IoT for Eco-Friendly and Sustainable Smart Cities: Future Directions and Opportunities,” Mobile Networks and Applications, 2021, doi:10.1007/s11036-021-01790-w.
- S.H. Alsamhi, F.A. Almalki, O. Ma, M.S. Ansari, M.C. Angelides, “Correction to: Performance optimization of tethered balloon technology for public safety and emergency communications,” Telecommunication Systems, 72(1), 155–155, 2019, doi:10.1007/s11235-019-00589-1.
- F.A. Almalki, “Utilizing Drone for Food Quality and Safety Detection using Wireless Sensors,” in 2020 IEEE 3rd International Conference on Information Communication and Signal Processing (ICICSP), IEEE: 405–412, 2020, doi:10.1109/ICICSP50920.2020.9232046.
- S.H. Alsamhi, M.S. Ansari, O. Ma, F. Almalki, S.K. Gupta, “Tethered Balloon Technology in Design Solutions for Rescue and Relief Team Emergency Communication Services,” Disaster Medicine and Public Health Preparedness, 13(02), 203–210, 2019, doi:10.1017/dmp.2018.19.
- F.A. Almalki, M.C. Angelides, “A machine learning approach to evolving an optimal propagation model for last mile connectivity using low altitude platforms,” Computer Communications, 142–143, 9–33, 2019, doi:https://doi.org/10.1016/j.comcom.2019.04.001.
- S.H. Alsamhi, O. Ma, M.S. Ansari, F.A. Almalki, “Survey on Collaborative Smart Drones and Internet of Things for Improving Smartness of Smart Cities,” IEEE Access, 7, 128125–128152, 2019, doi:10.1109/ACCESS.2019.2934998.
- F.A. Almalki, M.C. Angelides, “Propagation modelling and performance assessment of aerial platforms deployed during emergencies,” in 2017 12th International Conference for Internet Technology and Secured Transactions (ICITST), IEEE: 238–243, 2017, doi:10.23919/ICITST.2017.8356391.
- ShanghaiTech With People Density Map, Kaggle.com, 2019. [Online]. Available: kaggle datasets download -d tthien/shanghaitech-with-people-density-map.
- F.A. Almalki, S. Ben Othman, “Predicting Joint Effects on CubeSats to Enhance Internet of Things in GCC Region Using Artificial Neural Network,” Mobile Information Systems, 2021, 1–16, 2021, doi:10.1155/2021/1827155.
- H. Alsamhi, F.A. Almalki, F. Afghah, A. Hawbani, A. V Shvetsov, B. Lee, H. Song, “Drones’ Edge Intelligence Over Smart Environments in B5G: Blockchain and Federated Learning Synergy,” IEEE Transactions on Green Communications and Networking, 6(1), 295–312, 2022, doi:10.1109/TGCN.2021.3132561.