Estimating Subjective Appetite based on Cerebral Blood Flow

Adv. Sci. Technol. Eng. Syst. J. 7(6), 195–203 (2022);
 DOI: 10.25046/aj070621
This study aims to develop and validate a biological food preference task that simultaneously evaluates biological responses to visual stimuli of various food states and subjective evaluations of foods and to examine how these biological responses are related to food preference behavior. We recruited seventeen healthy male and female subjects to observe changes in cerebral blood flow related to salivation and the prefrontal cortex region while performing a food preference task related to visual stimuli of various food states. We also examined the relationship between these changes and the subjects’ subjective evaluations. The results showed that subjective evaluations of the various states of visual stimuli differed from subjective evaluations of the different food states. Furthermore, comparing the hemodynamic response function of cerebral blood flow to each visual stimulus, we observed a trend of activation of brain activity in the prefrontal and parotid regions during task execution. In addition, correlations were calculated between the subject’s subjective evaluation and cerebral blood flow in the prefrontal and parotid regions and between cerebral blood flow in the prefrontal and parotid regions, and significant differences were observed. Our findings demonstrate the potential of combining the evaluation of food in different states with cerebral blood flow indices in biological responses to visual cues of food.
1. Introduction
This paper is an extension of a work originally presented in ICMHI 2021 [1], which used visual stimuli of foods to examine the relationship between salivary responses and appetite. In this study, we developed a food preference task using visual stimuli of various food states rather than visual stimuli of food. We also measured the biological responses with cerebral blood flow in both parotid and prefrontal regions and examined its relationship to the subjects’ evaluation of appetite.
The visual appearance of foods may influence the choice of foods. The association between nutrient and energy content of food, as well as pleasant or unpleasant sensations toward food, are paired with different sensory features. Among the various sensory cues, the visual stimulation of food is an important regulator of appetite. When subjects were presented with visual stimuli, a significant difference was found in blood flow in the parotid region between the low-rating and the high-rating groups concerning subjects’ appetite [1]. People can predict its characteristics through photos and videos of food, and this action also influences people’s eating behavior. The chemical senses, sight, smell, and taste, play a key role in the sensory effects on appetite, food choice, and intake [2].
Saliva is recognized to have a variety of functions, and it affects oral defense as well as oral and systemic health. Saliva secretion depends on a complex set of factors, including food-related cues, health status, gender, etc.[3,4]. Salivary glands are under the dual control of sympathetic and parasympathetic nerves, and different glands have different salivary characteristics. Sympathetic nervous system activity causes the parotid gland to secrete saliva rich in serum and α-amylase while the parasympathetic nervous system activity causes the submandibular and sublingual glands to produce viscoelastic, mucin-rich saliva [5–7]. Each component of saliva is regulated to perform a particular function. Sensory food cues, such as appearance, fragrance, and taste, may induce a rapid secretion of saliva in the oral cavity, which is called the cephalic phase salivary response [8–11]. Cephalic phase salivary response includes physiological responses to food-related cues such as the thought, fragrance, appearance, and taste of food [12]. Many studies have shown that sensory exposure to various foods increases saliva production.
Food choice and intake processes consist of various cognitive, sensory, and metabolic components, such as sensory pleasure, metabolic hunger, and knowledge about food[13]. In addition, these non-homeostatic aspects are an important area of research, as cognitive, sensory, and emotional processes often take precedence over food choice decisions in the current food-abundant obesogenic environment [14]. Traditional measures of appetite often use subjective assessment methods that rely on self-report, such as questionnaires or interviews. These subjective assessment methods require cognitive information processing and reasoning by the subject, influenced by factors such as social desirability [13]. However, implicit motivation is difficult to measure, as humans make various daily food decisions. In addition, people’s choices and actions regarding food and food cues have characteristics such as motivational processes that we are unaware of, cannot articulate, or do not want to do [13,15]. In recent years, technological advances in biometric systems that measure psychophysiological parameters have made it possible to examine subjective rates of food and the implicit processes involved in food intake [16]. Biometrics, a non-invasive behavioral and physiological measure that may reflect motivation and emotional responses to food, has features that can identify individual characteristics based on biological and physiological properties and is commonly used in food science and consumer science [17].
However, it is still unclear why people respond to foods this way and what psychophysiological processes are possible before and during behavioral responses to food cues. Furthermore, as far as previous studies are concerned, since the number of studies on biometrics is limited, the results are inconsistent, which makes it difficult to compare study results. On the other hand, we believe that biometric measures need to be combined with measures of appetite, as it is necessary to investigate individual motivations and responses behind food choices and intake to promote healthier eating habits.
Therefore, this study aims to develop and test a biological food preference task that simultaneously rates biological responses to visual stimuli of various food states, and subjective evaluations of food. The study then examines how these biological responses are related to food preference behavior. Specifically, differences in biological responses (cerebral blood flow in the prefrontal cortex, salivation) to visual food stimuli under different states of food are rated in a biometric food preference task. Specifically, a database and validation task will be developed using visual stimuli of different states of food. Next, the differences between biological responses to visual stimuli (cerebral blood flow in the prefrontal cortex and parotid region) and the evaluation of foods in response to visual stimuli of foods will be evaluated in a biometric food preference task. Finally, we examine the relationship between biological responses and food preferences.
2. Methodology
2.1. Participants
Seventeen healthy students (5 females, 12 males, aged 25-30) were recruited at Japan Advanced Institute of Science and Technology. Subjects were randomly selected from graduate students who agreed to take part in the study. Before the experiment, all subjects were given a screening session to determine eligibility. A questionnaire survey was conducted on the subjects’ age, gender, and medication status. As a result, all subjects had no evidence of systemic or oral diseases such as periodontal disease, and all were nonsmokers. In addition, participants were selected to be subject if their body mass index (BMI) is within the range of 18.5-25kg/m2 because being overweight or obese tends to impact the secretion of saliva as they secrete more saliva due to food cues[18]. Subjects were excluded if they had dental pathologies or issues chewing and swallowing due to the muscle movement, which could possibly affect their saliva secretion[19,20]. The subjects who volunteered were told they would be watching some photos and videos about ice cream and completing some rating tasks for the experiment. The experimental investigation period was from March 15, 2022 to March 23, 2022. The experiment was conducted on those who had consented to the study after the purpose of the study was explained. On the day of the experiment, participants were instructed not to eat for one hour before the experiment. Drinking water was allowed, but drinks containing sugar were not. Each participant was paid 3,000 yen as an honorarium for his participation in the experiment.
2.2. Data Collection
2.2.1. Experimental Device
In this experiment, two types of experimental devices were used. One was the HOT-2000 device, which can measure cerebral blood flow in the prefrontal cortex, associated with cognitive function, and the other was the WOT-S20 device, which can measure cerebral blood flow in the parotid gland, associated with saliva secretion.
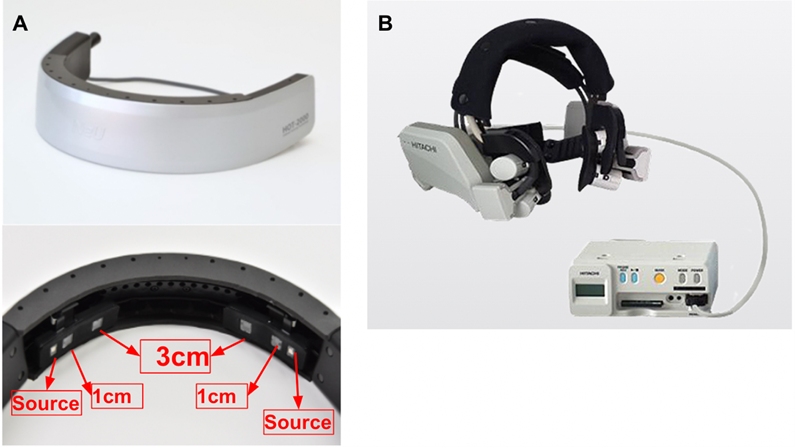
Figure 1: Experimental Devices. A: HOT-2000 device; B: WOT-S20 device.
We measured cerebral blood flow using the HOT-2000. It is a portable brain activity measurement device that can be used in everyday scenarios to simultaneously measure cerebral blood flow change, pulse and head acceleration in real-time[21]. The device used in this study has two Source-Detector (SD) optode pairs. Each optode pair has two optical detectors located at a distance of 1 cm and 3 cm from the light source. The device emits a wavelength of infrared light (about 800 nm) that is easily absorbed by hemoglobin in the blood and the detected light was sampled at a frequency of 10 Hz. The measurement principle is that the infrared light irradiated from the scalp diffuses, and if the area of the brain that is in the path of the light is activated, the amount of light that returns to the detector decreases due to increased blood flow and increased light absorption. The intensity change of the detected light was converted to total-hemoglobin (HbT) on the optical path of concentration using the modified Beer-Lambert law[22]. The 1cm-SD optode pair is the short separation channel, which provides auxiliary signals from shallow tissues such as the scalp and skull, and we use it to measure what is happening in the scalp and separate brain signals from non-neuronal physiological signals. In contrast, the 3cm-SD optode pair is the long separation channel that reaches the cerebral cortex and reflects blood flow changes associated with neural activity, usually measuring the brain.
We used WOT-S20, a near-infrared optical measuring device for the lateral face (developed by NeU Corporation), to measure cerebral blood flow changes in response to saliva secretion. The WOT-S20 device consists of three components: a headset equipped with a near-infrared light receiving/emitting sensor (one channel each for left and right), a portable control box for wireless data transmission and backup functions, and a measurement controller for real-time display and storage of measurement settings and results [23]. Among them, the source emits infrared light at wavelengths of 705[nm] and 830[nm] to detect hemoglobin changes (Oxy-hemoglobin (HbO), Deoxy-hemoglobin (HbR), Total-hemoglobin (HbT)) in the blood and to capture data at a frequency of 5 Hz. The basic principle of the measurement is that an increase in saliva secretion in the parotid region promotes an increase in blood volume, which decreases the amount of light transmission.
2.2.2. Experimental Materials
For the experimental material, we chose ice cream, a food commonly found in Japanese culture. Four of the most popular ice cream flavors were selected from various commercially available ice cream products and used as experimental materials. The four ice cream flavors selected were matcha, chocolate, strawberry, and vanilla. The ice cream melting process was documented on video by placing each ice cream on a wooden plate and filming the process from hard to wholly melted. Then, we used programming to calculate the area of each state of ice cream during the process from hard to melt. Finally, the ice cream was divided into four states based on the calculated area. In the first stage, only the middle of the ice cream has the characteristic of beginning to melt. In the second stage, the ice cream melts rapidly. In the third stage, the ice cream is still melting, but the melting rate of the ice cream is easing, and finally, in the fourth stage, the general area has not changed much. The fourth stage was a state in which only the middle of the ice cream was melting, although the general area did not change much.
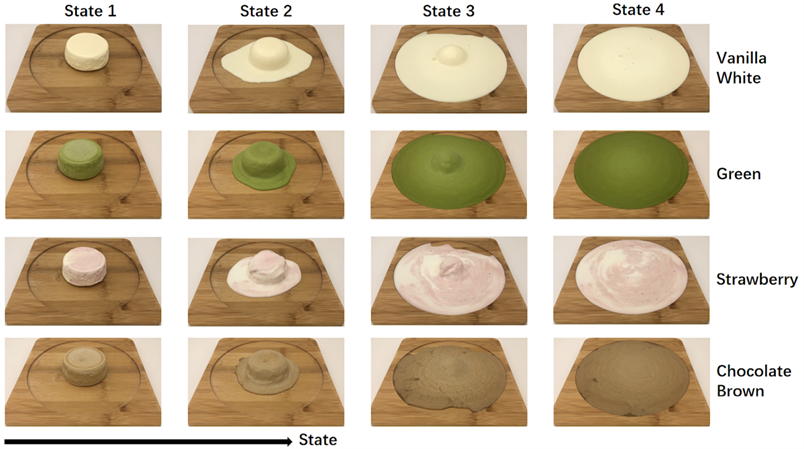
Figure 2: Experimental Material
Then, one representative photo was extracted from each video, and the 16 photos and 16 videos constituted the experimental material database for this experiment.
2.2.3. Experimental Environment
The experimental environment is shown in Figure 3. Figure C on the left shows the subject using the HOT-2000 device and doing the experimental task. Figure D on the right shows the subject wearing the WOT-S20 device and participating in the experiment.
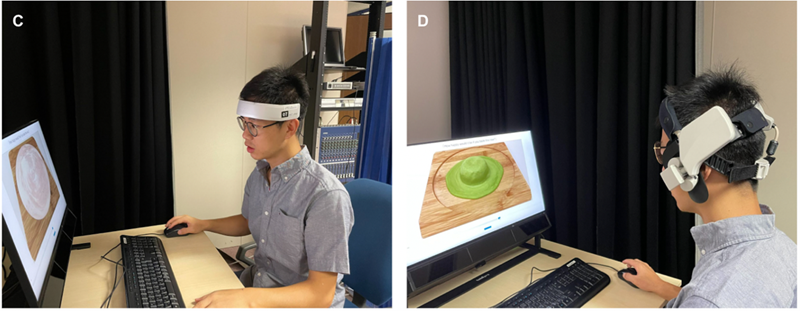
Figure 3: Experimental Environment. C: Experimenting with the HOT-2000 device, D: Experimenting with the WOT-S20 device.
2.2.4. The Flow of the Experiment
According to previous research, the Leeds Food Preference Questionnaire [24]was developed to examine the “liking” and “wanting” components of subjective evaluations of food, which has been reported as a valid method for measuring explicit and implicit aspects of appetite. Moreover, the Leeds Food Preference Questionnaire is a computer task with features that collect ratings, choices, and reaction times to visual food stimuli from different food categories [25].
The task of this study was designed to collect biological responses, including cerebral blood flow in the prefrontal and parotid regions, to food images and video stimuli based on the Leeds Food Preference Questionnaire procedure. A web application was built using JavaScript and HTML for stimulus presentation, and image and video stimuli were presented on the browser. As shown in Figure 2, the visual stimuli of ice cream displayed in the images and video vary in four different states.
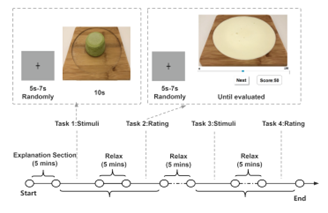
Figure 4: Experimental Procedure
The experimental procedure is illustrated in Figure 4. Participants were instructed to eat one hour before the experiment, and upon arrival at the laboratory, only water was allowed while the experiment was in progress. After explaining the criteria for participation in the experiment, the purpose, and content of the experiment, and confirming the subjects’ eligibility, a preliminary questionnaire was conducted regarding the subjects’ age, BMI, frequency of ice cream consumption, and preferences.
As shown in Figure 4, the task is consisted of four parts (Task 1 to Task 4). Task 1 involves passively viewing 16 ice cream pictures on two separate occasions, and Task 2 requires the participants to rate the stimuli presented in Task 1. The specific procedure was that in Task 1, pictures of ice cream were displayed. Then, subjects were allowed to look at them for ten seconds, followed by Task 2, in which subjects were asked to rate them on a scale from 0 to 100 (0 means the lowest degree and 100 means the highest degree of liking and wanting). Then, a new image was presented in Task 1 for ten seconds, and the subject was asked to rate the image presented in Task 1 in Task 2. Thus, sixteen ice cream images were displayed randomly, and subjects were asked to rate them. The subjects were asked to rate each ice cream image using two questions when rating the images. First, they are rated on one food preference component (“How happy would it be if you taste this now?”) and then on the other (“How much would you want some of this now?”), in random order. Tasks 3 and 4 followed the same procedure as Tasks 1 and 2. Task 3 consisted of passively viewing 16 ice-cream videos on two separate occasions, and Task 4 evaluated the stimuli of the videos presented in Task 3.
During passive viewing of the images or videos, subjects were presented with the ice cream image or videos for 10 seconds, sufficient to capture the salivary response. After passively viewing each image or video, subjects were asked to rate their feel of “liking” (“How happy would you be if you ate this food now?”) or “wanting” (“How much would you like this food now?”) explicitly using a 100-point visual analog scale (VAS). In total, 32 passive viewings and ratings were conducted, 16 of which were explicit ” liking” ratings and 16 of which were explicit “wanting” ratings. Before each passive viewing, participants were presented with a fixation target[26] with a randomly varying exposure time (5s-7s) to ensure that their gaze was directed to the center of the screen and that participants could not accurately predict the onset of the next stimulus. Before rating, subjects were presented with a fixation target to ensure they were looking at the center of the screen.
2.2.5. fNIRS Data Collection
In this study, we focused on the prefrontal and parotid brain regions. During the experiment, data were collected by measuring each subject’s cerebral blood flow data in each task. When measuring cerebral blood flow in the prefrontal cortex, subjects’ resting cerebral blood flow was measured for 5 minutes before the experiment. When measuring the cerebral blood flow for resting, subjects were instructed to sit on a chair, close their eyes, and relaxed as much as possible. The cerebral blood flow data of resting for five minutes were used as training data for fNIRS data processing.
2.3. Data Analysis
2.3.1. fNIRS Data Processing (saliva)
The raw data of the cerebral blood flow on saliva includes HbO, HbR, and HbT, where HbT is the sum of HbO and HbR. For the processing of fNIRS data in the parotid region, we first convert the data output from the machine to Shared Near Infrared Spectroscopy Format (SNIRF), developed by the Society for functional Near Infrared Spectroscopy [27]. Then, a general linear model (GLM)[28] was employed for processing the fNIRS data in the parotid region using the open-source HOMER3 toolbox[29] in MATLAB (Mathworks Inc.). The procedure was as follows: Firstly, we used the prune channel function to prune bad or low SNR channels from the measurement list. Next, the raw light intensity signal was converted to optical density. Bandpass filtering was applied to the fNIRS data in the 0-0.5 Hz range. The optical density was then converted to total hemoglobin (HbT) concentration with a default partial path length factor. Finally, a general linear model (GLM) was used to remove whole-body artifacts. The hemodynamic response function (HRF) was estimated using the mean of the long separation channels. A continuous Gaussian function (stdev=1.0, step=1.0) was calculated from rest to speech.
2.3.2. fNIRS Data Processing (PFC)
For the processing of fNIRS data in the prefrontal region, we converted the data to the Shared Near Infrared Spectroscopy Format (SNIRF). Then, the general linear model with temporally embedded canonical correlation analysis (GLM with tCCA)[30] was conducted using the open-source HOMER3 toolbox in MATLAB (Mathworks Inc.). Firstly, the prune channel’s function was used to prune bad or low SNR channels from the measurement list. Then we converted the raw optical intensity signal to an optical density. Subsequently, both fNIRS and auxiliary data were conducted the bandpass filtering within 0-0.5 Hz. Then, we converted the optical density to total-hemoglobin (HbT) concentration with default partial path-length factor. Now, to reduce nuisance signals in fNIRS and create optimal regressors, the temporally embedded Canonical Correlation Analysis function was conducted. Finally, a general linear model (GLM) was used to remove the systemic artifacts. The hemodynamic response function (HRF) was estimated using the average of the long separation channels. It was calculated with the consecutive sequence of Gaussian functions (stdev=1.0, step=1.0) from rest to the speech period.
2.3.3. Statistics Analysis
Subjective rating scores for each ice cream were collected during the subject’s experiment, and the mean value of each rating score was calculated. After processing the cerebral blood flow data, the mean value and the change of cerebral blood flow signal for each channel were calculated. After confirming the normality of the data, correlations were calculated between subjects’ subjective evaluation data and objective fNIRS data.
3. Results
3.1. Results of Ice cream Evaluation
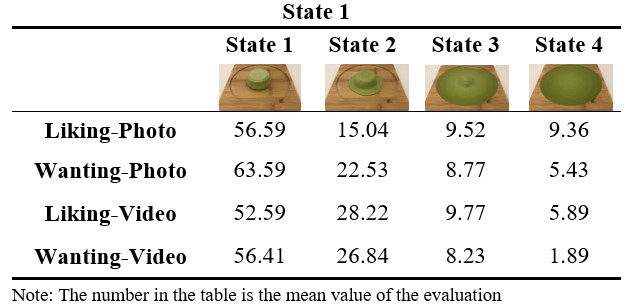
The evaluation results for ice cream are shown in Table1. In addition, photos and videos of ice cream were categorized by state, and the mean value of each rating result was calculated.
Comparing ice cream by state, when subjects were asked how happy they would be if they tasted the ice cream at that moment in response to a photo of ice cream, the mean rating of ice cream in each state was 56.59 for State 1 and 15.04 for State 2, 9.52 for State 3, and 9.36 for State 4. When subjects were asked how much they would like to eat the ice cream in the picture, the mean rating of ice cream in each state was 63.59 for state 1 and 22.53 for state 2, 8.77 for state 3, and 5.43 for state 4, on the other hand, when subjects were asked how happy they would be if they ate the ice cream in response to a video of ice cream, the mean rating of ice cream in each state was 52.59 for state 1 and 28.22 for state 2, 9.77 for state 3, and 5.89 for state 4, when subjects were asked how much would you like this food now in response to a video of ice cream, the mean rating of ice cream in each state was 56.41 for state 1 and 26.84 for state 2, 8.23 for state 3, and 1.89 for state 4.
Table 1. Rating results for ice cream divided by state
3.2. Results of Hemodynamic response function (HRF)
After processing the fNIRS data, the hemodynamic responses of cerebral blood flow in the prefrontal and parotid regions were investigated during the visual stimulation and evaluation of the ice cream. There is a positive correlation between the hemoglobin signal of cerebral blood flow in the parotid region and salivary secretion, meaning that increased cerebral blood flow activity tends to increase saliva secretion. The results of activation in prefrontal and parotid regions by visual stimulation of ice cream in each state are shown in Figure 5 to Figure 7. However, little activation trend was observed in cerebral blood flow in the prefrontal and parotid regions of the subjects to the stimulation of ice cream in State 3, which is not shown in the results.
3.3. Results of Hemodynamic response function (HRF) in the parotid region
Figure 5 and Figure 6 shows the results of the brain activation trend observed in the parotid region during the visual stimulation and rating of ice cream. The horizontal axis shows the time course, and the vertical axis shows the average change in cerebral blood flow. The purple dotted line shows the group-averaged mean cerebral blood flow change, and the error bars show the standard error of the group-level mean. In addition, cerebral blood flow activity from -3s to 5s was observed. Time 0 on the horizontal axis represents the stimulation or evaluation start time. Therefore, the mean value of 3s before the start time of stimulation or evaluation was used to estimate the change in cerebral blood flow during 5s from the start time of stimulation or evaluation.
Figure 5 shows the trend of the hemodynamic response function to the stimulation of photos for each ice cream state. According to the results of the hemodynamic response function, when subjects were asked how happy they would be if they tasted the food in response to a photo of ice cream, we observed a tendency for a stimulation-induced of increase in cerebral blood flow in the left parotid region when subjects were evaluating photos of ice cream in state 1 and state 4, and when they were receiving stimulation of the photo in state 4. Moreover, when subjects were asked how much they would like to eat this food in response to a photo of ice cream, we observed a tendency for cerebral blood flow due to stimulation to increase in the right parotid region when they were receiving stimulation of the ice cream photo in state 1. Furthermore, when they were receiving stimulation of the photo in state 4, an increase of the cerebral blood flow was observed in the left parotid region during the stimulation.
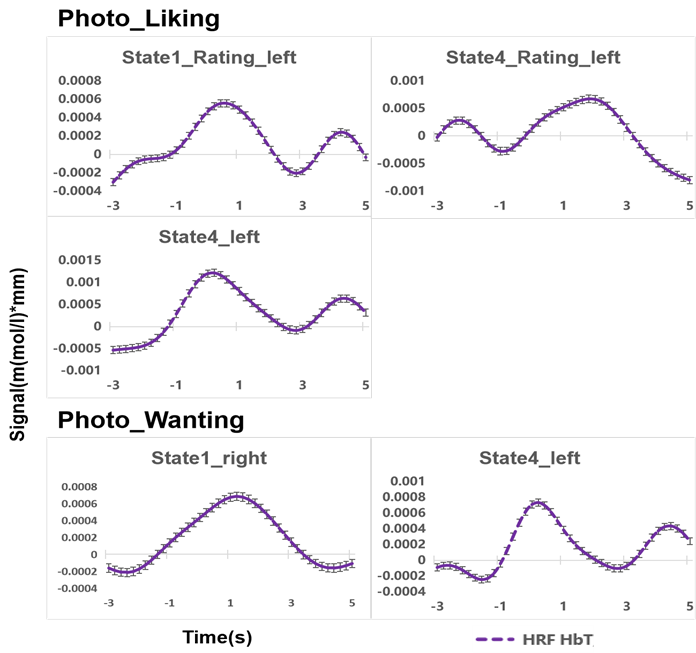
Figure 5: The trend of hemodynamic response function time courses of parotid region to photo stimuli in different states

Figure 6: The trend of hemodynamic response function time courses of parotid region to video stimuli in different states.
Figure 6 shows the trend of the hemodynamic response function to the stimulation of videos for each ice cream state. When subjects were asked how happy they would be if they tasted this in response to a video of ice cream, we observed a tendency for a stimulation-induced of increase in cerebral blood flow in the right parotid region when subjects were evaluating videos of ice cream in state 2 and state 4. Furthermore, when subjects were asked how much they would like to eat this food in response to a video of ice cream, an increase of cerebral blood flow was observed in the right parotid region when subjects were rating videos of ice cream in state 2.
3.4. Results of Hemodynamic response function (HRF) in the prefrontal region
Figure 7 shows the results of the observed brain activation trend in the prefrontal cortex during the visual stimulation of ice cream and rating. The horizontal axis shows the time course, and the vertical axis shows the average change in cerebral blood flow. The red solid line shows the group-averaged mean cerebral blood flow change, and the error bars show the standard error of the group-level mean. In addition, cerebral blood flow activity from -2s to 5s was observed. Time 0 on the horizontal axis represents the stimulation or evaluation start time. Therefore, the mean value of 2s before the start time of stimulation or evaluation was used to estimate the change in cerebral blood flow during 5s from the start time of stimulation or evaluation.
According to the results of the hemodynamic response function, when subjects were asked how much they would like to eat this food in response to a photo of ice cream, we observed a tendency for cerebral blood flow due to stimulation to increase in the left prefrontal region when they were receiving stimulation of the ice cream photo in state 2 and state 4. Moreover, when subjects were asked how happy they would be if they tasted the food in response to a video of ice cream, a tendency for cerebral blood flow due to stimulation to increase in the right prefrontal region when they were receiving stimulation of the ice cream photo in state 2. Furthermore, when subjects were asked how much they would like to eat this food in response to a video of ice cream, a tendency for cerebral blood flow to increase was observed in the left prefrontal region when subjects were rating videos of ice cream in state 1.
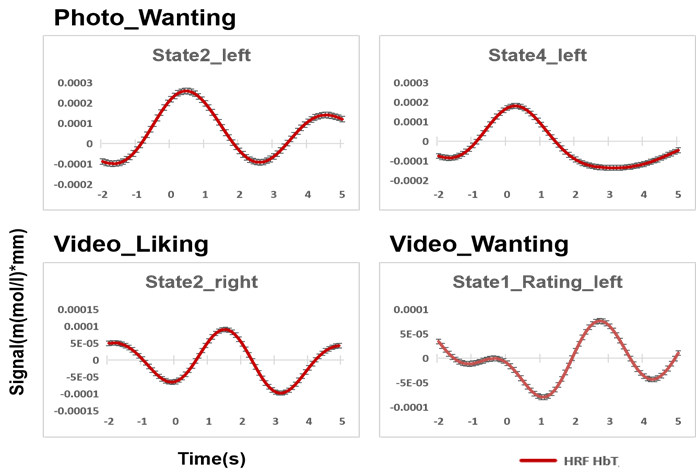
Figure 7: The trend of hemodynamic response function time courses of prefrontal region to photo and video stimuli in different states.
3.5. Results of Correlation
After processing the fNIRS data, the mean value of concentrations of HbR, HbO, and HbT were calculated. Then, the mean values were used to analyze the correlations, and the results are shown in Table2 to Table4. Since there is a positive correlation between the hemoglobin signal in cerebral blood flow in the parotid region and saliva secretion, a high level of hemoglobin signal in cerebral blood flow in the parotid region means a high level of saliva secretion.
Table 2: Correlation coefficients between subjects’ ratings and the signal mean of cerebral
| HbR | HbO | HbT | |||||
| left | right | left | right | left | right | ||
| Liking -Photo |
stimuli | 0.510 | 0.382 | 0.821** | 0.553 | 0.726** | -0.520 |
| evaluate | 0.636 | -0.733** | -0.601 | -0.868** | 0.177 | -0.942** | |
| Wanting -Photo |
stimuli | -0.878** | 0.271 | 0.378 | 0.991** | -0.183 | 0.571 |
| evaluate | -0.831** | -0.952** | -0.350 | -0.171 | 0.820** | -0.311 | |
| Liking -Video |
stimuli | 0.957** | 0.573 | 0.453 | 0.070 | 0.228 | -0.598 |
| evaluate | 0.430 | 0.537 | 0.778** | 0.269 | 0.419 | -0.464 | |
| Wanting -Video |
stimuli | 0.076 | -0.241 | -0.178 | -0.349 | 0.484 | -0.174 |
| evaluate | 0.668 | 0.420 | -0.76** | 0.597 | -0.479 | 0.313 | |
| note: **: p<0.01 The numbers in the table refer to correlation coefficients. |
|||||||
Table2 shows the correlation coefficients between subjects’ ratings and the change in the signal mean of cerebral blood flow related to saliva were determined separately for each ice cream state. When subjects were asked how happy it would be if they tasted this in response to a photo of ice cream, a strong positive correlation was found between subjects’ ratings and HbO (r = 0.821) and HbT (r = 0.726) on the left side during stimulation. Therefore, it can be said that the mean values of HbO and HbT on the left side tend to increase as the subject’s evaluation of the ice cream increases. On the other hand, there was a strong negative correlation between the subject’s ratings and the HbR (r = -0.733), HbO (r = -0.868), and HbT (r = -0.942) on the subject’s right side while rating the ice cream photos. Thus, it can be concluded that the mean values of HbR, HbO, and HbT on the right side tend to become smaller as the subject’s evaluation of the ice cream increases.
When subjects were asked how much they would like this food in response to a photo of ice cream, there was a strong negative correlation between the subject’s ratings and HbR (r = -0.878) on the left side and a strong positive correlation with HbO (r = 0.991) on the right side during stimulation. Thus, it can be concluded that the mean value of HbR on the left side tends to become smaller and the mean value of HbO on the right side tends to become larger as the subject’s evaluation of the ice cream increases. On the other hand, when subjects rated the stimulus pictures, there was a strong negative correlation between HbR on the left (r = -0.831) and right (r = -0.952) sides and a strong positive correlation between HbT (r = 0.820) on the left side. Therefore, it can be concluded that the mean values of HbR on the left and right sides become smaller as the subject’s evaluation of the ice cream increases, but the mean value of HbT on the left side tends to increase.
When subjects were asked how happy they would be if they tasted this in response to a video of ice cream, a strong positive correlation was found between subjects’ ratings and HbR (r = 0.957) on the left side during stimulation. Therefore, it can be concluded that the mean values of HbR on the left side tend to increase as the subject’s evaluation of the ice cream increases. On the other hand, there was a strong positive correlation between the subject’s ratings and the HbO (r = 0.778) on the subject’s left side while rating the ice cream videos. Thus, it can be concluded that the mean values of HbO on the left side tend to become larger as the subject’s evaluation of the ice cream increases.
When subjects were asked how much they would like if they could eat it in response to a video of ice cream, no correlation was found between subjects’ ratings and subjects’ cerebral blood flow during stimulation. However, there was a strong negative correlation between the subject’s ratings and the HbO (r = -0.760) on the subject’s left side while rating the ice cream videos. Thus, it can be concluded that the mean values of HbO on the left side tend to become smaller as the subject’s evaluation of the ice cream increases.
Table 3. Correlation between subjects’ ratings and the signal mean of cerebral blood flow in the prefrontal region by state
| Photo_Liking
_HbT |
Photo_Wanting
_HbT |
Video_Liking
_HbT |
Video_Wanting
_HbT |
|||||
| left | right | left | right | left | right | left | right | |
| stimuli | -0.236 | -0.171 | -0.137 | 0.036 | 0.977** | -0.227 | 0.118 | 0.221 |
| evaluate | 0.895** | -0.252 | -0.888** | -0.193 | 0.515 | 0.729** | 0.134 | 0.601 |
| note: **: p<0.01
The numbers in the table refer to correlation coefficients. |
||||||||
Table3 shows the correlation coefficients between subjects’ ratings and the change in the signal mean of cerebral blood flow related to cognitive function were determined separately for each ice cream state. When subjects were asked how happy they would be if they tasted this at that moment in response to a photo or video of ice cream, a strong positive correlation was found between subjects’ ratings and HbT (r = 0.895) on the left side of the prefrontal cortex while rating the ice cream photos. Moreover, a strong positive correlation was found between subjects’ ratings and HbT (r = 0.977) on the left side of the prefrontal cortex during stimulation, and a strong positive correlation was found between subjects’ ratings and HbT (r = 0.729) on the right side of the prefrontal cortex while rating the ice cream videos. Thus, it can be said that the higher the subject’s evaluation, the larger the mean values of HbT on the left side of the prefrontal cortex tended to be while rating the ice cream photos; the higher the subject’s evaluation, the larger the mean values of HbT on the right side of the prefrontal cortex tended to be while rating the ice cream videos, and the larger the mean values of HbT on the left side of the prefrontal cortex tended to be during stimulation of the ice cream videos.
On the other hand, when subjects were asked how much they would like to eat this food in response to a video of ice cream, a strong negative correlation was found between subjects’ ratings and HbT (r = -0.888) on the left side of the prefrontal cortex while rating the ice cream photos. Therefore, it can be concluded that the higher the subject’s evaluation, the smaller the mean values of HbT on the left side of the prefrontal cortex tended to be while rating the ice cream photos.
Table 4 shows the correlation coefficients between the change in the signal mean of cerebral blood flow related to saliva and the change in the signal mean of cerebral blood flow related to cognitive function were determined separately for each ice cream state. When subjects were asked how happy they would be if they tasted the food in response to a video of ice cream, a strong positive correlation (r = 0.843) was found between HbT on the right side of the prefrontal cortex and HbT on the right side of the parotid region during stimulation. Thus, it can be concluded that the mean values of HbT on the right side of the parotid region become larger as the the mean values of HbT on the right side of the prefrontal cortex increases.
Table 4. The correlation coefficients of the signal mean change of cerebral blood flow between the parotid and prefrontal regions (By state)
| Photo_Liking
_HbT |
Photo_Wanting
_HbT |
Video_Liking
_HbT |
Video_Wanting
_HbT |
|||||
| left | right | left | right | left | right | left | right | |
| stimuli | 0.110 | -0.474 | 0.541 | -0.227 | 0.409 | 0.843** | 0.681 | -0.986** |
| evaluate | 0.450 | -0.245 | -0.742** | -0.857** | -0.569 | -0.077 | 0.323 | -0.123 |
| note: **: p<0.01 The numbers in the table refer to correlation coefficients. |
||||||||
On the other hand, when subjects were asked how much they would like this food at that moment in response to a photo of ice cream, a strong negative correlation was found between HbT on the left (r = -0.742) and right (r = -0.857) sides of the parotid region and HbT on the left and right sides of the prefrontal cortex while rating the ice cream photos. Furthermore, when subjects were asked how much they would like this food in response to a video of ice cream, there was a strong negative correlation (r = -0.986) between the HbT on the subject’s right side of the parotid region and the HbT on the subject’s right side of the prefrontal cortex while rating the ice cream videos. Therefore, it can be concluded that the mean values of HbT on the left and right sides of the parotid region become smaller as the mean values of HbT on the left and right sides of the prefrontal cortex increases, and the mean values of HbT on the right side of the parotid region become smaller as the mean values of HbT on the right side of the prefrontal cortex increases.
3.6. Summary of the results
In this study, to explore the individual motivations behind food choices and how biological responses are related to evaluations of food, we employed an approach for combining biological indicators from prefrontal and parotid regions and examined them in response to visual stimuli of food. We developed and tested a biological food preference task that simultaneously rates biological responses to visual stimuli of various food states and subjective evaluations of food. We also examined how these biological responses are related to food preference behavior. First, the results revealed the differences in subjects’ subjective evaluations of the visual stimuli of different states of ice cream. Then, according to the hemodynamic response function of cerebral blood flow during visual stimulation and evaluation, activation was observed in the prefrontal and parotid regions of the brain during the task. Furthermore, we found significant correlations between subjects’ subjective evaluation and the mean change in cerebral blood flow in the prefrontal and parotid regions and between the mean change in cerebral blood flow in the prefrontal region and the mean change in cerebral blood flow in the parotid region.
4. Discussion
According to the result of the subjects’ subjective evaluations, when the subjects’ evaluations were segmented according to the state of the ice cream, there was a large difference in the subjects’ subjective evaluation of each state of the ice cream. In particular, State 1 ice cream had the highest evaluation, and State 4 ice cream had the lowest evaluation. Consequently, when the state of the ice cream changed from hard to completely melted, the subjects’ evaluations tended to change from high to low. The visual sense plays an essential role in food selection [2], and some studies have reported that the visual sense of food strongly influences appetite [31–33]. In this study, we controlled the visual changes in food state as cues for visual stimuli of food. During the experimental task, subjects visually process food cues, and along with learned knowledge about the food, there is likely to be a process of evaluating the food as expectations about the food are generated from the visual cues of the food. The fact that there was a significant difference in the evaluation of ice cream by the state is due to the fact that ice cream in a hard state is commonly expected, and as the state of ice cream changes, the subjects tend to feel more uncomfortable with the melting ice cream. Therefore, the subject’s evaluation of the ice cream was also lower. Furthermore, many studies have reported that visual changes with aging significantly impact appetite [33–35]. Particularly, appetite is strongly influenced by visual factors such as the state of food [34,35]. In our experiment, the influence of state is significant, which indicated the same results as previous studies.
It has been reported that subjects process visual information about food and that, along with learned knowledge about food, expectations about food are generated from visual cues of food, and various predictive responses can be caused in the body to visual stimuli of food [36]. By detecting changes in oxygen saturation, fNIRS can identify the activation of different brain regions in response to a task or stimulus and has been widely used in many research fields, including cognitive behavior and brain injury[37,38]. The activation of the cerebral cortex causes the concentration of HbT and HbO to increase while the concentration of HbR decrease [39]. In this experiment, biological responses with activation of cerebral blood flow in the prefrontal and parotid regions were observed as predictive responses in the body. Therefore, visual stimulation in different states of food may have led to an increase in cerebral blood flow concentration in the prefrontal and parotid regions. Furthermore, these responses include cognitive and physiological processes [36]. In other words, measuring the different aspects of cognitive and physiological processes may provide insight into facilitating human food selection activities. As the state has an important influence on food selection, in this study, we used a food preference selection task in different states of ice cream. In addition, we asked subjects to rate their liking and wanting to measure brain blood flow responses in prefrontal and parotid regions during the task. Information from the subjects’ subjective ratings and cerebral blood flow allowed us to examine how food cues from different states and colors in food categories affect cognitive and physiological processes and how these factors are related.
It was reported that vision is a major factor influencing human food selection[40], visual stimulation of food is an essential regulator of appetite, and visual stimulation of food can activate the reward center of the brain [41]. In this study, we measured the response of cerebral blood flow during passive viewing and evaluation of visual stimuli of food. The results showed that the food evaluation variables differed between each category of different food states. For example, when subjects were asked how happy they would be if they ate the food in response to a photo of ice cream in different states, a strong negative correlation was observed between the mean change in HbO in the right parotid region and the subject’s evaluation. On the other hand, when subjects were asked how much they would like to eat this food in response to a photo of ice cream in different states, a strong positive correlation between the subject’s evaluation and the mean change in cerebral blood flow in the left parotid region while rating the pictures detected, but a strong negative correlation with the mean change in cerebral blood flow in the left prefrontal region is observed. Although our results revealed various correlations between subjective evaluation and cerebral blood flow from the approach of food in different stats, the results are inconsistent, and there is currently a limited number of comparable studies on the results of each of the correlations revealed. Some studies demonstrated the differences in biological responses to the taste of different juices[42] and the olfactory cues of smell [43]. In the future, it is conceivable that it may be possible to evoke more cerebral blood flow responses by approaching elements such as the smell and taste of food compared to visual stimuli to food cues.
It was reported that increased cutaneous electrical activity in response to food aversive visual stimuli[42]. Since the materials used in this experiment ranged from normal ice cream shape and state to completely melted ice cream, it is likely that as the ice cream melted, subjects’ feelings of liking or disliking each state of ice cream would also change. Similarly, subjects’ biological responses to each feeling would change. Based on the results of this experiment, it was found that the subjects’ subjective rating scores for each state of ice cream also decreased as the ice cream melted. On the other hand, the characteristics of cerebral blood flow in the prefrontal and parotid regions for each state of ice cream showed that changes in cerebral blood flow did not change with the ice cream state but were somewhat irregular. Furthermore, the characteristics of cerebral blood flow caused by visual stimulation of ice cream revealed differences in cerebral blood flow changes between the left and right parotid brain regions. However, to the best of our knowledge, although the components of saliva secreted by the left and right parotid regions were different, the significance of the differences in cerebral blood flow changes in the left and right parotid regions is still unknown and needs further investigation.
From the hemodynamic response function results and the correlation between the subject’s subjective evaluation and cerebral blood flow, it can be inferred that there is more activity in the left hemisphere of the subject’s brain. The visual stimuli used in this study led to rational judgments by the subjects, which may have resulted in more activity in the left hemisphere of the brain in the results of this experiment. However, if it is a whole-brain response, then not only visual stimuli but also olfactory and gustatory sensations are essential in the whole-brain response. The appetite examined in this experiment using only visual stimuli is different from the appetite of daily life and is worth improving in the future.
5. Future Works
In the future, we will increase the number of subjects and expand the subjects’ age range while investigating whether this experiment’s results can be reproduced. In particular, we will investigate whether visual stimulation can improve appetite and xerostomia in the elderly. We will also examine the response of the brain when visual stimuli are combined with the senses of smell and taste.
- K.C. Lai, Y.Q. Liu, Q.K. He, M. Yi, T. Fujinami, “Saliva Secretion as Indicator of Appetite,” in ICMHI 2021: 2021 5th International Conference on Medical and Health Informatics, Association for Computing MachineryNew YorkNYUnited States, Kyoto Japan: 249–253, 2021.
- S. Boesveldt, K. de Graaf, “The differential role of smell and taste for eating behavior,” Perception, 46(3–4), 307–319, 2017.
- M. Levine, “Saliva,” Topics in Dental Biochemistry. Springer, Berlin, Heidelberg, 203–230, 2011.
- A. M. L. Pedersen, C. E. Sørensen, G. B. Proctor, G. H. Carpenter, “Salivary functions in mastication, taste and textural perception, swallowing and initial digestion,” Oral Diseases, 24(8), 1399–1416, 2018.
- G. H. Carpenter, “The secretion, components, and properties of saliva,” Annual Review of Food Science and Technology, 4, 267–276, 2013.
- J. R. Stokes, G. A. Davies, “Viscoelasticity of human whole saliva collected after acid and mechanical stimulation,” Biorheology , 44(3), 141–160, 2007.
- C. Dawes, A. M.L. Pedersen, A. Villa, J. Ekström, G. B. Proctor, A. Vissink, D. Aframian, R. McGowan, A. Aliko, N. Narayana, Y. W. Sia, R. K. Joshi, S. B. Jensen, A. R. Kerr, A. Wolff, “The functions of human saliva: A review sponsored by the World Workshop on Oral Medicine VI,” Archives of Oral Biology, 60(6), 863–874, 2015, doi:10.1016/J.ARCHORALBIO.2015.03.004.
- R. D. Mattes, “Physiologic Responses to Sensory Stimulation by Food: Nutritional Implications,” Journal of the American Dietetic Association, 97(4), 406–413, 1997, doi:10.1016/S0002-8223(97)00101-6.
- P. A.M. Smeets, A. Erkner, C. de Graaf, “Cephalic phase responses and appetite,” Nutrition Reviews, 68(11), 643–655, 2010, doi:10.1111/j.1753-4887.2010.00334.x.
- M.A.Zafra, F. Molina, A. Puerto, “The neural/cephalic phase reflexes in the physiology of nutrition,” Neuroscience & Biobehavioral Reviews, 30(7), 1032–1044, 2006, doi:10.1016/J.NEUBIOREV.2006.03.005.
- C. SPENCE, “MOUTH-WATERING: THE INFLUENCE OF ENVIRONMENTAL AND COGNITIVE FACTORS ON SALIVATION AND GUSTATORY/FLAVOR PERCEPTION,” Journal of Texture Studies, 42(2), 157–171, 2011, doi:https://doi.org/10.1111/j.1745-4603.2011.00299.x.
- M.P. Lasschuijt, M. Mars, C. de Graaf, P.A.M. Smeets, “Endocrine Cephalic Phase Responses to Food Cues: A Systematic Review,” Advances in Nutrition, 11(5), 1364–1383, 2020, doi:10.1093/advances/nmaa059.
- R. A. de Wijk He, W. He, M.G. Mensink, R.H. Verhoeven, C. de Graaf, “ANS responses and facial expressions differentiate between the taste of commercial breakfast drinks,” PloS One, 9(4), 2014.
- P.C. Lee, J.B. Dixon, “Food for Thought: Reward Mechanisms and Hedonic Overeating in Obesity,” Current Obesity Reports, 6(4), 353–361, 2017, doi:10.1007/s13679-017-0280-9.
- H. Münzberg, E. Qualls-Creekmore, S. Yu, C.D. Morrison, H.R. Berthoud, “Hedonics Act in Unison with the Homeostatic System to Unconsciously Control Body Weight,” Frontiers in Nutrition, 3, 2016.
- C. Gibbons, M. Hopkins, K. Beaulieu, P. Oustric, J.E. Blundell, “Issues in Measuring and Interpreting Human Appetite (Satiety/Satiation) and Its Contribution to Obesity,” Current Obesity Reports, 8(2), 77–87, 2019, doi:10.1007/s13679-019-00340-6.
- L. Bell, J. Vogt, C. Willemse, T. Routledge, L.T. Butler, M. Sakaki, “Beyond Self-Report: A Review of Physiological and Neuroscientific Methods to Investigate Consumer Behavior,” Frontiers in Psychology, 9, 2018.
- D. Ferriday, J.M. Brunstrom, “‘I just can’t help myself’: effects of food-cue exposure in overweight and lean individuals,” International Journal of Obesity, 35(1), 142–149, 2011, doi:10.1038/ijo.2010.117.
- G.H. Carpenter, “The secretion, components, and properties of saliva,” Annual Review of Food Science and Technology , 4, 267–276, 2013.
- Y. ILANGAKOON, G.H. CARPENTER, “IS THE MOUTHWATERING SENSATION A TRUE SALIVARY REFLEX?,” Journal of Texture Studies, 42(3), 212–216, 2011, doi:https://doi.org/10.1111/j.1745-4603.2011.00290.x.
- Neu co., BRAIN ACTIVITY MEASUREMENT , Dec. 2022.
- D.T. Delpy, M. Cope, P. van der Zee, S. Arridge, S. Wray, J. Wyatt, “Estimation of optical pathlength through tissue from direct time of flight measurement,” Physics in Medicine & Biology, 33(12), 1433, 1988, doi:10.1088/0031-9155/33/12/008.
- Neu co., WOT-S20, Dec. 2022.
- P. Oustric, D. Thivel, M. Dalton, K. Beaulieu, C. Gibbons, M. Hopkins, J. Blundell, G. Finlayson, “Measuring food preference and reward: Application and cross-cultural adaptation of the Leeds Food Preference Questionnaire in human experimental research,” Food Quality and Preference, 80, 103824, 2020, doi:10.1016/J.FOODQUAL.2019.103824.
- M. Dalton, G. Finlayson, “Psychobiological examination of liking and wanting for fat and sweet taste in trait binge eating females,” Physiology & Behavior, 136, 128–134, 2014, doi:10.1016/J.PHYSBEH.2014.03.019.
- L. Thaler, A.C. Schütz, M.A. Goodale, K.R. Gegenfurtner, “What is the best fixation target? The effect of target shape on stability of fixational eye movements,” Vision Research, 76, 31–42, 2013, doi:10.1016/J.VISRES.2012.10.012.
- The Society for functional Near Infrared Spectroscopy, SNIRF, Dec. 2022.
- A. von Lühmann, A. Ortega-Martinez, D.A. Boas, M.A. Yücel, “Using the General Linear Model to Improve Performance in fNIRS Single Trial Analysis and Classification: A Perspective.,” Frontiers in Human Neuroscience, 14, 30, 2020, doi:10.3389/fnhum.2020.00030.
- T.J. Huppert, S.G. Diamond, M.A. Franceschini, D.A. Boas, “HomER: a review of time-series analysis methods for near-infrared spectroscopy of the brain,” Applied Optics, 48(10), D280–D298, 2009, doi:10.1364/AO.48.00D280.
- A. von Lühmann, X. Li, K.R. Müller, D.A. Boas, M.A. Yücel, “Improved physiological noise regression in fNIRS: A multimodal extension of the General Linear Model using temporally embedded Canonical Correlation Analysis,” NeuroImage, 208, 116472, 2020, doi:10.1016/J.NEUROIMAGE.2019.116472.
- K. Tomita, “Effects of the color of Tablecloths on the Sence of Taste,” Journal of the Color Science Association of Japan, 28, 38–39, 2004.(in Japanese)
- M. Mitsusada, T. Ohkusa, “Effects of brightness of lighting in room on appetite in elder people,” 2019.(in Japanese)
- S. Kobayashi, “Appetite for food illuminated with vivid color lights,” Architectural Institute of Japan’s Journal of Environmental Engineering, 74(637), 271–276, 2009.(in Japanese)
- T. Feiniwa, T. Ueda, A. Hamada, “Research on food distinction and preference through visual sense of the elderly,” Journal of the Japanese Society for Culinary Science, 41(1), 35–41, 2008.(in Japanese)
- M. Mitsusada, “Examination of the effects of food morphology on the mental and physical health of elderly people: from autonomic nervous system responses and subjective evaluation,” Journal of the Japanese Society for Eating and Swallowing Rehabilitation, 17(3), 226–232, 2013.(in Japanese)
- K.N. Boutelle, M.A. Manzano, D.M. Eichen, “Appetitive traits as targets for weight loss: The role of food cue responsiveness and satiety responsiveness,” Physiology & Behavior, 224, 113018, 2020, doi:10.1016/J.PHYSBEH.2020.113018.
- S. Benavides-Varela, D. Gómez, J. Mehler, “Studying neonates’ language and memory capacities with functional near-infrared spectroscopy,” Frontiers in Psychology, 2, 2011.
- H. Obrig, “NIRS in clinical neurology — a ‘promising’ tool?,” NeuroImage, 85, 535–546, 2014, doi:10.1016/J.NEUROIMAGE.2013.03.045.
- T. Ma, H. Lyu, J. Liu, Y. Xia, C. Qian, J. Evans, S. He, “Distinguishing bipolar depression from major depressive disorder using fnirs and deep neural network,” Progress In Electromagnetics Research, 169, 73–86, 2020.
- L.N. van der Laan, D.T.D. de Ridder, M.A. Viergever, P.A.M. Smeets, “The first taste is always with the eyes: A meta-analysis on the neural correlates of processing visual food cues,” NeuroImage, 55(1), 296–303, 2011, doi:10.1016/J.NEUROIMAGE.2010.11.055.
- L. Nummenmaa, J.K. Hietanen, M.G. Calvo, J. Hyönä, “Food Catches the Eye but Not for Everyone: A BMI–Contingent Attentional Bias in Rapid Detection of Nutriments,” PLOS ONE, 6(5), e19215-, 2011.
- L. Danner, S. Haindl, M. Joechl, K. Duerrschmid, “Facial expressions and autonomous nervous system responses elicited by tasting different juices,” Food Research International, 64, 81–90, 2014, doi:10.1016/J.FOODRES.2014.06.003.
- W. He, S. Boesveldt, C. de Graaf, R. de Wijk, “Dynamics of autonomic nervous system responses and facial expressions to odors,” Frontiers in Psychology, 5, 2014.