Indoor Positioning: Comparing Different Techniques and Dealing with a user Authentication use Case

Adv. Sci. Technol. Eng. Syst. J. 8(3), 40–47 (2023);
 DOI: 10.25046/aj080305
Indoor positioning is a complex issue with many, heterogeneous application cases, each one presenting different requirements and environments. In such a complex ecosystem, an agile taxonomy is needed to be able to select a proper solution for a given scenario, as well as practical recommendations for the most used solutions. Besides providing these tools, we analyze a real-world scenario and its requirements, selecting a practical solution and evaluating it together with its implications and consequences, providing a reference guideline for practical applications of indoor positioning.
1. Introduction
The location of objects and people in spaces where satellite technologies fail, or lack precision (e.g., inside complex buildings and underground locations) is a complex issue, while it represents a needed feature with many application cases, including access control, offering of personalized services, navigation in complex structures, crowd control, etc. User location may also be used as an authentication element in the case of critical infrastructure control, such as power plants.
Due to the strong need and the heterogeneity of the use cases, many different solutions have been proposed and developed. Each different context (e.g., commercial building, military facility, critical infrastructure, etc.) presents different scenarios (e.g., available network and infrastructure, barriers, variability and people presence, etc.) and different needs (e.g., cost limits, precision needs, security, privacy, etc.). Similarly, different solutions present different requirements, technologies, costs, and precision. Due to the complexity of the resulting ecosystem, it is important to properly understand the needs of the scenario and the implications of the available solutions. In this paper, we will contrast different techniques for indoor positioning, focusing on different key aspects with the aim of producing guidelines for the technology selection in common scenarios. Finally, we will evaluate different solutions in a real environment and will consider a practical case of location as an authentication element in the context of critical infrastructure management and monitoring in energy production and usage.
The rest of this paper is organized as follows: in Section II we introduce a taxonomy for Indoor positioning solutions, analyzing the different relevant aspects, their solution space, and practical implications. In Section III we analyze different available techniques for indoor positioning, placing them in the proposed taxonomy, analyzing their practical implication, and providing recommendations for the scenarios and environments in which its deployment could be more suitable. In Section IV we present some real-world examples of commercial applications integrating Indoor Positioning, together with the corresponding main characteristics, limitations, and requirements. This analysis includes examples covering applications in the Sport, Logistics, and Food industries. In Section V we evaluate a real-world use case, i.e., the use of indoor location as an authentication factor in critical infrastructure (i.e., energy production management and monitoring), detailing its requirements, selecting a practical solution and testing it in a real, relevant environment, and analyzing its use accounting for the relevant evaluation criteria, i.e., precision, security, confidentiality, integrity, and availability. Finally, in Section V we draw the conclusion of our research work and describe possible future extensions.
2. Solution Taxonomy
Different attempts are available in the literature presenting a classification of positioning techniques. Among the most recent ones, we would like to highlight [1] and [2]. Still, these works perform a much wider analysis and include dimensions that may not be relevant to the scenario analysis and technology selection, such as the purpose (i.e., healthcare, retail, etc.), resulting in a less agile overview and lacking practical recommendations for real-world scenarios. This is why we present here a minimal, yet relevant taxonomy, allowing to order the most used and relevant solutions for indoor positioning.
As introduced, many different techniques are available for indoor positioning, targeting different scenarios and contexts, using different technologies and different base solutions. In this section, we will describe the resulting solution space and define how we limited our scope.
First of all, in the remaining of this paper, we will refer to the object or person to be located as the “target device” (TD), as we will consider solutions where the location is calculated for a device, co-located with the target object or person.
For what concerns the taxonomy dimensions, in the first place, the scope of the techniques may range from (i) knowing the location of a TD in space from an external system (i.e., location), (ii) allowing a TD to know their location in space (i.e., positioning), (iii) following the location of a TD over time (i.e., tracking), (iv) to computing an (optimal) path from the current location of a TD to a specified destination (i.e., navigation). This dimension actually depends on the problem to be solved and most solutions may be used for any scope. Eventual differentiation points in this dimension may be represented by the frequency at which the location is estimated, e.g., if a solution estimated the TD’s location once every minute, it will result in a poor user experience if used in a navigation context.
Secondly, different information may be used as input for the solution, including input from different sensors of the TD and/or from the environment. The solution may use one or more of the following:
- Device motion, including acceleration and changes in the acceleration, tilting angle and its change rate, proximity to specific or generic nearby objects, etc.
- Environment sensing, including light intensity, environmental noise, magnetic field, atmospheric pressure, temperature, environment recognition through the camera, etc.
- Audio production and/or sensing of specifically generated signals.
- Communication with an existing network infrastructure, including Bluetooth beacons, cellular towers, satellite signals, WiFi, etc.
- Detection of specific tags, including visual tags, RFID tags, etc.
Different information may derive from different sensors, whose availability should be checked with the target device set, which may result in different power consumption and costs, may require different infrastructure (e.g., a specific wireless network in the target area), may result in different precision and availability depending on the target scenario, and, finally, may impact in different ways the user’s privacy.
Finally, how this information is used is another big differentiation point among different solutions for indoor positioning. In particular, the input information may be analyzed:
- as a single value (e.g., an intensity measure to calculate the distance from a reference point),
- as a value variation (e.g., acceleration to estimate a path of the TD into an area), or
- against reference values (e.g., pre-mapping of values in the target area and contrasting the measured value against the map).
Solutions belonging to different categories result in different compatibility (e.g., need for specific sensors in the TD, or specific infrastructure in the area), different costs (sensors, infrastructure), and energy consumption and workload for the TD (different sensors, infrastructure, sampling frequency, tracking/navigation, vs. location/positioning), different needs for information exchange between the infrastructure and the TD, resulting in different privacy level for the device user, and, certainly, different precision levels. As such, the selection of the solution to be used in a specific context should be carefully evaluated, taking into account all the relevant aspects.
3. Main Techniques Considered
In this work, we considered techniques not needing an existing infrastructure (i.e., Magnetic Map), or based on the communication with an existing network infrastructure and using standard sensors on the TD, specifically considering WiFi and Bluetooth as network infrastructures, due to their high availability and compatibility with existing mobile devices. In particular, we detected four main solution classes for solutions leveraging on existing WiFi infrastructure, on the basis of the used information: Radio Signal Strength (RSS), Angle of Arrival (AoA), Time of Arrival (ToA), and Fingerprinting. For each considered solution type, recommendations on real-world scenarios in which they may be used are included. A summary of the analyzed solutions is reported in Table I.
The different techniques described can be combined with each other to obtain hybrid solutions (e.g., [3] combining RSS and Fingerprinting, [4], combining Bluetooth Beacons and Fingerprinting, or [5], combining RSS and AoA). This generally results in a higher accuracy compared to the use of solutions using a single technique [6], and/or higher system availability, as if one of the combined solutions alone would not be available in certain areas/settings, the others may be. On the other hand, solution hybridization generally results in higher costs as more infrastructure and/or sensors are needed, as well as more computational power. Still, each individual solution results in a baseline for the combination, considering costs and performance.
3.1 Radio Signal Strength (RSS)
The solutions belonging to this classification use the signal strength of the WiFi network as measuring input. This may either be directly measured or as a Signal-to-noise ratio. This allows for estimating the distance from the WiFi transmitter, whose location is known. Using at least 3 different transmitters, a triangulation is possible and the location may be estimated, like in [7], [8], or [9]. The human body itself alters the received signal strength, as such, the body position with respect to the device should be taken into account.
In general, this class of solutions presents a significant variation in the measured distance between the TD and the signal emission points, due to the TD motion pattern, user positioning with respect to the device, and the presence of eventual obstacles (e.g., metal elements in the building structure). On the other hand, this class of solutions is based on commonly available infrastructure, HW available on any device, and uses standard functions. This class of solutions is recommended for usage in areas clear from obstacles and with a line of sight to the access points.
3.2 Angle of Arrival (AoA)
The solutions belonging to this class use the angle at which the WiFi signal is received as input. In this case, a multidirectional antenna emits broadcast signals with a given frequency, while directional antennas emit specific signals at different given frequencies. The time interval between the reception of the multidirectional and the directional signals allows for calculating the distance between the TD and the emitting antenna. This method, originally used to locate flying devices, has been adapted to indoor positioning, providing higher precision [10], [11], [12].
Similarly to what happens in the RSS case, the presence of obstacles between the TD and the emitting antenna may distort the power and direction of the signal. In general, this class of solutions presents higher precision when the TD is far from the base station, especially in spaces with few or no obstacles (e.g., hangars, open spaces, etc.). This class of solutions is recommended for usage in areas clear from obstacles and with a high distance between the TD and the access points.
3.3 Time of Arrival (ToA)
The solutions belonging to this class use the time difference between the signal emission from the base station and its reception at the TD. This input is then used to estimate the distance between the two elements. Also in this class of solution, the location may be estimated using a triangulation (i.e., at least 3 different transmitters) [13], [14]. In this case, the estimation is affected by the signal attenuation introduced by obstacles, which is reduced using higher frequency signals (e.g., UltraWideband – UWB), resulting in higher precision. Still, the precision of this class of solutions is drastically reduced by obstacles between the transmitter and the TD, even using UWB signals [15]. Another solutions that is ToA-based is LiDAR
(Light Detection and Ranging) which is used to measure distance using light or laser beams. Overall, this class of solutions accounts for higher precision, but requires specific hardware (e.g., UWB transmitters and receivers) and higher area coverage, resulting in higher costs. For the usage of this class of solutions in areas with a high number of obstacles, a higher number of transmitters should be used.
3.4 Fingerprinting
The solutions belonging to this class require a preliminary mapping of the signal fingerprint in the target area (e.g., [16] where the WiFi signals are mapped, or [17] where mapping of WiFi as well as of other signals are considered, or [18], where AoA samplings are mapped). The solution then measures the current signals in the TD and maps them to the most similar fingerprint to estimate the TD location.
On the one hand, this class of solutions does not require special hardware, but it is instead based on the present infrastructure (e.g., WiFi network) and on sensors commonly present on mobile devices (e.g., WiFi antenna), using measurements already commonly performed by mobile devices (e.g., WiFi signal strength). On the other hand, any change in the area setting (e.g., replacing/moving an access point, introduction/elimination repositioning of an interfering element, etc.) requires a new mapping. Fingerprinting introduces ambiguity points, where the fingerprint may be similar and therefore it may not be possible to estimate an accurate location in all cases [6]. Finally, the precision of this class of solutions depends on the number of wireless networks present in the area: the higher, the better. This class of solutions is recommended for usage in areas whose configuration and status are stable in time.
3.5 Bluetooth Beacons
Other kinds of wireless networks may be used to communicate with the TD and estimate its location. Solutions belonging to this class use Bluetooth beacons, with a known location, transmitting any payload to know which devices are present in their coverage area. Intersecting the areas to which a device belongs, it is possible to estimate its location. RSS solutions based on Bluetooth are also possible but result in higher energy consumption and lower precision [19], [20], [21].
The energy consumption of this kind of solution is really low, especially if Bluetooth low energy (BLE) or similar standards are used. At the same time, the payload transmitted by the beacons may be used to transmit useful information (push notifications, localized advertisement or service description, etc.), even if, it should be said, the infrastructure does not provide further services as the internet connectivity provided by the WiFi infrastructure of the solution classes analyzed up to now. On the other hand, specific hardware is required (Bluetooth beacons), in a number (and cost) proportional to the required precision and area to be covered. For the usage of this class of solutions in areas with a high number of obstacles, a higher number of beacons should be used.
3.6 Magnetic Map
Similarly to the solutions explored in section III-D, a mapping of the magnetic field present in the different points of the target area may be performed [22], [23], [24]. This kind of solution requires specialized hardware (i.e., at least 3 magnetic field sensors, specifically aligned and placed on the TD). On the other hand, this type of solution results in higher precision than other methods, although it faces the same drawback as other fingerprinting methods: changes in the environment require the area to be mapped again since its magnetic map may have changed. We have not found evidence of this method being widely implemented, mainly due to its specific hardware requirements.
3.7 Summary
A summary of the analyzed solutions is reported in Table I, together with their classification on the basis of the proposed taxonomy. All these solutions may be used for any scope, depending on the application processing the info they return. As we can see, different solutions result in different tradeoffs, especially regarding costs and precision (“Avg. Error” in Table I). Note that, for each technique, a specific implementation and environment should be taken into account to determine its precision. For each technique, in Table I, the reference implementation is reported in the first column. This should be carefully evaluated, together with the other relevant parameters (i.e., confidentiality, availability, security, integrity), when selecting a practical solution for a specific application scenario. An example of this process will be provided in Section V.
Table 1: Solution summary
| Name | Info | Usage | Cost | Avg. Error |
| RSS [7] | Existing Net. | Single value | Low | 2.9-16.3m |
| AoA [10] | Existing Net. | Single value | Low | 2.1m |
| ToA [15] | Existing Net. | Single value | High | 2m |
| Fingerp. [16] | Existing Net. | Ref. values | Mid | 0.6-1.3m |
| Beacons [19] | Existing Net. | Single value | Mid | 9.7m |
| Magn. Map [22] | Environment | Ref. values | High | 0.1m-0.16m |
4. Using Indoor Positioning: Real World Examples
In this section, we provide some examples of Indoor Positioning as used in real-world commercial applications, together with the corresponding main system characteristics, limitations, and requirements. We will analyze a few examples through Sport, Logistics, and Food industries.
4.1 Using Indoor Positioning in Sports
Some sports have benefited from using indoor positioning techniques, notable examples include tennis, football, and handball. In tennis, precise ball tracking is required to determine whether it is in or out, and many commercial systems are based on optical cameras that track the ball’s position and gather the necessary information for the Hawk-Eye to process. The optical Hawk-Eye system has an estimated error range of 3.6mm at impact [25].
Validations of UWB technology have been executed to compare the accuracy of the optical Hawk-Eye system versus the UWB-based one. In this study, an optical system was paired with a UWB-based Local Positioning System (LPS), and a tennis match was tracked using both systems. Depending on the considered parameters, the mean error range between both systems was in the range of 13.1 to 17.8cm [26]. However, taking the cost of deploying a Hawk-Eye system into consideration, it becomes a competitive alternative. The cost of a professional Hawk-Eye system using 10 high-speed cameras starts at between 60000 to 70000 US dollars per Tennis court [27], while other UWB-based systems’ cost can start at approximately half of this value [28].
The last FIFA World Cup 2022 in Qatar used a UWB-based live ball tracking system developed by Kinexon. The official ball contained an internal sensor weighing 7 grams transmitting in the 500Hz band which, according to Kinexon, tracked the ball’s movement 100 times per second with centimeter accuracy when paired with their real-time locating system (RTLS). Additional metrics can be derived from this data such as ball possession and speed, among others [29].
A study was conducted to assess Kinexon’s solution and compare its error rate to other systems. In this study, the system was used to track both players and the ball, and it was measured in a specially designed circuit on the Fraunhofer L.I.N.K test circuit and in a football game, to gather knowledge regarding how the system would react in different situations. The image of the circuit is included below, and it includes linear sprints, curved sprints, agility tests, and direction changes, among other tests [30].
This system can also be used in handball, although its accuracy is approximately 18,9% lower compared to football due to different sport kinematics [30]. Standard deployment of this system may cost between 20000 to 30000 US dollars per field [28].
As a brief summary, although UWB-based LPS may have a larger error rate compared to visual or infrared systems which are considered the gold standard when taking cost into account, those solutions become an interesting choice.
4.2 Using Indoor Positioning in the storage and distribution industry
An important part of shipping orders is the picking phase, in which the desired items are located in the various warehouses and included in the customer’s order. Depending on the number of items to be picked, this phase may be a time-consuming one, and, as warehouses grow in size, finding the necessary items to complete orders may be a challenging task.
Indoor positioning solutions can be used to guide the worker or smart robot as it navigates the store searching for items (using an optimized route) or to generate real-time product location maps, for example.
Amazon is one of the biggest worldwide retailers and has a large number of warehouses around the world. Those warehouses are run using a technique called “chaotic storage”, in which the items are placed in random locations trying to use the spare space as efficiently as possible, using no predefined zones or locations for those items. This translates into items being tracked solely by software, without relying on the worker or any other method. In Amazon’s case, this storage method generates a large amount of raw data that can be used to improve internal processes, such as tracking stock or sending items first with a closer expiration date [31].
4.3 Using Indoor Positioning in the food industry
Restaurants have benefited from using indoor positioning systems to enhance their efficiency, reduce wait times and offer a better customer experience. As an example, fast food restaurants use these LPS to track food delivery after the order is placed through kiosks. A marker is assigned to the order and allows the restaurant’s personnel to determine where the customer is seated in order to deliver the order.
For example, one such platform is the LPS deployed at select McDonald’s locations, which is based on Bluetooth Low Energy (BLE) technology developed by Acrelec and Radius Technology Inc. These devices are located on plastic table markers, powered by a button cell Lithium battery and their size is approximately two regular coins.
According to the manufacturer, the device’s main microprocessor is an ARM-based Cortex M4 SOC (Nordic Semiconductor nRF52832) and includes different sensors such as an accelerometer and fall detection. This SOC states it supports different protocols such as Apple’s iBeacon, AltBeacon, and Google’s Eddystone, allowing for device interoperability, and has a maximum transmission distance of 100 meters [32]. This SOC is also very popular among enthusiasts, mainly due to its features, cost, and compatibility with Arduino development boards, even though it does not include integrated Wi-Fi functionality.
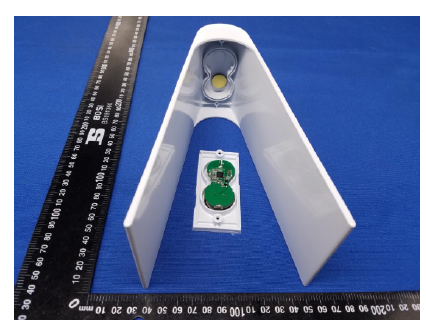
Figure 1: View of the plastic table marker and the internal BLE beacon [32].
Acrylic’s platform allows floor maps to be included in their platform, showing the location of the marker on the restaurant’s floor plan to help the staff locate the customer in a timely manner.
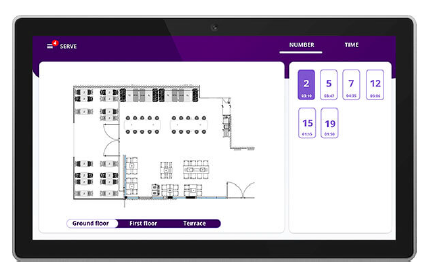
Figure 2: View of Acrelec’s Table Service platform [33].
5. The User Authentication Case
More and more users consume resources and services from mobile devices. Authenticating these users is of paramount importance to regulate the access to services, resources, and sensitive data, and to limit it to only authorized users. User authentication is the process of establishing with reasonable accuracy whether users are who they claim to be. The process is usually based on some credentials, whose ownership and verification guarantee to check the user identity, and that may fall into one of the following categories: (i) something that the user knows (e.g., a secret keyword), (ii) something that the user owns (e.g., a physical object like a smart card), (iii) something that the user is (e.g., any measurable physical feature, univocally identifying the user, like fingerprints or iris identification, for instance), (iv) something that the user does (e.g., motion patterns, signature, etc.), or (v) somewhere that the user is (e.g., being in a specific location). This information (identifier), may be combined including information belonging to different categories, to improve security (i.e., Multi-factor authentication, like when a user is asked for a password – something that the user knows – and to enter a code received at their mobile phone – something that the user owns). In particular, in the case of power-plant control and monitoring, as in the Robinson Project, due to the sensitivity of the context and to the possible consequences of identity theft, we proposed an identification mechanism including positioning among the used identification elements: the user must be physically present where they are accessing the service (Power plant monitoring and control), in order for them to be allowed to access the service itself. As physical access is subject to other external security measures, this solution guarantees a very strong identification.
5.1 Target Requirements
In order to select a specific solution for the considered context, we must keep into account the different analyzed parameters. In the considered scenario, location is the only relevant scope of the solution, while the other leading factors are the technology availability and compatibility, the solution availability, precision (Maximum error lower than the distance between the control panel and the access to the closest room, 2.5m in the example taken into account. A different threshold or a confidentiality interval may be set depending on the environment), and data security and privacy (extremely relevant in an authentication context). On the other hand, the environment is not subject to frequent changes or variable interference (e.g., crowd presence). As such, the natural choice is to use a Fingerprinting solution based on WiFi.
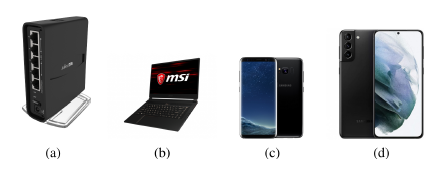
Figure 3: Devices used for the solution evaluation: (a) Mikrotik access point, (b) laptop, (c) Galaxy S8 (TD), and (d) Galaxy S21.
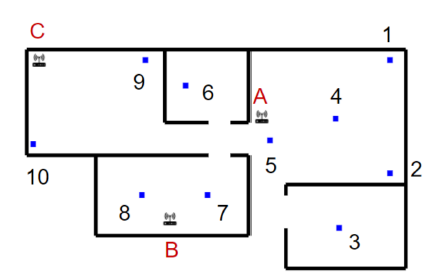
Figure 4: Evaluation environment, including equipment placement (A, B, and C) and measurement points (1 to 10).
5.2 Evaluation Scenario
We used a real environment and deployed the Anyplace tool [34] to evaluate the selected solution. Anyplace relies on fingerprinting, as well as RSS, and combines several methods to obtain a lower error margin. Networking equipment was installed in this environment, using a Mikrotik hap AC2 access point broadcasting on both 2.4 and 5GHz bands, a laptop equipped with a Killer AC1550i WiFi card, and a Galaxy S21 mobile phone acting as a hotspot, both broadcasting on the 2.4GHz band. A Galaxy S8 mobile phone acted as TD. The used devices are depicted in Figure 1. The software solution used in this scenario was Anyplace, running on the University of Cyprus’ public servers. A single-floor, multi-room space divided with masonry walls was used as an evaluation environment. The equipment was placed as shown in Figure 2 to cover an area of about 52m2.
Measurements were taken on the points highlighted in Figure 2. At each point, we took four consecutive readings and averaged the result to smoothen possible interference or disruption, measuring the error as the linear distance between the detected and real location. This measurement-taking procedure was repeated on three occasions: with a single access point (i.e., the Mikrotik access point – A), with two access points (i.e., including also the laptop – B), and with three access points (i.e., including also the Galaxy S21 hotspot – C).
5.3 Results
As introduced above, in order to evaluate the solution, we take into account different aspects: the solution precision in estimating the TD location, and the solution security, confidentiality, integrity, and availability.
Evaluating the solution precision, the measurement error for the different configurations is reported in Table II for the different measurement points, on average, and as an improvement with respect to the base configuration with a single access point (i.e., “Difference” in Table II).
Table 2: Measurements results: error in the location estimation for the different measurement points, in meters. The difference percentage is calculated from reference measurement (1 AP).
| Point | 1 AP | 2 APs | 3 APs |
| 1 | 0.91 | 0.83 | 0.81 |
| 2 | 0.85 | 0.79 | 0.78 |
| 3 | 1.09 | 0.93 | 0.90 |
| 4 | 0.68 | 0.64 | 0.63 |
| 5 | 0.48 | 0.47 | 0.44 |
| 6 | 1.15 | 1.11 | 1.11 |
| 7 | 1.03 | 0.83 | 0.74 |
| 8 | 1.29 | 0.74 | 0.69 |
| 9 | 2.88 | 2.45 | 2.38 |
| 10 | 3.28 | 3.4 | 2.11 |
| Average | 1.36 | 1.22 | 1.06 |
| Difference | Reference | 10.63% | 22.36% |
As expected, as the number of reachable access points increases, the location estimation becomes more accurate, since the TD can use more anchors to perform distance calculations. As such, by increasing the number of available access points, the precision may be tuned to meet the system requirements and to reduce the probability of false room location to an amount irrelevant even for critical scenarios such as energy-production management and monitoring.
In order to evaluate the measurement error against the set threshold, a similar measurement campaign should be carried out in the target scenario (i.e., the power plant control room), which was not accessible to the authors, but this analysis may be considered a guideline for the one targeting a specific deployment.
Regarding confidentiality, Anyplace uses fully-encrypted communications using Transport Layer Security (TLS) between its API, internal components, and clients. Furthermore, devices are identified by their system certificates. This provides an additional layer of protection and makes Man-InThe-Middle (MITM) attacks more difficult, mitigating the risk of modifying the encrypted traffic. Finally, the building may be configured as private, protecting its information through a random string identifier (Universal Unique Identifier UUID).
Considering the availability of this solution, a mirror service may be added to provide redundancy and/or to scale the solution. In this evaluation, Anyplace public productive environment was used, but it can also be downloaded and deployed in a local environment to add eventual mirror services and offer this way a configurable level of availability, and/or load balancing. Additionally, its components can be deployed in containers, which can provide means for automatic autoscaling in cloud environments.
Analyzing the solution’s security, it supports the integration of a Web Application Firewall (WAF). The WAF is not integrated into the public instancing of Anyplace, but it may be integrated into the case of a local deployment. The WAF integration allows checking the network traffic directed toward the application (i.e., identifying potential attacks), and acting on it if needed. Still, Anyplace does not allow to set an expiration time for active sessions, neither in the case of inactivity, opening the possibility for a malicious third party to use an open session from an unattended device, contrary to the recommendations from the Open Web Application Security Project (OWASP) [35]. As the location is not the only authentication factor in the target solution, this flaw is considered minor.
Finally, we will analyze the solution integrity, i.e., the data exchanged among the different solution components is guaranteed to not be altered during transmission. The communication among system components is encrypted using the HTTPS protocol using TLS, and they require a valid certificate, signed by a Certification
Authority (CA), protecting data transmission from MITM attacks and other transmission alterations. Finally, on every single node, redundancy may be set allowing for a configurable fault tolerance threshold.
6. Conclusions
In this paper, we analyzed the general problem of indoor positioning, reviewing the different characteristics offered by the different available solutions. We proposed a simple, yet agile and effective taxonomy to sort the solution space, a needed task when selecting the optimal solution for a specific use case. Then we analyzed different available solutions, offering practical recommendations for the scenarios in which they may be used, as well as the requirements they may or may not meet. This represents an addition to previous analysis for similar solution sets. As a following step, we present different real-world applications integrating indoor positioning. We analyze their main characteristics, requirements, and limitations. Finally, we evaluated a real scenario, i.e., location as an authentication factor for a management and monitoring system for energy production. For the analyzed scenario, we select and evaluate a solution in a real test environment. The selected solution was able to meet the precision, security, confidentiality, integrity, and availability requirements of the target system.
As a future work, it would be interesting to evaluate different real case scenarios, possibly involving different application domains. For each scenario, the corresponding system requirements must be evaluated, and a set of guidelines for solutions to be selected would be generated as output, together with guidelines for the configuration to be used. Furthermore, we would compare the performance of indoor positioning solutions across different types of environments, in order to be able to provide more specific guidelines for the technology selection and configuration.
Acknowledgment
This work was funded by EU Horizon 2020 research and innovation programme, Robinson Project, grant agreement N° 957752.
- F. Zafari, G. Athanasios, K. L. Kin, “A survey of indoor localization systems and technologies,” IEEE Communications Surveys & Tutorials, 21, 2568–2599, 2019, doi:10.1109/comst.2019.2911558.
- K. Nguyen, Z. Luo, G. Li, C. Watkins, “A review of smartphones-based indoor positioning: Challenges and applications,” IET Cyber-Systems and Robotics, 3, 1–30, 2021, doi:10.1049/csy2.12004.
- S. Li, R. Rashidzadeh, “Hybrid indoor location positioning system,” IET Wire- less Sensor Systems, 9, 257–264, 2019.
- V. Nair, C. Tsangouri, B. Xiao, G. Olmschenk, W. Seiple, Z. Zhu, “A hybrid indoor positioning system for blind and visually impaired using Bluetooth and Google tango,” Journal on technology and persons with disabilities, 6, 2018, doi:10.1049/iet-wss.2018.5237.
- A. Catovic, S. Zafer, “The Cramer-Rao bounds of hybrid TOA/RSS and TDOA/RSS location estimation schemes,” IEEE Communications Letters, 8, 626–628, 2004, doi:10.1109/lcomm.2004.835319.
- A. Yassin, Y. Nasser, M. Awad, A. Al-Dubai, R. Liu, C. Yuen, R. Raulefs, E. Aboutanios, “Recent Advances in Indoor Localization: A Survey on The- oretical Approaches and Applications,” IEEE Communications Surveys & Tutorials, 19, 1327–1346, 2017, doi:10.1109/comst.2016.2632427.
- P. Bahl, V. Padmanabhan, “RADAR: An In-Building RF-based User Lo- cation and Tracking System,” in Proceedings IEEE Infocom 2000 Confer- ence on Computer Communications. Nineteenth Annual Joint Conference of the IEEE Computer and Communication Societies, 775–784, 2000, doi: 10.1109/infcom.2000.832252.
- W. Chen, K. Kao, Y. Chang, C. Chang, “An RSSI-based distributed real-time indoor positioning framework,” in 2018 IEEE International Conference on Applied System Invention (ICASI), 1288–1291, 2018, doi:10.1109/icasi.2018. 8394528.
- J. Yang, C. Yingying, “Indoor localization using improved rss-based latera- tion methods,” in GLOBECOM 2009-2009 IEEE Global Telecommunications Conference, 1–6, 2009, doi:10.1109/glocom.2009.5425237.
- D. Niculescu, B. Nath, “VOR Base Stations for Indoor 802.11 Positioning,” in MobiCom ’04: Proceedings of the 10th annual international conference on Mo- bile computing and networking, 58–69, 2004, doi:10.1145/1023720.1023727.
- M. Kotaru, K. Joshi, D. Bharadia, S. Katti, “Spotfi: Decimeter level local- ization using wifi,” in Proceedings of the 2015 ACM Conference on Special Interest Group on Data Communication, 269–282, 2015, doi:10.1145/2785956. 2787487.
- C. Lim, P. N. Boon, D. Duan, “Robust methods for AOA geo-location in a real-time indoor WiFi system,” Journal of Location Based Services, 2, 112–121, 2008, doi:10.1080/17489720802415189.
- A. Fedotov, V. Badenko, V. Kuptsov, S. Ivanov, I. Struchkov, “Location measurement of an object using radio networks for Industry 4.0 applica- tions,” in E3S Web of Conferences, EDP Sciences, 2021, doi:10.1051/e3sconf/ 202126405060.
- J. Shen, A. F. Molisch, J. Salmi, “Accurate passive location estimation using TOA measurements,” IEEE Transactions on Wireless Communications, 11,
82–2192, 2012, doi:10.1109/twc.2012.040412.110697. - G. Hu, P. Feldhaus, Y. Feng, S. Wang, J. Zheng, H. Duan, J. Gu, “Accu- racy Improvement of Indoor Real-Time Location Tracking Algorithm for Smart Supermarket Based on Ultra-Wideband,” International Journal of Pattern Recognition, 33, 1–27, 2019, doi:10.1142/s0218001420580045.
- M. Youssef, A. Agrawala, “The Horus WLAN location determination system,” in Proceedings of the 3rd International Conference on Mobile Systems, Applica- tions, and Services – MobiSys, 205–218, 2005, doi:10.1145/1067170.1067193.
- X. Zhu, W. Qu, T. Qiu, L. Zhao, M. Atiquzzaman, D. Wu, “Indoor intelli- gent fingerprint-based localization: Principles, approaches and challenges,” IEEE Communications Surveys & Tutorials, 22, 2634–2657, 2020, doi: 10.1109/comst.2020.3014304.
- L. Chen, I. Ahriz, D. L. Ruyet, “AoA-aware probabilistic indoor location fin- gerprinting using channel state information,” IEEE Internet of Things Journal, 107, 10868–10883, 2020, doi:10.1109/jiot.2020.2990314.
- F. Zafari, I. Papapanagiotou, K. Christidis, “Micro-location for Internet of Things equipped Smart Buildings,” IEEE Internet of Things Journal, 3, 96–112, 2016, doi:10.1109/jiot.2015.2442956.
- L. Bai, F. Ciravegna, R. Bond, M. Mulvenna, “A low cost indoor positioning system using bluetooth low energy,” IEEE Access, 8, 136858–136871, 2020, doi:10.1109/access.2020.3012342.
- S. S. Chawathe, “Beacon placement for indoor localization using bluetooth,” in 2008 11th International IEEE Conference on Intelligent Transportation Systems, 980–985, 2008, doi:10.1109/itsc.2008.4732690.
- H. Kim, W. Seo, K. Baek, “Indoor Positioning System Using Magnetic Field Map Navigation and an Encoder System,” Sensors, 17, 2017, doi: 10.3390/s17030651.
- D. Almeida, E. Pedrosa, F. Curado, “Magnetic mapping for robot navigation in indoor environments,” in 2021 International Conference on Indoor Position- ing and Indoor Navigation (IPIN), 1–8, 2021, doi:10.1109/ipin51156.2021. 9662528.
- M. Frassl, M. Angermann, M. Lichtenstern, P. Robertson, B. J. Julian, M. Doniec, “Magnetic maps of indoor environments for precise localiza- tion of legged and non-legged locomotion,” in 2013 IEEE/RSJ Interna- tional Conference on Intelligent Robots and Systems, 913–920, 2013, doi: 10.1109/iros.2013.6696459.
- F. Rioult, S. Mecheri, B. Mantel, F. Kauffmann, N. Benguigui, “What Can Hawk-Eye Data Reveal about Serve Performance in Tennis?” in MLSA15 – Machine Learning and Data Mining for Sports Analytics workshop (ECML / PKDD 2015), Porto, Portugal, 36–45, 2015.
- A. Umek, A. Kos, “Validation of UWB positioning systems for player track- ing in tennis,” Personal and Ubiquitous Computing, 26, 1023–1033, 2022, doi:10.1007/s00779-020-01486-0.
- K. Wong, “Low-cost Tennis Line Call System with Four Webcams,” Depart- ment of Applied Physics, Stanford University, 2016.
- Compare Sport Tech, “Compare LPS,” https://www.comparesportstech. com/compare-lps-tracking-systems, retrieved on February 14th, 2023.
- KINEXON, “Everything You Need To Know About Ball Tracking,” https://kinexon.com/blog/ everything-you-need-to-know-about-ball-tracking/, retrieved on February 14th, 2023.
- P. Blauberger, R. Marzilger, M. Lames, “Validation of Player and Ball Tracking with a Local Positioning System,” Sensors, 21, 2021, doi:10.3390/s21041465.
- A. Delfanti, The Warehouse, Pluto Press, 2021, doi:10.2307/j.ctv2114fnm.
- Federal Communications Commission, “OET Authorization Search Results,”https://gov.fccid.io/2ABYU-RBT003, retrieved on February 14th, 2023.
- ACRELEC, “Table service,” https://acrelec.com/table-service/, retrieved on February 14th, 2023.
- K. Georgiou, T. Constambeys, C. Laoudias, L. Petrou, G. Chatzimilioudis, D. Zeinalipour-Yazti, “Anyplace: A Crowdsourced Indoor Information Service,” in Proceedings of the 16th IEEE International Conference on Mobile Data Management (MDM ’15), 291–294, 2015, doi:10.1109/mdm.2015.80.
- OWASP, “Session Management – OWASP Cheat Sheet Series,” https://cheatsheetseries.owasp.org/cheatsheets/Session_ Management_Cheat_Sheet.html, retrieved on February 14th, 2023.