Landmarking Technique for Improving YOLOv4 Fish Recognition in Various Background Conditions
 , Taweepol Suesut
Adv. Sci. Technol. Eng. Syst. J. 8(3), 100–107 (2023);
 DOI: 10.25046/aj080312
The detection and classification of fish is a prevalent and fascinating area of study. Numerous researchers develop skills in fish recognition in both aquatic and non-aquatic environments, which is beneficial for population control and the aquaculture industry, respectively. Rarely is research conducted to optimize the recognition of fish with diverse backgrounds. This paper proposes a method for fish recognition that uses the landmarking technique to optimize YOLO version 4 to detect and classify fish with varying background conditions, making it applicable for both underwater and terrestrial fish recognition. The proposed procedure was evaluated on the Bringham Young University (BYU) dataset containing four different fish species. The final test results indicate that the detection accuracy had reached 96.60% with an average confidence score of 99.67% at the 60% threshold. The outcome is 4,94% better than the most common traditional labeling method.
1. Introduction
Fish detection and classification, or fish recognition, are exciting and popular research topics [1]. Numerous researchers devise techniques for recognizing fish in underwater and out-of-water environments [2]. Recognition of fish in their underwater condition is beneficial for fish population control and their long-term viability [3-8], especially in light of climate change and global warming [5, 8-10]. It is advantageous for the aquaculture industry to recognize fish in conditions outside the water, such as through automatic classification processes, fish quality control, or other processes [2, 11].
Fish recognition has quite complex and varied challenges, both in conditions in the water and outside the water [1]. The challenges of recognizing fish in underwater conditions are; resolution of the image, swimming freely, camouflaging with other objects and other fish, in various background conditions and lighting conditions, and other challenges such as noise [3, 5, 7-9, 12]. For fish recognition in out-of-water conditions, the challenges that arise are structural deformations of the fish, such as the condition of the eyes, scales, abdomen, and fins that are damaged lightly, moderately, or severely. The condition of random fish positions is also a challenge in this recognition process [11].
Many image processing techniques are used to overcome the challenges, such as; noise filtering by the median filter [11], fish head detection using convex-hull deficiency [11], Color Multi-Scale Retinex (MSR) to overcome water turbidity [13], orientation correction using MSEE [11], contrast enhancement to find a fish disease [14], and auto segmentation of fish objects with various techniques [9, 11]. Deep learning methods or models are also widely used for fish detection and classification, such as Convolutional Neural Network (CNN) [3, 4, 15-18], YOLO [5, 13, 19-23], few-shot learning for limited training images [6], Alex-Net, ResNet-18, ResNet-50, Inception V3, GoogleLeNet [11], etc.
Numerous strategies have been implemented to overcome the various background challenges and optimize the fish recognition results. CNN was used to classify fish in [3] by training it with the number of species and their environments, including reef substrates and water. They applied their proposed method to 116 videos of fish captured underwater with a GoPro camera. The greatest results were obtained when classifying nine of the twenty fish species that appear most frequently in the videos. Using an ensemble of seven CNN components and two Region Proposal Networks (RPNs) coupled by sequentially jointly trained Long Short-Term Memory (LSTM) units, a multi-cascade object detection network was constructed as described in [4].
They used a collection of 18 underwater fish recordings recorded with a GoPro underwater camera for training and testing. Even though their proposed method can reliably identify and count fish objects in a variety of benthic backgrounds and lighting conditions, it is not used to classify fish. Rather, it is used to locate fish. Using classic CNNs such as these has benefits when applied to other industries, such as agriculture [24] or in other general situations, such as detecting micro scratches [25]. In [12], the foreground extraction was implemented and a CNN-based algorithm with an SVM classifier was created. The instant segmentation on underwater fish images was proposed in [9] and then developed an algorithm based on Res-Net. The recognition of moving fish in [5] used Optical flow, GMM (Gaussian Mixture Models), and ResNet-50, and then combined the output with YOLOv3. The combination of these techniques allowed for the robust detection and classification of fish, which was applied to the LifeCLEF 2015 benchmark dataset from the Fish4Knowledge repository [26] and a dataset collected by the University of Western Australia (UWA) that was described in detail [27]. The GMM and Pixel-wise Posteriors were proposed in [8], and then combined with CNN in [28] for further development. In addition, they utilized a fish dataset extracted from the Fish4Knowledge repository. Similar to the work [4], the approaches proposed in their papers were limited to fish detection without classification.
The fish was divided into three sections: the head, the torso, and the scales [11]. Alex-Net was then utilized to categorize each of these components. The ultimate classification results were then determined utilizing Naive Bayesian Fusion (NBF). This method performed admirably when applied to the Fish-Pak [29] and Bringham Young University (BYU) datasets [20]. Even though the narrative of this work was intended for an automatic classification system, the fish images used were static. The method for detecting fish in aquaculture ponds was developed in [13]. YOLOv3 was utilized to detect the fish after image enhancement was used to improve fish detection in murky water conditions. This method is not intended for classification, but rather for counting and monitoring the trajectory of fish. Faster R-CNN was used to detect and record fish trajectories and compared with YOLOv3 to investigate its behavior and relationship to ammonia levels in pond water [30].
However, the works cited in [3-5, 8, 28] identified moving fish for underwater (ocean) environments, whereas other works merely detected fish without classifying them. In aquaculture, the works of [13] and [30] discovered swimming fish, but it was not used for classification. The work described in [11] classified fish using narration for an automatic classification system, but the datasets used were images that were not dynamic. According to the knowledge of the authors, there is no public dataset for cultured fish that travel on conveyors, and there is no published work to detect and classify moving fish for the fish culture industry, particularly for automatic sorting based on fish species using deep learning and computer vision.
There are numerous versions of YOLO (You Only Look Once) algorithms, such as YOLOv3 [19], YOLOv4 [23], and YOLOv5 [21], that are suitable for real-time applications in terms of detection speed and precision. The optimal algorithm is YOLOv5, but we opted for YOLOv4 on the CiRA-Core platform, which yielded satisfactory results. This study proposes a straightforward method that incorporates the landmarking technique and YOLOv4 for identifying and classifying fish in various background conditions. In the most prevalent labeling technique, the accuracy results will be compared to the conventional “box-squeezing-object” method.
This paper proposes and evaluates a method for detecting and classifying fish using deep learning and computer vision on real videos of aquaculture freshwater fish moving along a conveyor belt for automatic sorting. Consequently, the proposed methodology originates from the following major contributions.
- We created our own database of eight species of cultivated fish. The dataset includes both static images and videos of fish moving at random with two distinct speeds (i.e., low and high) on a conveyor belt.
- This method used YOLOv4, a widely-used recognition algorithm that was optimized using a novel labeling method.
- Additionally, trial research evaluating the efficacy of multiple strategies was conducted. These are training schemes, variants of YOLOv4, and labeling technique comparisons.
The paper is therefore divided into four sections. Section 1 introduces the background of the problem, and approaches from previous researchers. In Section 2, the input datasets, augmentation techniques, landmarking, and algorithms used in this study are discussed. Section 3 contains the outcomes of the experiment. In Section 4, a conclusion and future work are summarized.
2. Material and Methodology
2.1. Dataset and Image Augmentation
This study aimss to detect and categorize fish in a variety of background conditions, such as objects, hues, and others. For this reason, the BYU dataset is deemed highly suitable for use in this work. This dataset was developed by the robotic vision group at Brigham Young University [20], which contains sixteen species of fish photographed under various conditions. Multiple images of fish are captured in the processing unit on a table equipped with an image calibration plate, which provides guidelines for preprocessing and color correction. Other fish photographs were captured in nature and water. Some images have also been altered by means of cropping, recoloring, etc.
Additionally, each species’ image from the sixteen different fish species is quite imbalanced. Due to these factors, only four species were obtained in this study despite the large quantity of image data, unprocessed raw images, and diverse background conditions, i.e., natural and underwater backgrounds. The four fish species listed in Table 1 are B.C. Trout, Kokanee, UT Sucker, and Steal Head. Figure 1 contains illustrations of image data from the BYU dataset. Table 1 shows that the amount of images for the three classes, Kokanee, UT Sucker, and Steal Head, is insufficient and out of proportion to the amount of image data for the entire class. Less than 100 data points reduce validation, and unbalanced data inhibits the algorithm from having the same training chance. Table 2 displays the statistical data for the BYU dataset and image augmentation. This calls for a procedure of augmentation [11]. In this study, the augmentation methods employed include flip, rotation, and translation. This method is thought to be appropriate for fish augmentation [21].
Table 1: BYU dataset and image augmentation
| Fish
class |
No. of images | Multiplication
factor |
No. of augmented
images |
New
image dataset |
For
training (80%) |
For
testing (20%) |
| B.C. Trout | 191 | 0 | 0 | 191 | 153 | 38 |
| Kokanee | 60 | 1 | 60 | 120 | 96 | 24 |
| UT Sucker | 87 | 1 | 87 | 174 | 139 | 35 |
| Steal Head | 25 | 3 | 75 | 100 | 80 | 20 |
| Total | 363 | – | 222 | 585 | 468 | 117 |
Table 2: Statistical data of BYU dataset and image augmentation
| No. of images | Fish class | Total | Standard Deviation Value (SDV) | Average | |||
| B.C. Trout | Kokanee | UT Sucker | Steal Head | ||||
| Images dataset | 191 | 60 | 87 | 25 | 363 | 61.91 | 91 |
| New images dataset | 191 | 120 | 174 | 100 | 585 | 37.42 | 146 |
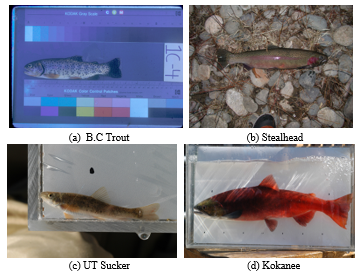
Figure 1: Sample images of BYU dataset
Initially, the number of images (Nc) for each class of fish images ( ) is determined as shown in (1). The multiplication factor ( ) is obtained by comparing the target ( ) with the number of images in each class ( ) as in (2). In this work, the target ( ) is set at 100 for each class. The set of multiplication factors ( ) is obtained by repeating the procedure for each class of fish. The multiplication factor indicates the number of augmented images that need to be created from each image ( ) in each class of fish. Flip ( ), rotation ( ), and translation vector ( ) are selected randomly and generate an augmented image of the set obtained from a single image ( ) as in (3). The variances of each of the flip ( ), rotation ( ), and translation vectors ( ) were predetermined. Finally, all the augmented image sets ( ) are merged with the original image set ( ), and a new data set ( ) is formed as in (4).
After the augmentation procedure, the number of images in the new dataset, which ranges from 363 to 585, has increased significantly. The average number of images in each class increased from 91 to 146. In addition, the dataset is now more evenly distributed, as indicated by the decrease in standard deviation from 61.91 to 37.42. The training (80%) and testing (20%) processes were then randomly applied to the images [7].
2.2. Occupancy Ratio and Landmarking Technique
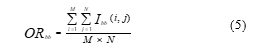
The occupancy ratio (OR) compares the object area to the overall image area or bounding box, which includes the background, and is measured in M ´ N. The high occupancy ratio reduces the likelihood of an algorithm for deep learning capturing extraneous backgrounds during training. It will increase the effectiveness of deep learning in identifying features unique to objects. The occupancy percentage is represented by the following expression [11]:
The landmarking technique is a relatively new labeling method that is still infrequently employed, particularly on fish objects. This technique is utilized immediately prior to the image being utilized in the training procedure. With this technique, any portion of the object may be marked and become an area that is processed only during training. The OR will increase to a very high level or even reach unity, resulting in more accurate and efficient extracted feature maps. As a result, the training process will be more efficient, and the recognition results are anticipated to be more accurate and robust.
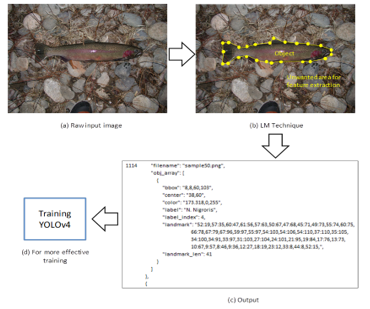
Figure 2: Landmarking technique.
In theory, the landmarking technique will arrange the object’s coordinate coordinates into a polygon and create an area on the object. Only objects or portions of objects that have been marked as areas will be extracted later for the training process; disregard other objects outside of the area. This method is utilized concurrently during the labeling procedure (class recognition). In addition to bounding box (bbox), center point, color, label, and index label information, the output of this process includes landmark points and landmark len, which will be utilized to improve the effectiveness of the training process. Figure 2 illustrates the concept of this method of landmarking.
Figure 3 illustrates procedure of the proposed scheme. First, the image data from the BYU dataset were subjected to an image augmentation procedure in order to increase the number of images by means of twisting, rotating, and transitioning. The new fish image dataset was then partitioned into two parts: 80% for the training dataset, which was subjected to the landmarking technique and trained with YOLO v4, and 20% for the testing dataset. Accuracy, precision, recall, specificity, and the F1 score were the outcomes of the classification procedure. Using the CiRA-Core software, this method of landmarking is implemented.
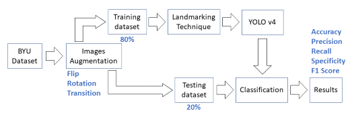
Figure 3: Overview of the proposed scheme.
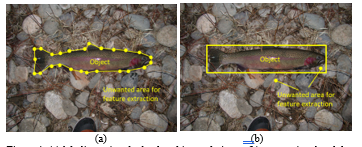
Figure 4: (a) labeling using the landmarking technique (b) conventional and the most commonly labeling technique.
This paper also discusses fish recognition using the most prevalent conventional labeling method, namely the “box squeezing object” method. Figure 4 illustrates the distinction between the landmarking method and the conventional method.
2.3. YOLOv4
In this experiment, the detection and classification algorithm is YOLO version 4 (YOLOv4). YOLO is an algorithm for detecting and classifying viral objects. Due to its reasonable detection rate, accuracy, and quick detection time, YOLO has become popular and extensively employed. YOLO operates differently than the majority of other object detection algorithms. A singular neural network is applied to the entire image by YOLO. The network will segment the image into regions, identify the bounding box, and designate a probability value. The probability of classifying each unit within the boundary as an object or not is measured. Finally, the bounding box with the highest value is chosen as the object separator [23]. It makes the YOLO algorithm suitable for detecting fish as objects in a variety of background conditions, even when the background is in motion or when there are multiple fish in a single image. As depicted in Figure 5 [23], the initial YOLO structure and working system consisted of 24 convolutional layers and two completely connected layers.
The YOLOv4 utilized in this work is the April 2020 release of the fourth development version of YOLO [23]. In this research, YOLOv4 achieves state-of-the-art performance with 43.5% AP operating at 65 FPS in real time on a Tesla V100 with the MS COCO dataset. To achieve these outcomes, they combine Cross-Stage-Partial-connections (CSP), DropBlock regularization, Weighted-Residual-Connections (WRC), Self-adversarial-training (SAT) and Mish -activation, CIoU loss, Cross mini-Batch Normalization (CmBN), and Mosaic data augmentation [31].
As shown in Table 1, YOLOv4 was trained using training data from the BYU dataset and was able to achieve acceptable results with an average loss of 0.01. Training is conducted with 32 data points and 32 subdivisions per iteration. Data enhancement is performed by rotating a threshold between -180° and 180° with 90 steps and comparing it to a threshold between 0.4 and 1.1 with 0.2 steps. Simulating noise and blur during the training procedure is not used to improve data.
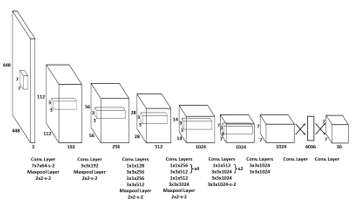
Figure 5: YOLO architecture [22].
2.4. Validation Matrix
The confusion matrix is utilized to characterize the model’s performance. The confusion matrix is composed of four components: True Positive (TP) and True Negative (TN) for fundamental truth, and False Positive (FP) and False Negative (FN) for fundamental false. TP is when the model correctly detects the object, TN is when the model does not detect because the object does not exist, FP is when the model detects an object incorrectly, including double detecting, and FN is when the model does not detect objects [32].
- Accuracy
One of the evaluation metrics is accuracy. It is defined as the proportion of correctly classified fish to the total number of fish in the test set.
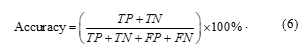
Alternately, the following relation represents a comparison between the total number of predictions and the number of accurate predictions as a measure of the model’s precision.
In (7), is the number of correct predictions, and is the total number of predictions.
- Precision
Precision is the ratio of correctly classified fish (TP) to positive detection (TP + FP). It determines the percentage of precisely classified fish as specified by:
![]()
- Sensitivity
Sensitivity is the ratio of correctly classified fish (TP) to fundamental truth fish (TP + FN), as defined by:
![]()
- Specificity
Specificity is determined by the ratio of TN to the sum of FP and TN, as stated below:
![]()
- F1 Score
F1 Score (Measure F) is a metric derived from the average of precision symphony and memory [32], based on the following relationship:
![]()
3. Experimental Results
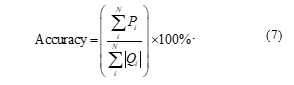
The proposed method has been evaluated based on the BYU testing data set. The testing data consists of 20% of each image of four fish classes (species) that have been enhanced, as shown in Table 1. At the 50% threshold, the average ultimate detection accuracy is 94.22% and the average classification score for correct detection is 99.42%. The UT Sucker class had the lowest accuracy at 88.57%, while the Kokanee class had the highest accuracy at 100%. Table 3 provides a summary of the results, while Figure 6 depicts the confusion matrix.
Interestingly, the detection continues to run well even though there are actually different types of fish in one class (class BC Trout, Kokanee, and UT Sucker). There are several types of BC Trout, including BC Trout Provo, BC Trout Little Dell, and BC Trout H Creek in the BC Trout class. These varieties of BC Trout have different colors and scales. As depicted in Figure 7, there are variants of Kokanee Male and Kokanee Female within 1 Kokanee class that have slightly distinct morphologies. Similarly, the UT Suckerfish class includes the fish species UT Sucker, UT Sucker Weber, and UT Sucker Imm Weber, each of which has a slightly unique scale pattern.
Table 3: Experimental results of YOLOv4 with landmarking technique at the 50% threshold.
| Threshold: 50% | ||||||||
| Class | Testing data | Correct classification | Wrong classification | Not detect | Double classification | Total prediction | Accuracy (%) | Avg. Classification score (%) |
| BC Trout | 38 | 35 | 0 | 3 | 0 | 38 | 92.11 | 99.67 |
| Kokanee | 24 | 24 | 0 | 0 | 0 | 24 | 100.00 | 99.93 |
| UT Sucker | 35 | 31 | 1 | 0 | 3 | 35 | 88.57 | 99.20 |
| Steelhead | 20 | 19 | 0 | 0 | 1 | 20 | 95.00 | 99.09 |
| Total | 117 | – | – | – | – | – | – | – |
| Average | – | – | – | – | – | – | 93.92 | 99.47 |
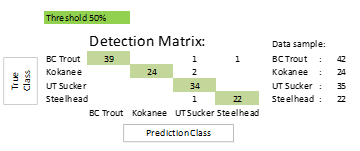
Figure 6: Confusion matrix for experiment results of YOLOv4 with landmarking technique at the 50% threshold.
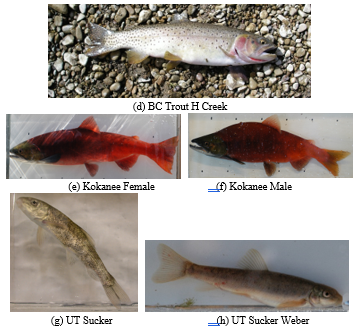
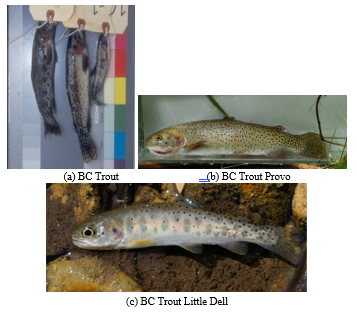
Figure 7: Examples of different fish in one class.
The test also revealed that double detection occurs frequently. One fish object was incorrectly identified as two different fish objects with a confidence level below 60% for the incorrect classi fication. It optimizes the accuracy level by increasing the threshold to 60%, enabling the final average detection accuracy level to reach 96.79% and the average confidence score for correct detection to reach 99.42%. As summarized in Table 4 and Figure 8, the lowest detection accuracy reached 92.86% for the BC Trout class, while the maximum detection accuracy reached 100% for the Kokanee and Steelhead classes. Fish structural deformities are responsible for detection failure. This issue was considered during the development of an algorithm utilizing the Fish-Pak dataset [33].
This work also evaluates the YOLOv4 algorithm model using the conventional “box squeezing object” labeling technique, which is most commonly applied to the same set of test data. With the conventional labeling technique, the final average accuracy is 90.09 % with a confidence score of 99.19 % at the 50% threshold, and the final average accuracy is 92.56 % with a confidence score of 99.19 % at the 60% threshold. At the 50% threshold, the accuracy is 4.59% lower than with the landmarking technique, and at the 60% threshold, it is 4.57% lower. The results of YOLOv4 detection using this conventional labeling technique are summarized in Tables 5 and 6, and Figure 9 depicts the confusion matrix.
Table 4: Experimental results of YOLOv4 with landmarking technique at the 60% threshold.
| Threshold: 60% | ||||||||
| Class | Testing data | Correct classification | Wrong classification | Not detect | Double classification | Total prediction | Accuracy (%) | Avg. Classification score (%) |
| BC Trout | 38 | 35 | 0 | 3 | 0 | 38 | 92.11 | 99.67 |
| Kokanee | 24 | 24 | 0 | 0 | 0 | 24 | 100.00 | 99.93 |
| UT Sucker | 35 | 33 | 1 | 0 | 1 | 35 | 94.29 | 99.24 |
| Steelhead | 20 | 20 | 0 | 0 | 0 | 20 | 100.00 | 99.83 |
| Total | 117 | – | – | – | – | – | – | – |
| Average | – | – | – | – | – | – | 96.60 | 99.67 |
Table 5: YOLOv4 detection results with conventional labeling techniques at the 50% threshold.
| Threshold: 50% | ||||||||
| Class | Testing data | Correct classification | Wrong classification | Not detect | Double classification | Total prediction | Accuracy (%) | Avg. Classification score (%) |
| BC Trout | 38 | 35 | 1 | 2 | 0 | 38 | 92.11 | 99.12 |
| Kokanee | 24 | 21 | 0 | 0 | 3 | 24 | 87.50 | 99.99 |
| UT Sucker | 35 | 27 | 0 | 0 | 8 | 35 | 77.14 | 99.96 |
| Steelhead | 20 | 20 | 0 | 0 | 0 | 20 | 100.00 | 99.87 |
| Total | 117 | – | – | – | – | – | – | – |
| Average | – | – | – | – | – | – | 89.19 | 99.74 |
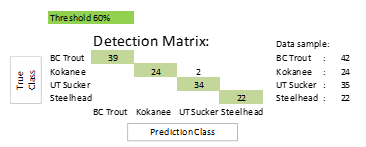
Figure 8: Confusion matrix for experiment result of YOLOv4 with landmarking technique at the 60% threshold.
Table 6: YOLOv4 detection results with conventional labeling techniques at the 60% threshold.
| Threshold: 60% | ||||||||
| Class | Testing data | Correct classification | Wrong classification | Not detect | Double classification | Total prediction | Accuracy (%) | Avg. Classification score (%) |
| BC Trout | 38 | 35 | 1 | 2 | 0 | 38 | 92.11 | 99.12 |
| Kokanee | 24 | 22 | 0 | 0 | 2 | 24 | 91.67 | 99.99 |
| UT Sucker | 35 | 29 | 0 | 0 | 6 | 35 | 82.86 | 99.96 |
| Steelhead | 20 | 20 | 0 | 0 | 0 | 20 | 100.00 | 99.87 |
| Total | 117 | – | – | – | – | – | – | – |
| Average | – | – | – | – | – | – | 91.66 | 99.74 |
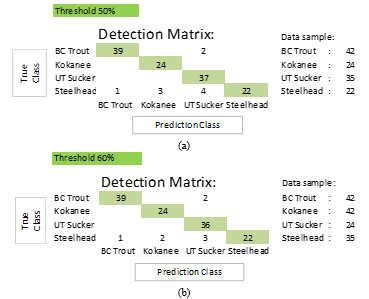
Figure 9: Confusion matrix for experiment result of YOLOv4 with conventional labeling technique(a) at the 50% threshold (b) at the 60% threshold.
4. Conclusion
The purpose of this paper is to propose a method for detecting fish in a variety of background conditions. Combining the landmarking technique with YOLO version 4 is the method. The proposed method was evaluated using the BYU dataset, which contained four different fish species. According to the experimental test results, the detection accuracy is 94.22% at a 50% threshold and 96.79 % at a 60% threshold. This result is greater than the 4.59% at the 50% threshold and 4.57% at the 60% threshold obtained using the conventional labeling method. The results of this trial are considered quite favorable, and the method used is straightforward. The proposed method does not require complicated work steps and is available for implementation.
In future research, it may be possible to automate the landmarking technique in fish using BLOB. Through the implementation of image processing techniques, it is possible to increase precision by adjusting the threshold value. The challenge that will be faced is the ability to detect and separate fish objects from their backgrounds, find the edges of fish objects, and export the coordinate points on the fish edges needed to define the required area.
Acknowledgments
This work was financially supported by King Mongkut’s Institute of Technology Ladkrabang, Contract no. 2562-02-01-004. The authors would also like to thank AMI-KMITL for granting the CiRA-Core software license.
- M. K. Alsmadi, I. Almarashdeh, “A survey on fish classification techniques,” Journal of King Saud University – Computer and Information Sciences, 34, 1625-1638, 2020, doi: https://doi.org/10.1016/j.jksuci.2020.07.005.
- S. Zhao, S. Zhang, J. Liu, H. Wang, J. Zhu, D. Li, R. Zhao, “Application of machine learning in intelligent fish aquaculture: A review, Aquaculture, 540, 1-19, 2021, doi:https://doi.org/10.1016/j.aquaculture.2021.736724.
- S. Villon, D. Mouillot, M. Chaumont, E.S. Darling, G. Subsol, T. Claverie, S. Villéger, “A deep learning method for accurate and fast identification of coral reef fishes in underwater images,” Ecological Informatics, 48, 238-244, 2018,doi: https://doi.org/10.1016/j.ecoinf.2018.09.007.
- A. B. Labao, P.C. Naval, “Cascaded deep network systems with linked ensemble components for underwater fish detection in the wild,” Ecological Informatics, 52, 103-121, 2019, doi:https://doi.org/10.1016/j.ecoinf.2019.05.004.
- A. Jalal, A. Salman, A. Mian, M. Shortis, F. Shafait, “Fish detection and species classification in underwater environments using deep learning with temporal information,” Ecological Informatics, 57, 1-13, 2020, doi:https://doi.org/10.1016/j.ecoinf.2020.101088.
- S. Villon, C. Iovan, M. Mangeas, T. Claverie, D. Mouillot, S. Villéger, L. Vigliola, “Automatic underwater fish species classification with limited data using few-shot learning,” Ecological Informatics, 63, 1-6, 2021, doi:https://doi.org/10.1016/j.ecoinf.2021.101320.
- Z. Ju, Y. Xue, “Fish species recognition using an improved alexnet model,” Optik, 223, 1-9, 2020, doi:https://doi.org/10.1016/j.ijleo.2020.165499.
- A. Salman, S. Maqbool, A.H. Khan, A. Jalal, F. Shafait, “Real-time fish detection in complex backgrounds using probabilistic background modelling,” Ecological Informatics, 51, 44-51, 2019, doi:https://doi.org/10.1016/j.ecoinf.2019.02.011
- N. F. F. Alshdaifat, A. Z. Talib, M. A. Osman, “Improved deep learning framework for fish segmentation in underwater videos, “Ecological Informatics, 59, 1-11, 2020, doi:https://doi.org/10.1016/j.ecoinf.2020.101121.
- A. B. Hollowed, M. Barange, R. J. Beamish, K. Brander, K. Cochrane, K. Drinkwater, M. G. G. Foreman , J. A. Hare, J. Holt, S. Ito, S. Kim, J. R. King, H. Loeng, B. R. MacKenzie, F. J. Mueter, T. A. Okey, M. A. Peck, V. I. Radchenko, J. C. Rice, M. J. Schirripa, A. Yatsu, Y. Yamanaka, “Projected impacts of climate change on marine fish and fisheries,” ICES Journal of Marine Science, 70, 1023–1037, 2013, doi:https://doi.org/10.1093/icesjms/fst081.
- N. S. Abinaya, D. Susan, R. K. Sidharthan, “Naive bayesian fusion based deep learning networks for multisegmented classification of fishes in aquaculture industries,” Ecological Informatics, 61, 1-13, 2021, doi:https://doi.org/10.1016/j.ecoinf.2021.101248.
- H. Qin, X. Li, J. Liang, Y. Peng, C. Zhang, “Deepfish: Accurate underwater live fish recognition with a deep architecture,” Neurocomputing, 187, 49-58, 2016, doi:https://doi.org/10.1016/j.neucom.2015.10.122.
- H. E. D. Mohamed, A. Fadl, O. Anas, Y. Wageeh, N. ElMasry, A. Nabil, A. Atia, “Msr-yolo: Method to enhance fish detection and tracking in fish farms,” in The 11th International Conference on Ambient Systems, Networks and Technologies (ANT), 539-546, 2020, doi:https://doi.org/10.1016/j.procs.2020.03.123.
- M. S. Ahmed, T.T. Aurpa, M.A.K. Azad, “Fish disease detection using image based machine learning technique in aquaculture, “Journal of King Saud University – Computer and Information Sciences, 34, 5170-5182, 2021, doi:https://doi.org/10.1016/j.jksuci.2021.05.003.
- A. A. D. Santos, W. N. Gonçalves, “Improving pantanal fish species recognition through taxonomic ranks in convolutional neural networks,” Ecological Informatics, 53, 1-11, 2019, doi:https://doi.org/10.1016/j.ecoinf.2019.100977.
- T. Miyazono, T. Saitoh, “Fish species recognition based on CNN using annotated image,” in IT Convergence and Security 2017, Lecture Notes in Electrical Engineering, 449, 156-163, 2018, doi:https://doi.org/10.1007/978-981-10-6451-7_19.
- B. S. Rekha, G. N. Srinivasan, S. K. Reddy, D. Kakwani, N. Bhattad, “Fish detection and classification using convolutional neural networks,” in International Conference On Computational Vision and Bio Inspired Computing, 1221-1231, 2019, doi:https://doi.org/10.1007/978-3-030-37218-7_128.
- A. Taheri-Garavand, A. Nasiri, A. Banan, Y.-D. Zhang, “Smart deep learning-based approach for non-destructive freshness diagnosis of common carp fish,” Journal of Food Engineering, 278, 1-9, 2020, doi:https://doi.org/10.1016/j.jfoodeng.2020.109930.
- K. Cai, X. Miao, W. Wang, H. Pang, Y. Liu, J. Song, “A modified yolov3 model for fish detection based on mobilenetv1 as backbone,” Aquacultural Engineering, 91, 1-9, 2020, doi:https://doi.org/10.1016/j.aquaeng.2020.102117.
- K. D. Lillywhite, D.J. Lee, Robotic vision lab, brigham young university, fish dataset, 2013, Available:http://roboticvision.groups.et.byu.net/Machine_Vision/BYUFish/BYU_Fish.html.
- Z. Liu, X. Jia, X. Xu, “Study of shrimp recognition methods using smart networks,” Computers and Electronics in Agriculture, 165, 1-10, 2019, doi:https://doi.org/10.1016/j.compag.2019.104926.
- J. Redmon, S. Divvala, R. Girshick, A. Farhadi, “You only look once: Unified, real-time object detection,” in 2016 IEEE Conference on Computer Vision and Pattern Recognition (CVPR), 779-788, 2016, doi:https://doi.org/10.48550/arXiv.1506.02640.
- A. Bochkovskiy, C. Y. Wang, H. Y.M. Liao, “Yolov4: Optimal speed and accuracy of object detection,” ArXiv:2004.10934, 1-17, 2020, doi:https://doi.org/10.48550/arXiv.2004.10934.
- C. Li, T. Zhen, Z. Li, “Image classification of pests with residual neural network based on transfer learning”, Appl. Sci., 12, 4356, 2022, doi:https://doi.org//10.3390/app12094356
- W. Li, L. Zhang, C. Wu, Z. Cui, C. Niu, “A new lightweight deep neural network for surface scratch detection”, Int. J. Adv. Manuf. Technol., 123, 1999–2015, 2022, doi:https://doi.org/10.1007/s00170-022-10335-8
- R. B. Fisher, Y. H. Chen-Burger, D. Giordano, L. Hardman, F. P. Lin, Fish4Knowledge: Collecting and Analyzing Massive Coral Reef Fish Video Data; Springer: Berlin/Heidelberg, Germany, 2016.
- S. A. Siddiqui, A. Salman, M. I. Malik, F. Shafait, A. Mian, M. R. Shortis, E. S. Harvey, “Automatic fish species classification in underwater videos: Exploiting pre-trained deep neural network models to compensate for limited labelled data”, ICES J. Mar. Sci., 75, 374–389, 2018, doi:https://doi.org/10.1093/icesjms/fsx109
- A. Salman, S. A. Siddiqui, F. Shafait, A. Mian, M. R. Shortis, K. Khurshid, A. Ulges, U. Schwanecke, “Automatic fish detection in underwater videos by a deep neural network-based hybrid motion learning system”, ICES J. Mar. Sci., 77, 1295–1307, 2020, doi:https://doi.org/10.1093/icesjms/fsz025
- S. Z. H. Shah, H. T. Rauf, M. Ikram Ullah, M. S. Khalid, M. Farooq, M. Fatima, S. A. C. Bukhari, “Fish-pak: Fish species dataset from Pakistan for visual features based classification”, Data in Brief, 27, 104565, 2019, doi:https://doi.org/10.1016/j.dib.2019.104565
- W. Xu, Z. Zhu, F. Ge, Z. Han, J. Li, “Analysis of behavior trajectory based on deep learning in ammonia environment for fish”, Sensors, 20, 4425, 2020, doi:https://doi.org/10.3390/s20164425
- N. D. Marom, L. Rokach, A. Shmilovici, “Using the confusion matrix for improving ensemble classifiers,” in 2010 IEEE 26-th Convention of Electrical and Electronics Engineers in Israel, 555-559, 2010, doi:https://doi.org/10.1109/EEEI.2010.5662159.
- D. H. T. Minh, D. Ienco, R. Gaetano, N. Lalande, E. Ndikumana, F. Osman, P. Maurel, “Deep recurrent neural networks for winter vegetation quality mapping via multitemporal sar sentinel-1,” IEEE Geoscience and Remote Sensing Letters, 15(3), 464-468, 2018, doi:https://doi.org/10.1109/LGRS.2018.2794581.
- A. Kuswantori, T. Suesut, W. Tangsrirat, N. Nunak, “Development of object detection and classification with YOLOv4 for similar and structural deformed fish,” EUREKA: Physics and Engineering, 2, 154-165, 2022, doi: 10.21303/2461-4262.2022.002345