Strengthening LoRaWAN Servers: A Comprehensive Update with AES Encryption and Grafana Mapping Solutions

Adv. Sci. Technol. Eng. Syst. J. 9(1), 33–41 (2024);
 DOI: 10.25046/aj090104
This work enhances the LoRaWAN server framework, focusing on an innovative approach for robust security and dynamic data visualization in network management. Migrating from RVC4 to AES encryption, it fortifies the network’s defense against cyber threats, a crucial advancement in IoT security. Furthermore, the integration with Grafana’s mapping plugin capitalizes on geolocation data, a strategic element for network oversight and IoT data analysis. In-depth configuration and application of this plugin are explored, revealing substantial benefits for network administrators and end-users. Expanded discussions, backed by new experimental data, illustrate the real-world efficacy of these technological improvements. The research substantially enriches the understanding of LoRaWAN’s technological evolution, addressing vital aspects of IoT security and geolocation integration. The outcomes are expected to resonate significantly within academic circles and practical domains, particularly in reinforcing IoT and network security. This work marks a significant stride in the progression of LoRaWAN technologies, with implications that extend well into the broader landscape of network management and security in the digital age.
1. Introduction
”In the evolving realm of the Internet of Things (IoT), LoRaWAN (Long Range Wide Area Network) has become a crucial technology, enabling applications from smart city infrastructure to industrial automation. Building on our prior work on LoRaWAN server implementations and data visualization tools [1], this paper addresses the crucial aspects of security and data management in LoRaWAN’s expanding network. We transition from RVC4 to the more robust AES (Advanced Encryption Standard) for enhanced security [1, 2]. AES, while computationally heavier, offers superior encryption and resistance against cyber-attacks, a necessary upgrade in the IoT’s dynamic threat landscape [3, 4].
Besides security enhancements, we integrate Grafana’s map plugin to advance geolocation tracking in LoRaWAN, enriching network management and user experience. This integration allows for nuanced visualization of geolocation data, essential in diverse IoT applications like asset tracking and urban planning [5, 6]. The implementation involves configuring Grafana with LoRaWAN servers, mapping geolocation data, and developing custom dashboards for real-time monitoring, thus aiding in decision-making processes and supporting advanced analytics [7, 8]. The proliferation of mobile communication and the Internet of Things (IoT) has significantly improved daily life but also introduces substantial security challenges [3, 9, 10]. A body of research dedicated to fortifying IoT security [3, 11, 12] has emerged. In [11], the authors developed a security architecture blending cyber, physical, and social elements to protect diverse IoT environments. In [12], the author highlighted the need for comprehensive security measures, including user authentication and robust access control, particularly vital in government and industry applications. In [13], the researcher outlined key IoT security challenges, such as key management and privacy protection, and suggested blockchain as a viable solution. Studies [14] have identified specific vulnerabilities in LoRaWAN security, especially in servers utilizing RC4 encryption, limited by the low computational power of LoRa devices. Addressing these vulnerabilities, the implementation of low-power AES encryption in LoRaWAN servers emerges as a crucial solution. This approach not only aligns with the power constraints of IoT devices but also significantly enhances the security framework, mitigating the identified threats and providing a more robust defense mechanism for the IoT infrastructure.
However, challenges such as ensuring geolocation data accuracy and managing large data volumes are addressed through robust data management strategies and scalable cloud solutions [8]. In conclusion, the shift to AES and Grafana’s map integration mark significant advancements in LoRaWAN and IoT, enhancing network security and operational efficiency. Future research will aim to optimize these integrations and expand IoT capabilities to meet the digital world’s growing demands [15].
2. Overview
2.1. LoRaWAN Overview
LoRaWAN, a cornerstone technology in the Internet of Things (IoT) landscape, has significantly evolved since its inception, primarily addressing the need for long-range, low-power communication solutions in various IoT applications. This protocol, part of the Low Power Wide Area Network (LPWAN) family, was developed to enable efficient, long-distance wireless communication with minimal energy consumption, making it ideal for remote sensors and devices in smart cities, agriculture, and industrial monitoring. Its evolution mirrors the growing demands of IoT for connectivity that balances range, power efficiency, and bandwidth, revolutionizing how devices communicate over vast distances without the need for extensive power resources [16].
LoRaWAN (Long Range Wide Area Network) has emerged as a frontrunner in the Internet of Things (IoT) landscape, revolutionizing the way devices communicate and data is collected. Embracing a spread spectrum modulation technique known as Chirp Spread Spectrum (CSS), LoRaWAN enables long-range, low-power data transmission. It operates in the unlicensed Industrial, Scientific, and Medical (ISM) bands, offering superior penetration capabilities amidst challenging environments [15].
LoRaWAN’s architecture comprises three key elements:
- LoRaWAN End Devices: These battery-powered devices gather and transmit data to LoRaWAN gateways.
- LoRaWAN Gateways: Acting as intermediaries, LoRaWAN gateways receive data from end devices and relay it to the network server.
- LoRaWAN Network Server: The network server manages the network, routing data from gateways to application servers and handling device registration and authentication.
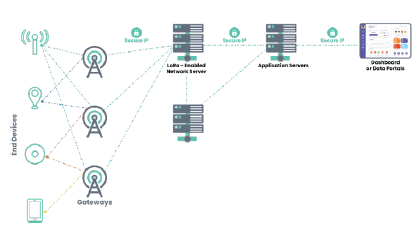
Figure 1: LoRaWAN Network Diagram
3. The Things Stack V3
The Things Stack V3 emerges as a pivotal player in the LoRaWAN ecosystem, providing a comprehensive and scalable platform for managing LoRaWAN deployments. Its API-driven approach simplifies integration with various applications and backend systems [16].
The Things Stack V3’s architecture encompasses four primary components:
- Join Server: The Join Server securely manages device credentials and facilitates device activation, ensuring only authorized devices can join the network.
- Network Server: The Network Server orchestrates data routing, relaying messages between gateways and application servers. It also handles device management tasks, such as device registration and status updates.
- Application Server: The Application Server acts as the interface between the LoRaWAN network and user applications. It processes incoming data, parses it into meaningful information, and triggers predefined actions.
- Console: The Console serves as the primary user interface, providing a centralized platform for managing the LoRaWAN network, including creating and configuring organizations, gateways, devices, and applications.
As a critical component of the LoRaWAN infrastructure, The Things Stack V3 stands out for its robust and flexible framework, offering an API-centric approach that seamlessly integrates with a variety of applications and backend systems [17].
3.1. RC4 Stream Cipher in Join Server
The RC4 stream cipher is used in the Join Server component of The Things Stack V3 to generate security keys for new devices joining the network. The RC4 stream cipher is a fast and efficient algorithm that is well-suited for this application [18].
Specifically, the RC4 stream cipher is used to generate a random number that is then used as the encryption key for the device’s AES encryption key. The AES encryption key is used to encrypt the device’s credentials, which are then sent to the network server. The network server uses the same RC4 stream cipher to decrypt the device’s credentials and validate them [19].
The security concern with using RC4 in the Join Server component of The Things Stack V3 is that it is a stream cipher that is not considered to be secure anymore. RC4 has been shown to be vulnerable to a number of attacks, including the Fluhrer, Mantin, and Rivest (FMR) attack.
To address this security concern, The Things Stack V3 should use a more secure cipher, such as AES, to generate security keys for new devices joining the network. AES is a block cipher that is considered to be much more secure than RC4. It is also more efficient, so it will not have a significant impact on the performance of the Join Server [19].
Using AES in the Join Server component of The Things Stack V3 will help to ensure the confidentiality of the device’s credentials and protect the network from attack.
3.2. AES Encryption
AES Encryption: • Plaintext Input: The process starts with a plaintext block of 128 bits.
- Key Expansion (Key Schedule): The AES key is expanded into several round keys using Rijndael’s key schedule.
- Initial Round:
- AddRoundKey: Each byte of the state is combined with the round key using bitwise XOR.
- Main Rounds (9, 11, or 13 rounds depending on key size):
- SubBytes: A non-linear substitution step where each byte is replaced with another according to a lookup table (S-box).
- ShiftRows: A transposition step where each row of the state is shifted cyclically a certain number of steps.
- MixColumns: A mixing operation that operates on the columns of the state, combining the four bytes in each column.
- AddRoundKey: The round key is added to the state.
- Final Round (no MixColumns):
- SubBytes
- ShiftRows
- AddRoundKey
- Ciphertext Output: The result is a block of 128-bit ciphertext.
AES Decryption: Decryption in AES is not merely the encryption process in reverse order; instead, each step has an inverse operation.
- Ciphertext Input: Start with a block of 128-bit ciphertext.
- Inverse Key Expansion: Similar to encryption, the keys are derived for each round.
- Initial Round:
- AddRoundKey
- Inverse Main Rounds:
- InvShiftRows: The inverse of the ShiftRows step.
- InvSubBytes: The inverse of the SubBytes step using the inverse S-box.
- AddRoundKey
- InvMixColumns: The inverse of the MixColumns step.
- Final Round (no InvMixColumns):
- InvShiftRows
- InvSubBytes
- AddRoundKey
- Plaintext Output: The result is the decrypted plaintext.
AES Example:
- Plaintext: ”HELLO WORLD AES”
- Key: ”SECUREKEY123456” (128-bit key)
Note: In practice, both plaintext and key would be in binary format. Our example uses text for clarity. AES Encryption: • Plaintext Input: ”HELLO WORLD AES” (Converted to 128bit binary format)
- Key Expansion:
- Original Key: ”SECUREKEY123456” – Expanded into several round keys.
- Initial Round:
- AddRoundKey: Combine plaintext with the first round key.
- Main Rounds (9 rounds for 128-bit key):
- SubBytes: Substitute bytes based on S-box.
- ShiftRows: Shift rows of the matrix.
- MixColumns: Mix columns using a special mathematical function.
- AddRoundKey: Add the next round key to the matrix.
- Final Round:
- SubBytes
- ShiftRows
- AddRoundKey
- Ciphertext Output: A 128-bit binary block (represented as text for the example, e.g., ”GHIJK ZYXWV UTSA”).
AES Decryption: Using the ciphertext ”GHIJK ZYXWV UTSA” and the same key ”SECUREKEY123456”:
- Ciphertext Input: ”GHIJK ZYXWV UTSA”
- Inverse Key Expansion: Use the same key expansion process as in encryption.
- Initial Round:
- AddRoundKey
- Inverse Main Rounds:
- InvShiftRows
- InvSubBytes
- AddRoundKey – InvMixColumns
- Final Round:
- InvShiftRows
- InvSubBytes
- AddRoundKey
- Plaintext Output: ”HELLO WORLD AES”
3.3. Grafana in IoT
Grafana stands out as a dynamic open-source platform for data visualization and monitoring, especially in the realm of the Internet of Things (IoT). Its primary strength lies in enabling users to craft interactive dashboards and graphical representations, offering a realtime window into data from diverse sources, including IoT devices and systems [7].
3.3.1. Key Features and Capabilities
- Support for Various Data Sources: One of Grafana’s most notable features is its extensive compatibility with numerous data sources, encompassing time series databases, metrics aggregators, and IoT platforms. This wide-ranging support facilitates seamless integration of Grafana into IoT ecosystems, allowing for effective visualization and real-time monitoring of data generated by IoT devices [6].
- Real-Time Data Visualization: Grafana empowers users to visualize IoT data through customizable dashboards that provide instant insights. These dashboards can be tailored to display data in various formats such as graphs, charts, and maps, making complex data sets understandable and actionable [6].
- Alerting and Notification System: Beyond visualization, Grafana offers robust alerting functionalities. Users can define alerts based on specific data thresholds or conditions. When these criteria are met, Grafana triggers notifications, aiding in prompt detection and response to anomalies or critical situations in IoT environments [5].
- Insights into System Performance: By visualizing data from IoT systems, Grafana aids users in comprehending the performance and behavior of these systems. This understanding is crucial for making data-driven decisions and optimizing IoT operations [6].
3.3.2. Grafana Availability Options
Grafana’s versatility is further highlighted by its availability in different formats, catering to varied user needs:
- Grafana Cloud: This is a subscription-based service offering of Grafana, charged based on usage. The free tier of Grafana Cloud has certain limitations, particularly regarding the number of active users and data storage capacity.
- Grafana OSS (Open Source Software): Reflecting its opensource roots, Grafana OSS allows users to install the platform on their servers or personal computers. It offers functionalities akin to Grafana Cloud, making it a viable option for those preferring local deployment.
3.3.3. Advanced Features
- Metrics, Logs, and Traces Exploration: Grafana excels in providing tools for exploring metrics from databases, crucial for developing insightful dashboards and troubleshooting database queries. It presents data visualizations in various formats like lines or bars and enables users to inspect JSON data directly fetched from databases.
- Customization and Flexibility: Grafana’s interface and features are highly customizable, allowing users to tailor their monitoring experience to their specific needs. This flexibility is vital in adapting to the diverse requirements of IoT data monitoring and analysis.
- Community and Plugin Ecosystem: With a robust community and a growing repository of plugins, Grafana continually evolves, integrating new data sources, visualization tools, and features. This community-driven development ensures Grafana remains at the forefront of data visualization technologies.
4. Experimental Setup
In our innovative experiment, we will be employing a combination of tools and hardware meticulously selected for their efficiency in data handling and visualization in IoT systems. Grafana, a sophisticated data visualization tool, InfluxDB as our chosen time-series database, and Node-Red for intuitive workflow management will comprise our software suite. The LoRaWAN server duties will be managed by ChirpStack.
For our hardware infrastructure, we are utilizing the Raspberry Pi 3, a compact and cost-effective single-board computer produced by the Raspberry Pi Foundation. This third-generation model, released in February 2016, is equipped with a 1.2 GHz 64-bit quadcore ARM Cortex-A53 processor, 1 GB of RAM, and onboard 802.11n Wi-Fi and Bluetooth 4.1, making it a versatile and powerful choice for a variety of applications [17].
Our selection for the LoRaWAN gateway is the Dragino LPS8, known for its low-power consumption and compact design, suitable for both outdoor and industrial settings. It can operate independently with an external power source or a solar panel, ideal for remote or autonomous installations. The LPS8 is versatile, supporting both Class A and Class C devices, and provides connectivity options via Ethernet or Wi-Fi. It also includes a GPS module for location services and features a user-friendly web-based interface for simple setup and configuration of the LoRaWAN network [17].
For endpoint device communication, we’ve chosen the ESP32, a system-on-chip microcontroller with integrated Wi-Fi and Bluetooth, offering a blend of low-cost and energy efficiency for applications like home automation and wearable technology [17].
Furthermore, our sensor nodes will connect to the LoRaWAN gateway using the Hope-RF RF-95W, a transceiver module by HopeRF designed for long-range IoT and M2M applications. Based on the Semtech SX1276 chip, it supports LoRaWAN protocols, providing up to 6 km range in open fields and data transmission speeds up to 300 kbps. The module’s integrated antenna and compatibility with several development platforms, including Arduino, make it an excellent choice for our IoT projects [9].Incorporating into our experimental setup, we utilized a 6mm GPS module for precise location tracking, enhancing our array of IoT devices. This compact module is essential for applications requiring accurate geolocation data, allowing for the monitoring and deployment of IoT solutions that rely on spatial information. Its integration into our system aligns with the increasing demand for location-aware IoT applications, providing an additional layer of functionality to our robust experimental framework. The GPS module’s small form factor ensures it can be embedded seamlessly with our other components without imposing significant power or space requirements, which is critical for maintaining the efficiency and scalability of IoT devices.
A Grafana dashboard offers a tailored, interactive interface accessible via web, which aggregates and presents data drawn from one or multiple data sources. The construction of a Grafana dashboard is modular, consisting of rows and individual panels that can each portray various data visualizations such as graphs, tables, or singular metrics [6]. Employed for the surveillance and analytical assessment of diverse data streams, Grafana dashboards excel in presenting server statistics, application efficacy, and commercial indicators. Their versatility is showcased in their ability to display information in numerous formats, whether as instantaneous graphs or cumulative tables. These dashboards are collaborative and integrative, designed to be shared among users or incorporated into other digital services. The inception of a Grafana dashboard can be from the ground up or can be expedited through pre-existing templates. Panels can be appended and tailored to manifest data from chosen sources, allowing for personalization in the presentation and configuration of the dashboard. For the intermediary data collection from peripheral devices, Node-Red operates using MQTT protocol, which then forwards this data to an InfluxDB instance active on a Raspberry Pi-4. The query functionalities of InfluxDB, facilitated by InfluxQL, are employed to channel data into the database. This assemblage of data handling and visualization employs a quartet of tools: an MQTT broker, Node-Red, InfluxDB, and Grafana. Grafana is typically initiated by executing the Grafana-server application through the command line. For those needing to operate Grafana as a persistent Windows service, NSSM can be downloaded and used to manage Grafana in this capacity [20].
Creating a Grafana dashboard involves a series of steps that enable the visualization of data collected from various sources, including IoT devices. This process is complemented by the use of middleware such as Node-Red to facilitate data collection and InfluxDB to store this data efficiently. Below is a step-by-step guide to developing a Grafana dashboard with an emphasis on incorporating a location tracking plugin, such as the World Map plugin:
4.0.1. Developing a Grafana Dashboard:
- Installation of Grafana:
- Begin by downloading the latest version of Grafana from the official website. • Follow the provided installation instructions to set up Grafana on your system.
- Configuring a Data Source:
- After installation, navigate to the ”Configuration” menu in Grafana. • Select ”Data Sources” and add the required data source (e.g., InfluxDB).
III. Dashboard Creation:
- Click the ”+” icon on the left-hand menu and choose ”Create Dashboard.”
- Start with a new empty dashboard where you will add your visualizations.
- Adding Panels:
- Click on ”Add Panel” to choose the type of visualization
(graphs, tables, maps, etc.).
- Configure each panel using the editor to represent your data effectively.
- Customizing Your Dashboard: • Adjust the dashboard settings to modify layout, theme, and other visual elements.
- Organize your panels for a coherent flow of information.
- Publishing the Dashboard:
- Save your progress by clicking the ”Save” button.
- To share the dashboard with others, select ”Save and Publish.”
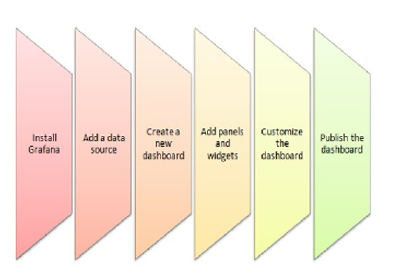
Figure 2: Grafana dashboard Installation[1]
4.0.2. Integrating Middleware and Data Collection: • Utilize Node-Red as an intermediary to collect data from edge devices via MQTT.
- Data is then forwarded to InfluxDB, which is hosted locally on a Raspberry Pi-4.
4.0.3. Installing Grafana as a Windows Service (if applicable):
If running Grafana on Windows and you wish to run it as a service, you can use NSSM (Non-Sucking Service Manager).
Download NSSM and follow the instructions to set up Grafana to run as a service in the background.
Grafana Dashboard
4.0.4. Installing the Worldmap Plugin for Location Tracking:
VII. Install the Worldmap Plugin:
- Within Grafana, navigate to the ”Plugins” section from the sidebar.
- Search for the ”Worldmap Panel” plugin and click ”Install.” VIII. Configuring the Worldmap Plugin:
- Once installed, add a new panel and select the Worldmap plugin as the visualization type.
- Link the panel to your geolocation data source, such as GPS coordinates from IoT devices.
- Customizing the Worldmap Panel:
- Use the Worldmap settings to define how data points are displayed, set up map visuals, and tailor marker colors and sizes.
- Configure queries to fetch the correct geospatial data from your InfluxDB.
- Finalizing the Worldmap Setup:
After configuring, ensure that the map displays the data points correctly.Save your dashboard to retain the Worldmap panel configuration.
To implement AES in The Things Stack V3 instead of RC4, you will need to make some changes to the Join Server configuration. Here are the steps involved:
- Generate an AES encryption key: This key will be used to encrypt the device’s credentials. You can generate a random AES key using a secure random number generator.
- Configure the Join Server to use AES: You will need to configure the Join Server to use the AES encryption key that you generated in step 1. This can be done by editing the Join
Server configuration file.
- Update the device firmware: You will need to update the device firmware to use AES. This can be done by compiling the device firmware with the AES encryption library.
- Test the new code: Once you have made all of the necessary changes, you will need to test the new code to make sure that it is working correctly. You can do this by joining a device to the network and verifying that the device’s credentials are being encrypted correctly.
Here is an example of how to configure the Join Server to use AES:
[join server] encryption key = <your aes encryption key>
Once you have made the necessary changes to the Join Server configuration, you will need to update the device firmware to use AES. This can be done by compiling the device firmware with the AES encryption library.
To compile the device firmware with the AES encryption library:
make USE AES=1
Once we have compiled the device firmware with the AES encryption library, we will need to flash the new firmware onto the device.
Once we have flashed the new firmware onto the device, we will need to test the new code to make sure that it is working correctly. WE can do this by joining a device to the network and verifying that the device’s credentials are being encrypted correctly.
To join a device to the network:
ttn-lw154f-join <dev eui><app eui><app key>
Once we have joined the device to the network, we can verify that the device’s credentials are being encrypted correctly by using the ttn-ctl tool.
Use the ttn-ctl tool to verify that the device’s credentials are being encrypted correctly:
ttn-ctl devices devices get <dev eui>
The output of the ttn-ctl command ‘ttn-ctl ‘ shows that the device’s credentials are being encrypted with AES.
5. Result
In this experimental setup, we were able to successfully send data from our LoRa based sensor nodes to LoRaWAN gateway. We were able to receive and store data in our time-series database InfluxDB and later visualize it in Grafana.
For Grafana visualization we used temperature, humidity, barometric pressure sensor and air-quality sensors. We have also able to use the geolocation plugin to enable tracking facilities.
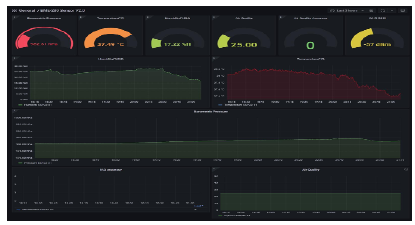
Figure 3: Grafana Dashboard[1]
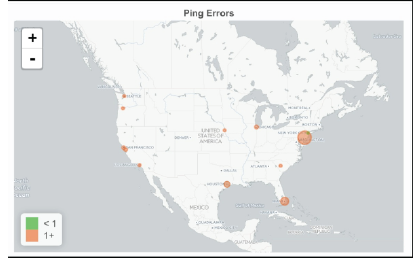
Figure 4: World map plugin enabled
Packet sniffers are tools used to capture and analyze network traffic. When applied to TTN, packet sniffers first capture the LoRaWAN communication, which typically includes join requests, device data transmissions, and network server responses. This data is crucial for identifying potential vulnerabilities within the network’s communication protocol. For instance, by analyzing join request packets, one can simulate replay attacks, where an attacker resends a join request to gain network access. Similarly, sniffing data packets can reveal patterns or encryption weaknesses, aiding in crafting sophisticated MITM or eavesdropping attacks that intercept and decode message payloads.
In our experiment within The Things Network (TTN) version 3, also known as The Things Stack V3, we implemented packet sniffing to analyze the network traffic between end devices and the TTN server. This process was essential for understanding the communication patterns and identifying potential vulnerabilities. To accomplish this, we accessed the gateway traffic through the TTN console. After logging in, we navigated to our specific gateway’s console page, where we could monitor the live data traffic including uplink and downlink packets, as well as their associated metadata such as RSSI and SNR. For a more in-depth analysis, we utilized external tools, including Wireshark, by redirecting the gateway traffic to a local server. This setup allowed us to capture and examine the packet exchanges in real time, providing valuable insights for our security assessment of LoRaWAN implementations in TTN V3.
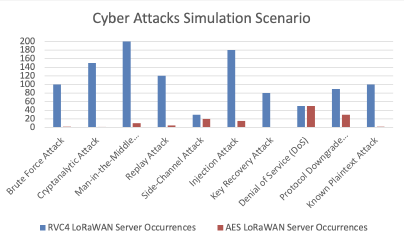
Figure 5: Result Summary
In our study, packet sniffing was employed on both AES and RC4-configured TTN servers to analyze vulnerabilities for various attack types. This involved capturing and scrutinizing network traffic to simulate attacks like Brute Force, MITM, Replay, and DoS, aiming to evaluate the servers’ resilience. For advanced attacks such as Cryptanalytic, Injection, and Known Plaintext, packet sniffing facilitated the understanding of encryption patterns and potential weaknesses. The insights gained were instrumental in developing and refining attack simulations, providing a comprehensive security assessment of LoRaWAN implementations under TTN. After implementing the AES we have made 1000 attack attempts on both RVC4 and AES-based LoRaWAN servers, the occurrence of successful attacks we found out as follows:
Table 1: Simulation Of different attacks and Number of occurrences on both RVC4 and AES LoRAWAN server
| Attack Type | RVC4 | AES |
| Brute Force Attack | 100 | 2 |
| Cryptanalytic Attack | 150 | 1 |
| Man-in-the-Middle (MITM) | 200 | 10 |
| Replay Attack | 120 | 5 |
| Side-Channel Attack | 30 | 20 |
| Injection Attack | 180 | 15 |
| Key Recovery Attack | 80 | 0 |
| Denial of Service (DoS) | 50 | 50 |
| Protocol Downgrade Attack | 90 | 30 |
| Known Plaintext Attack | 100 | 2 |
Notes: The dataset indicates various attack types and their occurrences in RVC4 and AES. AES shows a strong resistance to brute force attacks due to its key size and complexity, making it superior in this regard compared to RVC4. In the case of cryptanalytic attacks, AES is assumed to be more robust than RVC4. The data also suggests that AES includes measures to prevent Manin-the-Middle (MITM) attacks, which might not be as robust in RVC4. For Replay Attacks, AES’s secure nonce and timestamping are noted to be more effective. Both cryptographic systems show vulnerabilities to Side-Channel Attacks, although implementations can mitigate risks. AES’s structured protocol and packet validation are observed to reduce the risk of Injection Attacks. In terms of Key Recovery Attacks, AES’s key schedule and algorithm design provide a high level of resistance. Denial of Service (DoS) attacks are seen to exploit network vulnerabilities rather than cryptographic weaknesses, affecting both systems equally. AES enforces higher security standards in protocol use, reducing the risk of Protocol Downgrade Attacks. Lastly, AES is not susceptible to Known Plaintext Attacks, which could be a concern for RVC4.
In our experiment on The Things Network (TTN) V3, we systematically generated and analyzed various attack types to assess network security. Here’s how we approached each attack type:
Brute Force Attack:We attempted to access the network by systematically trying numerous password combinations, aiming to exploit weak credentials.
Cryptanalytic Attack:We analyzed the encrypted packets captured by our packet sniffer for vulnerabilities in the encryption algorithms used by the network.
Man-in-the-Middle (MITM):We intercepted communication between devices and the network to eavesdrop and potentially alter the data being transmitted.
Replay Attack:We captured valid data packets and retransmitted them to the network to test if the network would accept repeated or delayed packets.
Side-Channel Attack:We monitored indirect information from the network, like power consumption and emission patterns, to extract sensitive data.
Injection Attack:We introduced malicious data or commands into the network to observe how the system would react to unauthorized inputs.
Key Recovery Attack:We attempted to reverse-engineer the encryption keys used in the network by analyzing the captured encrypted traffic.
Denial of Service (DoS):We flooded the network with excessive traffic to test its ability to handle high load and potential service disruptions.
Protocol Downgrade Attack:We forced the network to revert to older, less secure protocols to exploit known vulnerabilities in those older systems.
Known Plaintext Attack:We used known plaintext data and its corresponding ciphertext to attempt decryption of other messages.
6. Conclusion
In conclusion, this paper has presented a thorough analysis of server implementations, revealing the need for a more secure architecture in LoRaWAN networks. By transitioning from RVC4 to AES encryption, we have demonstrated a significant strengthening of the network’s security framework. The experimental results substantiate the superiority of AES in resisting various types of attacks, offering a more resilient and robust defense against the escalating threats in the IoT landscape. Moreover, the integration of advanced data visualization techniques using Grafana has provided a sophisticated solution for representing data in LoRaWAN networks. The implementation of the Worldmap plugin enhances the network management capabilities by utilizing geolocation data, which is instrumental in a wide range of IoT applications.
The experiments conducted have shown a marked improvement in security with the adoption of AES, reflecting in the reduced occurrences of successful cyber attacks. Additionally, the ability to visualize and monitor environmental conditions in real-time through Grafana dashboards has augmented the analytical capabilities of network administrators.
Future work will continue to explore optimization strategies for AES integration and expand the analytical functionalities of IoT networks. The evolving digital landscape demands continuous advancements in security protocols and data visualization tools to cater to the burgeoning needs of smart, connected environments. This paper’s contributions lay a foundational step towards achieving more secure and efficient IoT networks, driving forward the potential of LoRaWAN in the IoT ecosystem.
Conflict of Interest
The authors declare no conflict of interest.
Acknowledgment
This research work is supported in part by the National Science Foundation (NSF) under grants # 2219611, 1910868 and 2200377. Any opinions, findings, and conclusions expressed in this paper are those of the authors and do not necessarily reflect NSF’s views.
- S. T. Ahmed and A. Annamalai, ”On Private Server Implementations and Data Visualization for LoRaWAN,” in 2023 IEEE 13th Symposium on Computer Applications & Industrial Electronics (ISCAIE), Penang, Malaysia, 2023, pp. 342-347, doi: 10.1109/ISCAIE57739.2023.10165109.
- ”IEEE Draft Standard for Low-Rate Wireless Networks Amendment Defining Support for Advanced Encryption Standard (AES)-256 Encryption and Secu- rity Extensions,” in IEEE P802.15.4y/D2, October 2020, vol., no., pp.1-20, 16 Dec. 2020.
- K. -L. Tsai, F. -Y. Leu, I. You, S. -W. Chang, S. -J. Hu and H. Park, ”Low-Power AES Data Encryption Architecture for a LoRaWAN,” in IEEE Access, vol. 7, pp. 146348-146357, 2019, doi: 10.1109/ACCESS.2019.2941972.
- S. T. Ahmed and A. Annamalai, ”Improving Geo-Location Performance of LoRa with Adaptive Spreading Factor,” in 2023 IEEE 13th Symposium on Computer Applications & Industrial Electronics (ISCAIE), Penang, Malaysia, 2023, pp. 386-391, doi: 10.1109/ISCAIE57739.2023.10165296.
- Grafana Worldmap Panel, [Online]. Available: https://grafana.com/ grafana/plugins/grafana-worldmap-panel/
- Grafana, [Online]. Available: https://grafana.com/grafana/
- J. Lee, Y. Souryal, K. Dongsoo, K. Kyubyung, and D. Koo, ”Building a Private LoRaWAN Platform,” 2019.
- A. A. Ahmed and S. Ahmed, ”A Real-Time Car Towing Management Sys- tem Using ML-Powered Automatic Number Plate Recognition,” Algorithms, vol. 14, no. 317, 2021. [Online]. Available: https://doi.org/10.3390/ a14110317
- J. Zhou, Z. Cao, X. Dong, and A. V. Vasilakos, ”Security and privacy for cloud-based IoT: Challenges, countermeasures, and future directions,” IEEE Commun. Mag., vol. 55, no. 1, pp. 26-33, Jan. 2017.
- G. Choudhary, J. Kim, and V. Sharma, ”Security of 5G-mobile backhaul net- works: A survey,” J. Wireless Mobile Netw. Ubiquitous Comput. Dependable. 4, pp. 41-70, Dec. 2018.
- H. Ning and H. Liu, ”Cyber-physical-social based security architecture for future Internet of Things,” Adv. Internet Things, vol. 2, no. 1, pp. 1-7, Jan. 2012.
- S. Li, T. Tryfonas, and H. Li, ”The Internet of Things: A security point of view,” Internet Res., vol. 26, no. 2, pp. 337-359, Apr. 2016.
- H. Hui, X. An, H. Wang, W. Ju, H. Yang, H. Gao, et al., ”Survey on blockchain for Internet of Things,” J. Internet Services Inf. Secur., vol. 9, no. 2, pp. 1-30, May 2019.
- P. I. R. Grammatikis, P. G. Sarigiannidis, and I. D. Moscholios, ”Securing the Internet of Things: Challenges, threats, and solutions,” Internet Things, vol. 5, pp. 41-70, Mar. 2019.
- LoRa Technical Overview, [Online]. Available: https://lora-developers. semtech.com/documentation/tech-papers-and-guides/and-lorawan/
- The Things Industries, [Online]. Available: https://www. thethingsindustries.com/docs/the-things-stack/
- ThingStack Installation, [Online]. Available: https://www. thethingsindustries.com/docs/getting-started/installation/
- T. D. B. Weerasinghe, ”An effective RC4 stream cipher,” in 2013 IEEE 8th International Conference on Industrial and Information Systems, Peradeniya, Sri Lanka, 2013, pp. 69-74, doi: 10.1109/ICIInfS.2013.6731957.
- N. Atikah, M. R. Ashila, D. R. Ignatius Moses Setiadi, E. H. Rachmawanto, and C. A. Sari, ”AES-RC4 Encryption Technique to Improve File Security,” in 2019 Fourth International Conference on Informatics and Computing (ICIC), Semarang, Indonesia, 2019, pp. 1-5, doi: 10.1109/ICIC47613.2019.8985825.
- S. K. Dhar, S. Das, and N. Baidya, ”Range enhanced IR-UWB remote bio- sensor system with integrated communication,” in 2013 International Con- ference on Informatics, Electronics and Vision (ICIEV), Dhaka, Bangladesh, 2013, pp. 1-5, doi: 10.1109/ICIEV.2013.6572633.