Discovering Interesting Biological Patterns in the Context of Human Protein-Protein Interaction Network and Gene Disease Profile Data

Adv. Sci. Technol. Eng. Syst. J. 2(6), 87–93 (2017);
 DOI: 10.25046/aj020611
The current advances in proteomic and transcriptomic technologies produced huge amounts of high-throughput data that spans multiple biological processes and characteristics in different organisms. One of the important directions in today’s bioinformatics research is to discover patterns of genes that have interesting properties. These groups of genes can be referred to as functional modules. Detecting functional modules can be accomplished by the deep analysis of protein-protein interaction (PPI) networks, gene expression profiles, or both. In this work the focus will be on Human protein-protein interaction network and genes expression data that represents genes behavior in a group of diseases. Two of the most well-established clustering methods that target the interaction networks and the expression data will be used in this analysis. In addition, and to have more insights, genes molecular functionality will be studied. Finally, I will introduce the relation of the extracted modules on biological pathways. This study mainly illustrates the importance of including protein interaction activities as part of any study that aims at discovering meaningful knowledge about the biological scene where many actors play different roles.
1. Introduction
The current advances in proteomic and transcriptomic technologies produced huge amounts of high-throughput data that spans multiple biological processes and characteristics in different organisms. One of the important directions in today’s bioinformatics research is to discover patterns of genes or genes products that have interesting characteristics that can be related to specific activities or functions inside the living organism. Researchers believe that those groups of genes are can give deeper insights of what is happening inside a living cell than studying individual genes in isolation. These groups of genes are called functional modules (patterns). Different approaches can be employed to discovering functional modules. One of the most important approaches is to focus on protein-protein interaction (PPI) networks and try to find well connected sub-networks. Another approach is to consider gene expression data and try to find modules that show similar behavior according to their expression levels by calculating correlations. The last approach is to integrate both the PPI and the expression data in a complementary effort because both PPI and expression data suffer from incompleteness and inconsistency problems [1].
However, for the expression profiles that are related to diseases in specific, most of the available data is in the form of genome-wide expression profiles that extracted from microarray measurements. A number of methods have been proposed to clarify the biological mechanisms from this expression data [2,3]. Most of those methods are based on individual genes ability to be used as a strong indication of the disease under consideration. However, considering only individual genes will give limited insights about the molecular mechanisms and biology of an organism under different disease conditions. On the other hand, studying groups of genes that show specific behavior related to some disease will help in grasping more comprehensive views about the disease itself and what molecular functionality those genes may have and can be involved in this disease. The reason for that is the fact that any biological process, such as a disease, occurring inside the living organism is affected and affects multiple and different biological components and pathways of that organism. Patterns of genes, or functional modules, can be discovered in different ways. One approach is by applying clustering techniques on PPI networks to find patterns of well-connected genes. One of the most established methods used in this field is the stochastic flow-based clustering (Markov Cluster Algorithm, MCL) [4, 5]. The Markov cluster algorithm (MCL) uses a graph’s natural transition probability matrix to cluster a graph by combining random walks with two alternating operations (expansion and inflation). With these operations, the algorithm iteratively simulates the dissipation and elimination of stochastic flow across the graph structure to produce a non-negative matrix representation of a graph clustering. In other words, the nodes of the graph are clustered with each other based on the strength of connections between these nodes. The MCL method has been shown to be significantly robust and superior to other network-based methods when used to cluster benchmarking biological networks [6].
Another approach is to use gene expression profiles to cluster genes that show similar behavior based on their expression levels that are extracted from microarray measurements. In this case, any clustering method can be used like K-means [7]. K-means and its variations are among the most popular iterative methods used for clustering data and can be easily applied to biological data. The general idea of K-means is that a number of centers are specified and a distance metric from these centers is used as a dissimilarity measure. The points are grouped towards the closest center based on the criteria used. For example, one of the widely used metrics is the Euclidean Distance. The Euclidean Distance [8] between values xi and xi’ can be defined as follows:
Then each of the points, genes in this case, will be assigned to cluster so that the distance between these points and the specified center is minimized. After that, a new set of centers are calculated and the assignment step is repeated. The process continues iteratively until the assignments stabilize so that no further assignments changes are possible.
2. Experimental Analysis
2.1. Datasets
In order to elucidate the work in this paper, a group of data sets were obtained and preprocessed in order to suite the setting required for this work. The following is a listing of the datasets used in the analysis.
- Interaction Networks
The experiments were performed using Homosapiens (Humans) protein-protein interaction network. The Human network was obtained from the Human Protein Reference Database (HPRD), release 9 [9]. The Human PPI network has 9465 nodes with 37039 interactions.
- Disease Gene profiles
In order to perform the planned analysis, gene expression profiles for 16 diseases were obtained from the GEO database [10]. Table 1 shows the names and identification numbers of these diseases.
- OMIM dataset
The OMIM, Online Mendelian Inheritance in Man, database [11] was used to extract genes-disease data. The data includes 4022 different diseases. Each disease is represented by the genes causing it or in relation to that disease.
- Human protein complexes
The human protein complexes are groups of proteins that have strong evidence that they are interact with each other. The protein complexes were extracted from HPRD (Human Protein Reference Database), release 9 [9]. This data set contains 1521 of manually curated protein complexes.
- Molecular Functionality
For studying Molecular functions of the Human genes, the Molecular Functions from the GO annotation database were used (release date of the data base: 11/15/2011, version: 1.216) [12].
2.2. Performing Experiments
After obtaining all the datasets needed for this work, both MCL and K-means were employed to discover the interesting patterns.
Firstly, the MCL algorithm was applied to the HPRD interaction network. MCL uses a parameter that controls its operation. That parameter is called inflation. I used an inflation of 1.75 which is considered optimal according to [6]. I only considered the resulting patterns of sizes greater than or equal to 4 genes. The MCL produces connected modules when applied to the interaction network. The result contains 776 modules.
Table 1. Disease Datasets for expression profiles
| GEO Series ID | GEO DataSet ID | Disease Name |
| GSE2503 | GDS2200 | Actinic keratosis |
| GSE1420 | GDS1321 | Adenocarcinoma of esophagus |
| GSE1297 | GDS810 | Alzheimer’s disease |
| GSE5388 | GDS2190 | Bipolar disorder |
| GSE475 | GDS289 | Chronic obstructive lung disease |
| GSE1462 | GDS1065 | Chronic progressive ophthalmoplegia |
| GSE1629 | GDS1850 | Complex dental cavity |
| GSE3585 | GDS2205 | Congestive cardiomyopathy |
| GSE3365 | GDS1615 | Crohn’s disease |
| GSE5370 | GDS2153 | Dermatomyositis |
| GSE2006 | GDS1376 | Essential thrombocythemia |
| GSE1751 | GDS1331 | Huntington’s disease |
| GSE2018 | GDS999 | Lung transplant rejection |
| GSE3189 | GDS1375 | Malignant melanoma |
| GSE3868 | GDS1746 | Malignant neoplasm of prostate |
| GSE2549 | GDS1220 | Malignant pleural mesothelioma |
2.3. Performing Experiments
After obtaining all the datasets needed for this work, both MCL and K-means were employed to discover the interesting patterns.
Firstly, the MCL algorithm was applied to the HPRD interaction network. MCL uses a parameter that controls its operation. That parameter is called inflation. I used an inflation of 1.75 which is considered optimal according to [6]. I only considered the resulting patterns of sizes greater than or equal to 4 genes. The MCL produces connected modules when applied to the interaction network. The result contains 776 modules.
Secondly, the K-means algorithm was applied to the gene disease expression profile data. In order to have comparable number of modules to the one produced by the MCL, the number of modules resulting from the MCL was used as the number of K-means initial centers (clusters). Then, the analysis was performed with clusters of sizes greater than 4 genes (similar to what was done in MCL). K-means produced 1039 module of size ≥ 4 genes. The genes in these modules show similar behavior according to the disease expression data used in this study.
2.4. Human protien complexes
The following analysis was performed to assess the quality of the MCL and K-means produced modules in predicting known protein complexes. Those complexes are proved to have biological significance. Therefore, more matched complexes by the produced patterns means higher quality patterns from the biological point of view.
For assessing complex matching, I used the matching criteria introduced by [13]. The overlap score was computed by the formula w = i2/a*b, where i is the size of the intersection set between the discovered patterns and the known complex, a is the size of the discovered protein pattern and b is the size of known protein complex. The overlap threshold between produced patterns and the protein complexes ranged from 0.1 to 1.0 with 0.1 increments; 1.0 implies a 100% match between the module and the protein complex. The range was chosen to make the overlapping abilities of the discovered patterns a tangible amount illustrating the quality of these patterns. Furthermore, we have not considered any overlap to be considered as a match which would may be seen as an overstatement of these results. More overlap indicates a better match with protein complexes, however knowing that more protein complexes are yet to be identified, even a lower match percentage can highlight some promising results. Figure 1 illustrates the MCL performance. While Figure 2 shows the performance of K-means prediction capability. Clearly, MCL has superiority over the K-means and was able to predict protein complexes even with higher overlap thresholds. This can be referred to the fact that many of the complexes are known to be well connected sub-graphs originally, and MCL aims at producing connected modules. Furthermore, K-means does not care about patterns connectivity. It is only concerned of expression similarity.
Another note about the results that I found interesting is that the larger the produced pattern the more penalty it will face in the complex matching process. This is because the average size of protein complexes is ≈ 5 genes and the criteria used for matching penalizes large patterns.
2.5. OMIM disease modules
The OMIM dataset provides a comprehensive collection of diseases that relates a large number of known diseases to the genes that are causing them or have a strong involvement in the cause and the mechanisms of the disease, in other words the Etiology and Pathogenesis of a disease. To evaluate the produced patterns and to have more insights that they can provide in the disease domain, both MCL and K-means produced patterns were tested against the OMIM disease dataset. This analysis aimed at discovering modules that might be related to known diseases.
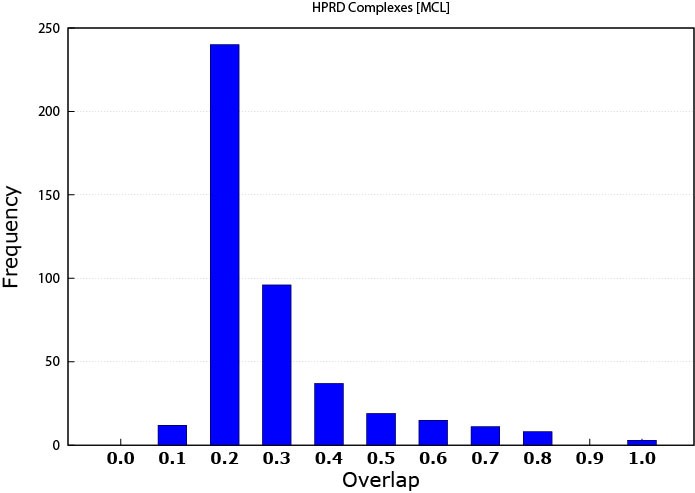 Figure 1. MCL protein complex prediction
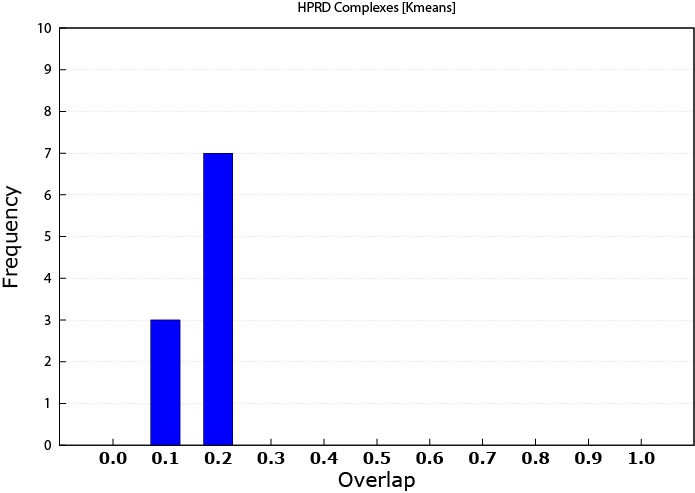 Figure 2. K-means protein complex prediction
As expected, the K-means slightly outperformed the MCL in this case. In this work, the patterns in the OMIM dataset are referred to as disease modules.
MCL produced patterns matched 68 disease modules while K-means matched 134 disease modules. The reason is that K-means patterns were originally based on data that is disease related. Some of the diseases that were used to create expression profile dataset were among the ones that were found from the OMIM dataset. As mentioned above, this study used only 16 diseases expression data, while the resultant matched diseases were multiples of that number. An explanation is that some genes can be involved in multiple diseases. This note means that some genes play the rule of a link between different diseases.
Thus, targeting these specific genes can illuminate hidden information that might lead interesting results; the cure for example. However, this statement needs more investigation by intensive research that is out of the scope of this work. In addition, a produced pattern can match more than one disease.
Figure 3 shows the performance of MCL when used with the OMIM dataset. Figure 4 is similar but for K-means. Table 2 and Table 3 show some of the disease matched by the MCL and K-means modules respectively. More specifically, Table 3 shows that some produced modules by K-means has matched multiple types of disease.
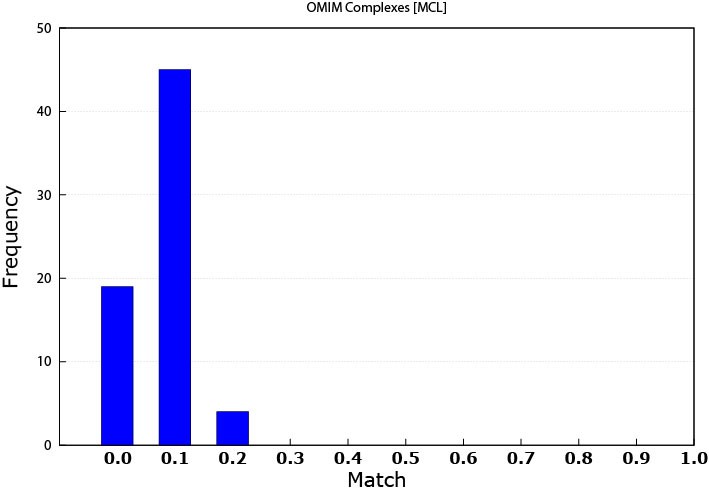 Figure 3. MCL matching performance against the OMIM data (0.0 means that the threshold is ≤ 0.1)
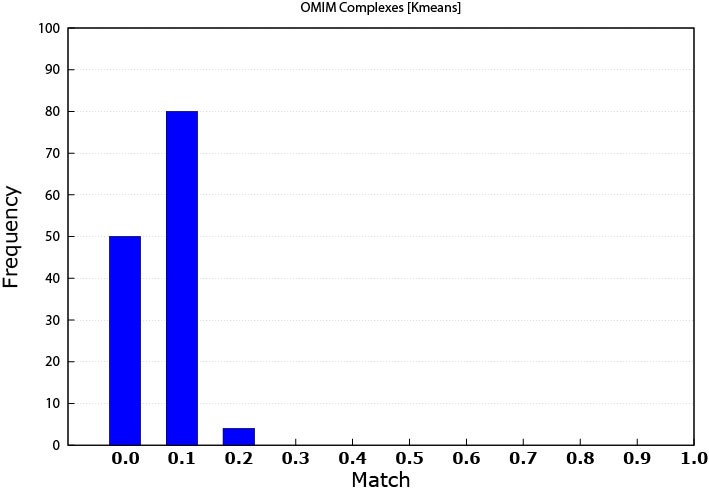 Figure 4. K-means matching performance against the OMIM data (0.0 means that the threshold is ≤ 0.1)
Table 2. Some of the MCL matched disease
| Module’s Genes | Related Disease |
| CDK2AP1 CDK2AP2 WARS PC GOT2 MDH2 CS ZDHHC6 FH NDUFS1 | Thrombophilia due to protein C deficiency autosomal dominant |
| FANCC FANCA FANCE FANCG FANCF HES1 SAMD3 CYP19A1 | Fanconi anemia complementation |
| GORASP2 RAB2A BLZF1 MIF NQO2 KCTD5 FAM71C | Persistent Mullerian duct syndrome type I |
| LYST SEMA4C DGCR14 MRPL17 NCDN DNAJC14 CNTROB | Chediak-Higashi syndrome |
| SHH PTCH1 PTCH2 IHH SMO DHH HHIP | Basal cell carcinoma somatic |
| NSF GABBR1 NAPG ATF5 GABBR2 PTPN9 | Nicotine dependence susceptibility |
| CYP17A1 POR CYP2C19 CYP1A2 CYP2C9 CYP2E1 | Mephenytoin poor metabolizer |
| NHEJ1 LIG4 XRCC4 APLF IRX5 | Multiple myeloma resistance, Severe combined immunodeficiency with sensitivity to ionizing radiation |
| KDR ITGA9 FLT4 FIGF VEGFC | Hemangioma capillary infantile somatic |
| DHX9 SERPINB2 C6 MGEA5 PRPF8 | Combined C6/C7 deficiency |
3. Molecular functionality
As a further step, the Molecular Functionality (MF) of the genes can be considered as a useful source of information in many aspects. First, knowledge about the MF of the genes in the produced patterns is informative especially if some of the genes in the pattern are not well studied and their functions are not well known, but the association in the pattern may result in new data about these genes. Second, the combination between the MF of the patterns and the disease expression data can lead to meaningful indications about the disease mechanisms inside the living organism, the human in this case. Molecular Functions Gene Ontologies were extracted from the Gene Ontology project [12]. Studying the resulting modules showed that modules span multiple molecular functionalities and they did not show any tendency towards some particular biological processes. However, modules gene members have shown high similarities in what biological processes they share.
Table 3. Some of the K-means matched disease
| Module’s Genes | Related Disease |
| PKD2 IGBP1 TXNL4A NID1 | Polycystic kidney disease |
| PKD2 IGBP1 TXNL4A NID1 | Corpus callosum agenesis of with mental retardation ocular ,coloboma and micrognathia |
| SLC9A1 ADAM2 GMPS HIVEP2 | Leukemia acute myelogenous |
| PCSK7 TES BSN COL10A1 | Metaphyseal chondrodysplasia Schmid |
| PHEX INSL3 WDR61 APPL1 | Cryptorchidism idiopathic |
| SI PDX1 BNIP2 DNAJA2 | Sucraseisomaltase deficiency congenital |
| SI PDX1 BNIP2 DNAJA2 | Lacticacidemia due to PDX1 deficiency |
| PTRF MPP3 TSPAN4 SERPIND1 GRIP1 | Thrombophilia due to heparin cofactor II deficiency |
| AKAP4 MDK SH2D1A SLC12A3 RPP40 | Mesomelic dysplasia Kantaputra |
| GADD45G TRO NPR1 BACH1 | Breast cancer early-onset |
Figure 5 has an example module that is enriched in a number of multiple molecular functions such as, GO:0008601: Modulation of the activity of the enzyme protein phosphatase type 2A. GO:0019888: Modulates the activity of a protein phosphatase, an enzyme which catalyzes of the removal of a phosphate group from a protein substrate molecule GO:0019208: Modulates the activity of a phosphatase, an enzyme which catalyzes of the removal of a phosphate group from a substrate molecule. GO:0005488: The selective, non-covalent, often stoichiometric, interaction of a molecule with one or more specific sites on another molecule. GO:0004512: Catalysis of the reaction: D-glucose 6- phosphate = 1D-myo-inositol 3-phosphate. This reaction requires NAD, which dehydrogenates the CHOH group to CO at C-5 of the glucose 6-phosphate, making C-6 into an active methylene, able to condense with the aldehyde at C- 1. Finally, the enzyme-bound NADH reconverts C-5 into the CHOH form. GO:0005515: Interacting selectively and non-covalently with any protein or protein complex. The above results were obtained using The Database for Annotation, Visualization and Integrated Discovery (DAVID) [14] [15].
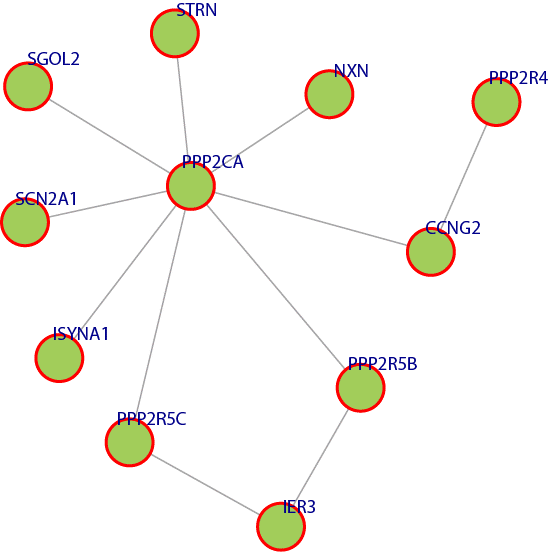 Figure 5. A module that was extracted from the network where all the genes have similar molecular functionality.
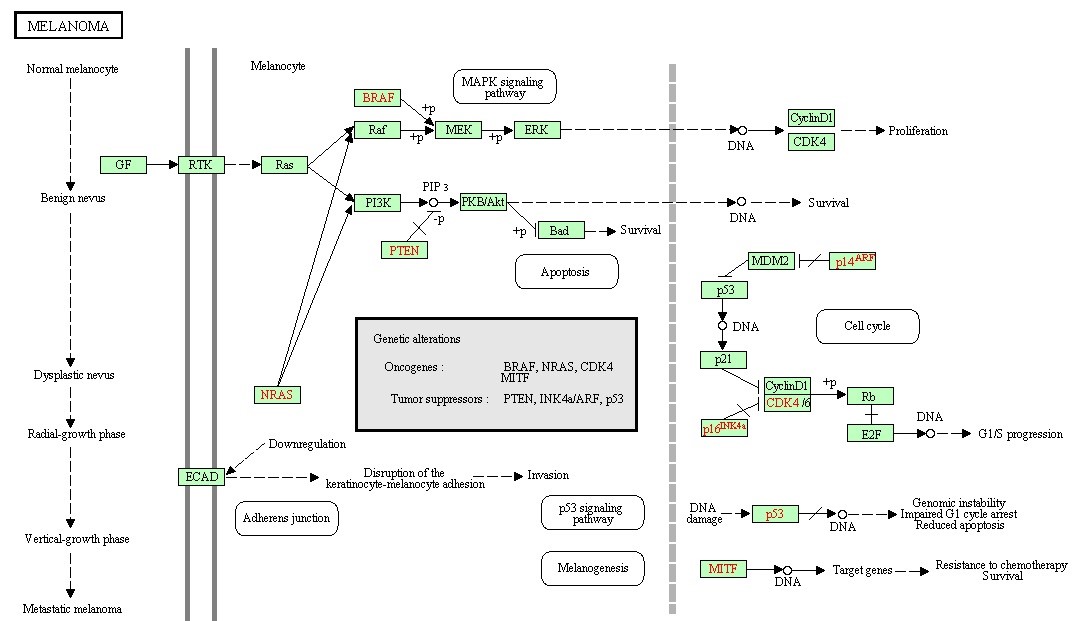 Figure 6. The prostate cancer pathway.
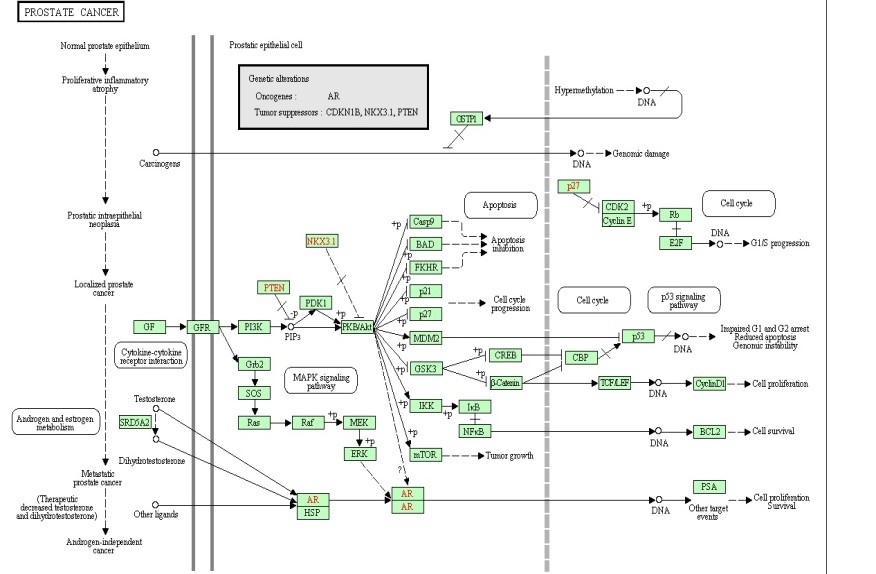 Figure 7. The Melanoma pathway.
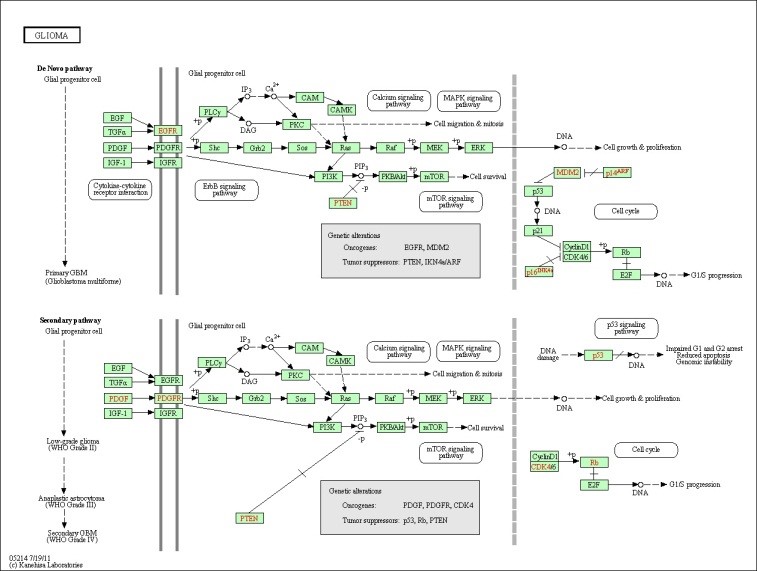 Figure 8. The Glioma pathway.
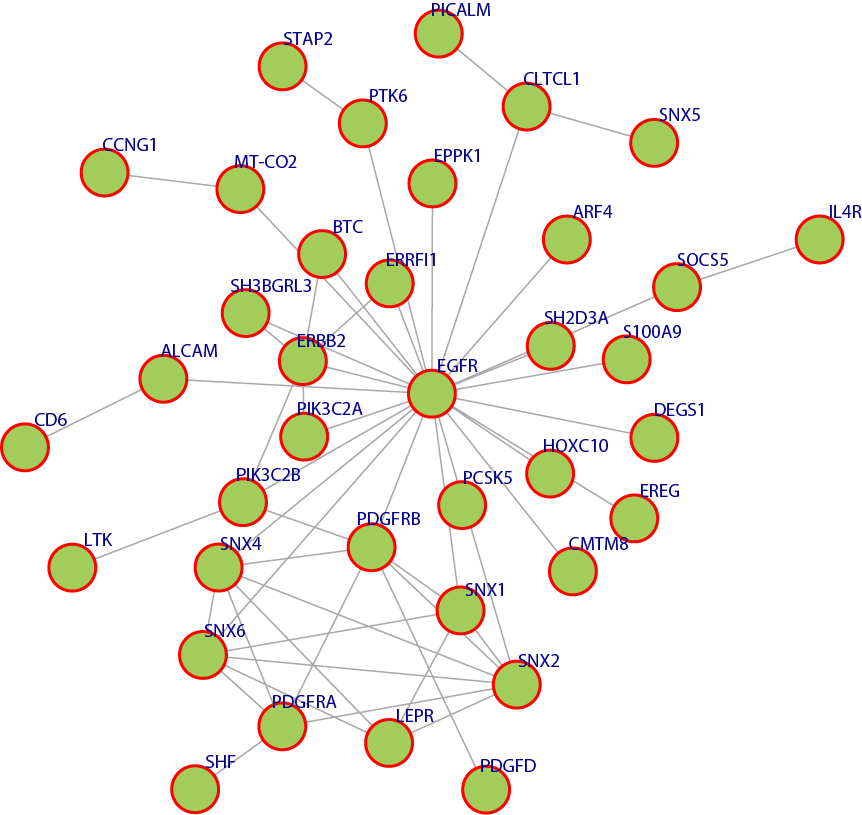 Figure 9. This discovered pattern above shows a module that is overlapped with multiple disease pathways
4. Pathways
Many of the discovered modules have biological pathways associations. Biological pathway is a group of actions that occur between the molecules in the cell that result in the formation of a new product or change in the cell. This association with pathways was checked against the Kyoto Encyclopedia of Genes and Genomes (KEGG) [16]. To illustrate the idea further, some example pathways chosen were very interesting in that they have a relation with different types of diseases. Figure 6, 7, 8, and 9 have some examples of disease-related pathways like: Prostate cancer pathway, Glioma pathway, and Melanoma pathway. In addition, another example (not shown here) matched the Notch Signaling Pathway. Notch signaling has been related to a number of malignancies including leukemia, lymphomas and carcinomas of the breast, skin, lung, cervix and kidneys [9]. It is clear from Figure 6, that one of the discovered modules has several genes that are highly incorporated in multiple disease pathways. Furthermore, we can see that not all of the module genes are present in those pathways; this raises an interesting question; can future research prove that those absent genes are related to the same pathway and therefore to the diseases because they were clustered with several of the pathway genes?
5. Conclusion
The availability of large amounts of microarray data in, both interaction networks and expression profiles, has been used to have deeper insights of what biological processes are taking place inside an organism. Much of this data is related to different aspects of the living cell activities. In addition, this expression data can be extracted from organism or tissues under a group of experimental, environmental, or any kind of stress conditions. Diseases expression data can be considered a very useful source of information regarding what genes are involved in or affected by them. In this study I tried to shed some lights about modules extracted from two separate sources of information and what relations they may have with known diseases and try to uncover some of new connections between genes and diseases. Both of the two methods employed here, MCL and K-means, have its strength sides and weakness sides. When it comes to interaction networks, MCL was superior. However, K-means has shown acceptable performance with expression profile data. The method has produced interesting patterns when they are tested against several biological concepts such as protein complexes, disease modules, molecular functionality, and biological pathways.
- Fang, M. Sun, G. Dai and K. Ramain, “The Intrinsic Geometric Structure of Protein-Protein Interaction Networks for Protein Interaction Prediction,” in IEEE/ACM Transactions on Computational Biology and Bioinformatics, vol. 13, no. 1, pp. 76-85, Jan.-Feb. 1 2016. doi: 10.1109/TCBB.2015.2456876
- M . Bansal, V. Belcastro, A. Ambesi-Impiombato, D. di Bernardo.” How to infer gene networks from expression profiles”. Mol Syst Biol 3: 78, 2007. https://dx.doi.org/10.1038%2Fmsb4100120
- Ulitsky, I. Gat-Viks, R. Shamir. ”MetaReg: a platform for modeling,analysis and visualization of biological systems using large-scale experimental data”. Genome Biol 9: R1, 2008. https://dx.doi.org/10.1186%2Fgb-2008-9-1-r1
- van Dongen. “A new cluster algorithm for graphs”. Report No. INS-R0012, Center for Mathematics and Computer Science (CWI), Amsterdam, 2000.
- van Dongen. “Graph clustering via a discrete uncoupling process”. SIAM J Matrix Anal Appl, 30(1): 121–141, 2008. https://doi.org/10.1137/040608635
- Broh´ee and J. van Helden. “Evaluation of clustering algorithms for protein-protein interaction networks”. BMC Bioinformatics, 7(488), 2006. https://doi.org/10.1186/s12859-014-0445-4
- B. MacQueen. ”Some methods for classification and analysis of multivariate observations” Proceedings of the Fifth Berkeley Symposium on Mathematical Statistics and Probability, 1967. https://projecteuclid.org/euclid.bsmsp/1200512992
- Liberti, C. Lavor, N. Maculan, and A. Mucherino. “Euclidean Distance Geometry and Applications”. SIAM Review. 56:1, 3-69. 2014. DOI10.1137/120875909.
- Baolin and H. Bo. “Hprd: a high performance rdf database”. In Proceedings of the 2007 IFIP international conference on Network and parallel computing , NPC’07, pages 364–374, Berlin, Heidelberg, 2007. Springer-Verlag. https://doi.org/10.1007/978-3-540-74784-0_37
- Barrett , D.B. Troup , S. E. Wilhite , P. Ledoux , D Rudnev, et al. “NCBI GEO: archive for high-throughput functional genomic data”. Nucleic Acids Res 37: D885–890. 2009. https://doi.org/10.1093/nar/gkn764
- “Online Mendelian Inheritance in Man, OMIM”. McKusick-Nathans Institute of Genetic Medicine, Johns Hopkins University (Baltimore, MD). 2011. URL: http://omim.org/. https://doi.org/10.1093/nar/gki033
- The gene ontology consortium. “Gene ontology: tool for the unification of biology”. Nat. Genet., 25(1):25–29, May 2000. http://dx.doi.org/10.1038/75556
- D. Bader and W.V. Christopher. “An automated method for finding molecular complexes in large protein interaction networks”. BMC Bioinformatics, 4 (2), 2003. https://dx.doi.org/10.1186%2F1471-2105-4-2
- W. Huang, B. T. Sherman, R. A. Lempicki. “Systematic and integrative analysis of large gene lists using david bioinformatics resources”. Nat. Protocols, 4(1754-2189), 2008/12//print. http://dx.doi.org/10.1038/nprot.2008.211
- W. Huang, B. T. Sherman, and R. A.Lempicki. “Bioinformatics enrichment tools: paths toward the comprehensive functional analysis of large gene lists”. Nucleic Acids Research, 37(1):1–13, 2009. https://dx.doi.org/10.1093/nar/gkn923
- M. Kanehisa, S. Goto, M. Furumichi, M. Tanabe, and M. Hirakawa. “Kegg for representation and analysis of molecular networks involving diseases and drugs”. Nucleic Acids Research, 38(suppl 1):D355–D360, 2010. https://dx.doi.org/10.1093/nar/gkp896