An Efficient Automotive Paint Defect Detection System

Adv. Sci. Technol. Eng. Syst. J. 4(3), 171–182 (2019);
 DOI: 10.25046/aj040323
Vision-based defect detection techniques are widely used for quality control purposes. In this work, an efficient deflectometry based detection system is developed for semi-specular/painted surface defect detection. This system consists of a robotic arm that carries a screen/camera setup and can detect defects on large surfaces with different topologies, such as a car bumper, by traversing its profile. A hybrid pipeline is designed that utilizes multi-threading for optimal resource utilization and process speed. Specific filters are also designed to remove spurious defects introduced by acute curvature changes and part edges. The system was successful in consistently detecting various defects on small test samples as well as on large bumper parts with varying topology and color and can accommodate inherent ambient lighting and vibration issues.
1. Introduction
Quality control is a crucial factor in manufacturing industry as it affects customer satisfaction, reduces production cost and increases profitability. In the automotive industry, vehicles are usually assembled from parts shipped by various original equipment manufacturers (OEM) to the assembly plant. Example of these parts includes front and back bumper covers, side fenders, and other exterior parts which are normally manufactured and painted to specific colour before being shipped to another plant for assembly. These outer body parts are made by Thermoplastic PolyOlefin (TPO) injection moulding process. This process consists of three main steps: moulding, cleaning, and painting. Defects may induce during any of these processes, which results in part rejection or rework, causing loss of revenue. As such, it is essential to perform a full inspection of every part. This inspection process is usually carried out by human inspectors. It is a costly and a labour intensive job which requires multiple inspection lines for high volume yield. Further, the defect judgement is very subjective, which results in inconsistencies. As a result, overall productivity and quality are diminished. This paper presents a system for inspecting automotive painted semi-specular exterior body parts and is an extension of work originally presented in 15th Conference on Computer and Robot Vision (CRV 2018) [1]. This extended version includes expended testing and analysis.
There are a series of challenges that impact the development of an inspection system for this task, including:
- Parts are in motion while they are inspected on the production line. The vibrations induced from this motion makes profiling the surface harder.
- The inspection process must fit within the existing production cycle time.
- The part being inspected vary in curvature, size, shape and material, with different specular characteristics.
- The visibility characteristic of the defect depends on the external lighting conditions. Designing a proper lighting environment for such a system is a challenging task due to high reflection coefficient of the test surface [2].
- Each type of defect varies in shape and size, and experienced inspectors even miss some defects.
In recent years, vision-based surface inspection systems have found a burst of application in areas such as defect detection in aluminium sheets [2], locomotive rail tracks [3], liquid crystal displays (LCDs) [4], plastic objects [5], sphere parts [6], agricultural food produce [7], fabric and textile industry [8] etc. However, defect detection and surface profiling of a specular surface remains a challenging problem due to the reflective nature of the surface. Profilometry is a widely used approach for characterization, reconstruction and inspection of such surfaces. Profilometry approaches can be generally divided into contact and non-contact methods. Contact-based profilometry, such as stylus profilometer, scanning tunnelling microscopy, scanning force microscopy, coordinate measuring machine (CMM), etc., is a high-resolution method. The measurement accuracy is in the order of nanometers and is considered as a gold standard for surface finish measurement. This approach is independent of surface characteristics or shape and also works well in dirty environments. As a result, it can be used for both specular and non-specular surface measurement. However, being a direct contact method, it may damage high finish inspection surfaces such as painted automotive parts and its operating speed is also sluggish.
Non-contact profilometry methods are used for high-speed surface scanning and 3D reconstruction [9]. Over the years, many different non-contact profilometry techniques are developed, such as common structured light projection, phase shifting interferometry, deflectometry, digital holographic microscopy, etc. These approaches are based on the inhomogeneous reflection of light from defects. The visibility of defects can be enhanced by the use of a structured light source. In common structured light projection method, the specular surface is coated with a thin layer of powder to make it behave like a diffused surface [10] and then fringe pattern profilometry is used for analysis. This additional coating changes the surface geometry so cannot be reliably used for surface defect detection. On the other hand, interferometry is highly accurate but requires a reference and is not suitable for complicated free-form surfaces. Further, the field of view is limited, so it cannot be used for large surfaces. Hence, deflectometry is recently used for measuring a large object with varied surface topology. A sinusoidal fringe pattern is widely used as a structured light source in deflectometry analysis [11]. In smooth defect-free regions, imaging process obeys specular reflection while the incident rays are dispersed in defected areas. As a result, an acute gradient variation is observed in defect bearing regions, which is used for defect segmentation. These approaches have a lower measurement accuracy (in micrometres range) compared to contact profilometry approaches. Since these approaches are surface dependent, so are affected by the testing environment as any dirt or external dust particles will affect the obtained results.
A new defect detection system is presented in this paper, which is based on the deflectometry principle. The developed system can overcome the practical challenges of a production line. Controlled lighting and camera configurations are designed to counterpoise vibration effects. Various filters are used to segment the region of interest and eliminate false defects due to edge effect and abrupt curvature changes. Finally, to track parts while going through the production line, the system is designed to be mounted at the end of a robotic arm. The proposed system is validated by field testing in an operational automotive painting booth.
The remainder of this paper is organized as follows: Section 2 provides a brief review of the deflectometry principle as it is the foundation of the defect detection system. Section 3 describes the proposed system and explains the working of its different components. Section 4 depicts the system setup and presents implementation details. Section 5 archives the obtained experimental results with analysis. Finally, Section 6 summarizes the findings of this research and highlights some areas of future development.
2. Reflectometry Principle
In this section, we will provide a brief overview of the deflectometry principle, which forms the basis of the proposed system’s working principle. The use of deflectometry is actively explored by researchers for the measurement of objects with an abrupt slope change or large size. Many different deflectometry methods are proposed for surface profilometry and defect detection. Some of these include Moier deflectometry [12–16], Ronchi method [17,18], laser scanning deflectometry [19–21], and phase measuring deflectometry (PMD) [11,22–24].
PMD technique is used in this paper as it is highly accurate and provides continuous data for surface profiling. It has a large dynamic range and can give fullfield measurements. This technique is first developed by Horneber et al. [25]. Over the years, researchers have modified PMD to measure different specular objects [11, 26, 27]. PMD is also successfully applied for specular and semi-specular surface defect detection [28–33]. However, various challenges arise while implementing deflectometry to inspect a larger part like a car bumper which are successfully addressed in the developed system.
2.1. Phase-shifting Deflectometry
In deflectometry, the topographical information of a specular surface is obtained by analysing the reflections of a structured light source. A sinusoidal fringe pattern, displayed on an LCD screen located at some distance from the specular test surface, acts as the light source. The attached camera setup captures the reflections of the deformed pattern from the test surface. By applying phase-shifting and phase-unwrapping algorithms, useful information is extracted from these deformed fringe patterns which are used for surface profile construction. A phase varying single frequency pattern is generally used for deflectometry analysis. A pixelated version of such a multi-phase single frequency pattern is defined as [34]:
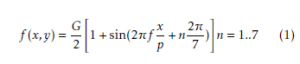
where, f (x,y) is the displayed pattern intensity at (x,y) pixel location, G is the maximum of the image intensity range, f is the frequency of the displayed pattern, p is the total pixels in a time period and n is the number of phase-shifted patterns selected.
These phase-shifted patterns are one-by-one displayed on the LCD screen, and their reflections are captured from the specular surface. The intensity of the captured pattern is given by (2) [35].
![]()
where I(x,y) is the captured image intensity, A(x,y) is the ambient light intensity, B(x,y) is the amplitude of the modulated fringe pattern and φ(x,y) is the desired phase measurement.
The measured phase is directly related to the surface topology. Computing this phase at each pixel location will create a surface phase map. Captured surface reflections of the phase-shifted patterns are used to calculate this phase map by applying Windowed DiscreteFourier Transform (WDFT). For seven phase-shifted single frequency patterns, the closed-form solution is represented by the following relation [36]:
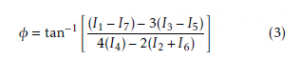
where I1,···,7 correspond to the captured reflections of the seven phase-shifted patterns displayed on the LCD screen. The phase map (φ(x,y)) is in 0−2π range, so a phase unwrapping step is needed to recover the actual phase with the inclusion of appropriate multiples of 2π [37]. Then the absolute derivative of the phase map is computed with respect to pattern variation axis (x-axis) as defined by the following equation [33]:
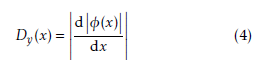
here, Dy(x) is a continuous function which represents line topography for the corresponding yth-axis.
The effect of this differential operation is the attenuation of low-frequency signal information and accentuation of high-frequency contents induced due to the presence of defects in the specular/semi-specular surface. As a result, Dy(x) remains almost constant in defect-free regions, whereas an acute variation is observed in defect-bearing areas.
3. Defect Detection System
Use of deflectometry for big automobile bumper inspection brings its own set of challenges. Its impractical to examine the entire part surface in one scan. Therefore, it is divided into smaller segments based on the reflection of the displayed pattern. Since external light sources impact the detection results, controlled lighting setup is constructed to minimize the effect of these external factors. Figure 1 shows the image processing pipeline used. Captured surface reflections are pre-processed before deflectometric defect detection operation. Several false positives are observed due to the topographical variation in the test surface. A set of spurious defect removal filters are designed to eliminate these false positives. Camera shutter speed, aperture and robotic motion are adjusted to reduce vibration effects and eradicate motion blur. Since the detection operation is carried out in small segments, the results are then combined and localized on test parts. Finally, defect characteristics are gathered and archived in the designed database which can later be used for display or higher level decision making for process improvement. The following sections provide additional details on the functionality of different components.
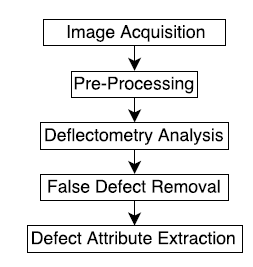
Figure 1: Defect detection scheme
3.1. Capturing and Pre-processing
Figure 2 and Figure 3 show the process involved in capturing and pre-processing of images. OpenGL library is used for the rendering of seven phase-shifted sinusoidal patterns. The patterns are generated only once during the run-time using pattern screen resolution and then stored in memory as 2D matrices. Later on, these stored patterns are displayed one-by-one for deflectometry analysis. The reflection of these patterns is captured from the part surface by an attached camera. Pattern display and capture of surface reflections are carried out sequentially. Once a set of seven surface reflections is captured, a pre-processing thread is initiated to compute the phase map and find its derivative. It is noted that a single phase-map-derivative image is created for each segment. While the pre-processing step is running, the next set of seven patterns are ready to be displayed on the screen and captured by the camera. This multi-threading approach reduces cycle time through parallel computation.
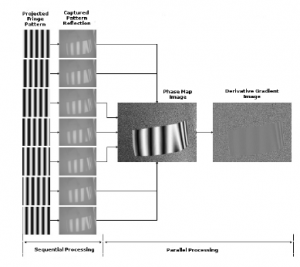
Figure 3: Surface reflection capturing and phase-map-derivative image generation
Once the Capturing and Pre-processing steps are completed, a defect detection thread is initiated, which extracts defect information from the phase-mapderivative image. Defect detection process can be divided into three main stages; Fringe region segmentation, Defect pool and spurious defect elimination and Defect attributes extraction and registration.
3.2. Fringe Region Segmentation
A fixed focus camera at a defined distance from the test surface is used in this study. As a result, the camera captures a fixed size image that may contain both the fringe projected region and non-fringe region. Further, the size of the reflected pattern varies with the surface curvature; the reflected pattern shrinks as the surface become convex. As a result, the first step in the defect detection process is to crop the fringe pattern projected region from the phase-map-derivative image.
The obtained phase-map-derivative image in the previous step is thresholded and smoothed with a Gaussian kernel. The resulted blobs are eroded to defects below the accepted size criterion, edge defects and defects due to abrupt curvature changes. Three different filters; Size/Noise filter, Surface curvature filter and Edge filter are designed to remove these false defects. These filters work in parallel to remove these defects as depicted in Figure 5.
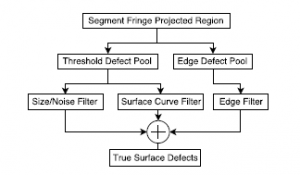
Figure 5: Processing and false defect removal
A size based filter is designed to remove tiny noise like defects. It is observed that after thresholding, several very small defects are detected in the binary image. This filter removes all those defects which are below the given size criterion. The second filter removes the false defects from the curved region. This filter uses parallel lines to determine the curved region in the captured surface reflection. A Canny edge detection operation followed by Hough transform is used for these lines detection. The angle variation of the detected lines is exploited to determine the curved region from where the defects are removed. The last filter removes spurious defects in the edge region, which are the result of the application of WDFT. It makes use of both curved region information and defect pool generated by Canny edge detection operation to segregate defects produced due to edge effect.
The application of these filters results in three separate images that contain only legitimate defects. Later on, all these defects are aggregated together to form an image which shows all the valid defects in the inspected region as depicted in Figure 5. Application of these filters on a typical gradient image is shown in Figure 6.
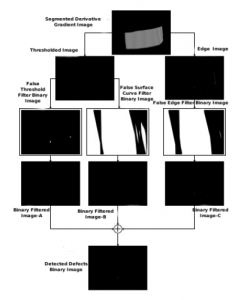
Figure 6: Application of false defect filters on defect pool
3.3. Defect Attributes Extraction and Registration
Once all the true defects are found, defect attributes such as size (in terms of pixels), bounding region and centroid location are determined. To extract these characteristics, close by defects are first fused by a morphological dilation operation. Later on, a contour-finding operation is performed to separate different defects and then above mentioned attributes are computed for each found contour.
These attributes are also recorded in the appended database, which can be used in future for tracking, decision making or other process adjustments. The results are also overlaid on a part image for physical defect localization which is saved in a directory for immediate use. All these different steps are delineated in Figure 7.
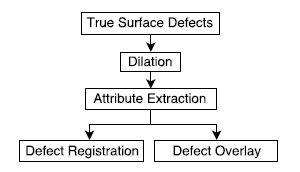
Figure 7: Defect attributes extraction and display
4. Implementation Details and Experimental Setup
4.1. System Architecture
Figure 8 shows the entire system implementation. Since the system is expected to inspect large parts, a robotic arm is used where the pattern screen and camera are mounted on the end-effector. The system includes several additional components to enable robot movement for full part inspection such as positioning of the robot end effector, generation of inspection patterns and administrative operations such as results registration and display.
The defect detection process consists of both sequential and parallel operations. As a result, a hybrid computational framework is designed. It is evident in Figure 8 that individual steps need to be completed to proceed to the next component for processing, so parallel operations (multi-threading) are only used for computationally expensive processes. First of all, robot positions the LCD pattern screen tangent to the surface to be inspected. Then seven phase-shifted sinusoidal fringe patterns are sequentially displayed on the screen, and the attached camera captures corresponding surface reflections. These surface reflections are pre-processed, and defect detection operation is applied to find the surface abnormalities. These two steps, pre-processing and defect detection, are computationally expensive, and multi-threading is used here. This multi-threading operation can be activated/deactivated by the frontal administrative control panel. All detected defect information is stored in the designed database system that can be accessed remotely. All these steps are controlled by a front end administrative control panel, which also displays a sample test part image on which detected results are overlaid. It also provides the option to configure features such as directory paths for registering captured and processed images, the number of segments to divide the test surface and displays the progress of the detection operation.
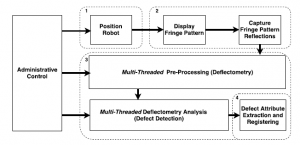
Figure 8: Schematic of implemented defect detection system
4.2. Experimental Setup
4.2.1. Overall Setup
Testing was conducted at the Robotics Institute @ Guelph lab. The experimental setup is shown in Figure 9. The test parts were placed on a carrier similar to the ones used at the part manufacturing facility. The carrier was stationary during the testing. A KUKA KR 16-2 KS industrial robotic arm is used to carry the screen/camera setup to transverse the large bumpers under test. The robotic arm was programmed to move in a predefined path to inspect each segment and hence the whole part. This operation controls the movement of the screen/camera setup. A controlled lighting environment was enforced where the pattern screen is the only source of illumination. Any direct light source incident on the part whose reflection reaches the camera will create a blind spot in the gradient image. The test surface should also be free of any dust particles as they will produce a dispersed reflection of light and will appear as a defect. A 40 inch commercial TV screen is used as the pattern screen. The computing system consists of an Intel Core i7-6700 3.40 GHz processor and has 16 GB RAM and Nvidia GTX960 graphics card running on 64-bit Windows 10 OS. The detection code is written in C++ using Qt Creator 5.6, OpenCV 3.2 and OpenGL libraries. The camera is connected via high-speed USB 3.0 connection and pattern screen is interfaced with an HDMI cable.
4.2.2. Camera Setup
A monochrome Point Grey 3.2 MP (GS3-U3-32S4M-
- C) camera with a 12.5 mm Fujinon lens HF12.5HSA-1
(LENS-50FS-125C) is used. The camera is attached to a specially designed fixture on the side of the pattern screen so that it looks in the middle of the projected pattern on the test sample, as seen in Figure 10. A fixed focus camera, as already mentioned, is sharply focused on the test surface, which is approximately 40 cm away from the camera. Once the robot starts traversing the surface topology, a distance of 35 cm to 45 cm is maintained so that the image remains within the camera’s depth of filed and hence sharply focused.
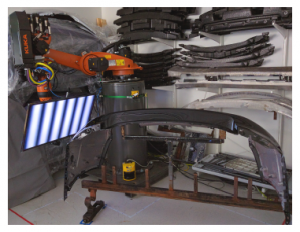
Figure 9: Experimental setup
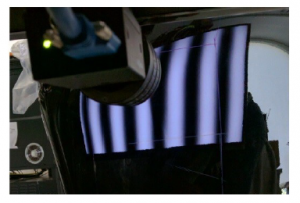
Figure 10: Camera view
4.3. Surface Segmentation
It is virtually impossible to inspect the full test part in one capture due to its large size. There are two reasons for this. Firstly, there is a lot of variation in the surface topology of the test surface, and the pattern screen should be tangent to it to capture the displayed pattern. Secondly, only a limited payload both in terms of size and weight can be attached to the robot end effector. Hence, a huge screen which can project the pattern on the full part cannot be used. As a result, the test surface is partitioned in small regions based on the reflected pattern as shown in Figure 11.
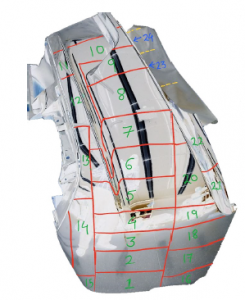
Figure 11: Bumper segmentation for inspection
Seven phase-shifted sinusoidal patterns are projected on each region, and the attached camera captures corresponding reflections. There is some overlap in the captured surface reflections among adjacent segments that accommodate for some variation in part placement. These different regions are then appended together to localize the identified defects on the entire test surface.
4.4. Test Specimen
Ten test samples are used in this study. These samples are provided by an OEM exterior body parts manufacturer. These are large SUV/Minivan bumpers of 5.5 ft long, 1.5 ft high and 2.5 ft deep, as shown in Figure 11. These bumpers are of different colours and are rejected due to the presence of various surface defects. These defects are marked on the test parts by expert human inspectors working at the manufacturing facility. In addition to these defects, some more defects are artificially created to augment the defect database used as ground truth (GT). Since the bumpers are symmetric, we only needed to inspect one half of each bumper. In real production, two robots can be used to examine the whole bumper. Each tested part is divided into 24 small segments as depicted in Figure 11.
5. Results and Analysis
Two sets of experiments are performed to evaluate the performance of the developed painted surface defect detection system. In the first study, small defect samples are used to verify the effectiveness of the deflectometry principle in detecting various defects. Once, the efficacy of the deflectometry principle is validated on these small samples; large parts are tested. Large parts have their own set of challenges in terms of size, sudden curvature change, throughput etc.
5.1. Small Test Samples Preliminary System Validation
Different type of surface defects such as dirt, cold sludge, fisheye, blister etc. occur during moulding or painting process. Small test samples bearing these defects are used to validate the effectiveness of the detection principle. Some of the sample parts are shown in Figure 12. These small parts are mounted on a tripod in front of pattern screen, as shown in Figure 13. The parts are placed 40 cm away from the camera, which captures the surface reflections. A set of seven sinusoidal fringe patterns with a phase shift of 2π/7 are generated to display on the LCD screen and then their reflections are captured. These surface reflections are analysed to reconstruct the surface profile. During this testing, the fringe projected area is manually segmented for deflectometry analysis. This process is depicted in Figure 14 and the results are tabulated in Table 1. Here, detection accuracy represents whether a defect is successfully detected by the developed system.
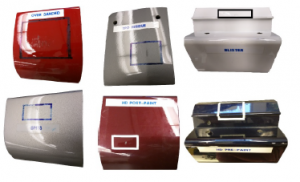
Figure 12: Some typical surface defect samples
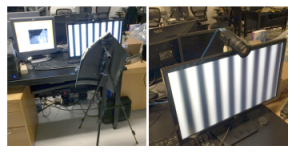
Figure 13: Camera with fringe pattern screen and test part on tripod Table 1: Small sample defect detection results
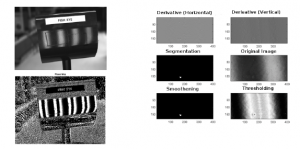
Figure 14: Fisheye defect detection
| Sr. | Defect | No. of | Detection |
| No. | Type | Samples | Accuracy |
| 1. | Dirt | 2 | 100% |
| 2. | Cold Slug | 4 | 75% |
| 3. | Spits | 1 | 100% |
| 4. | Fish Eye | 2 | 100% |
| 5. | Flash | 2 | 100% |
| 6. | Blister | 3 | 100% |
| 7. | TPO Protusion | 2 | 100% |
| 8. | Over Sanded | 3 | 100% |
| 9. | Hot Pre-paint | 1 | 100% |
| 10. | Overflame Torch | 2 | 100% |
| 11. | Water Spots | 1 | 100% |
| 12. | TPO Residue | 3 | 100% |
| 13. | Popping | 1 | 50% |
| 14. | HD Post Paint | 3 | 100% |
These results indicate that the developed system mostly detects the studied defects although some low detection performance is observed for cold slug and popping defects. Popping defects are salt-and-pepper noise like small defects that occur when the solvent or air trapped in paint film escapes during the drying process. This creates a lot of tiny defects clustered in a small area. A 50% popping defect detection accuracy indicates that approximately half of these tiny defects are detected, but it is enough to declare the part defective.
5.2. Large Parts Defect Detection
Following the experimental setup outlined in section 4, various large bumpers are tested by the developed system. The developed framework was successful in detecting most of the manufacturing as well as the artificially created defects. Some of these detection results are shown in Figure 15.
Results are reported in two tables. The segmentwise results are given in Table 2 while body part color based results are reported in Table 3. These results are reported in terms of recall, precision and F-measure. Equal weighting of recall and precision is considered for computing F-measure. These metrics are defined as follows:
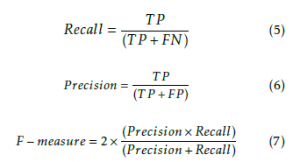
where TP is true positive, FP is false positive and FN is false negative. Ground truth data to compute these measures is provided by the part manufacturer.
By reviewing the results, we can deduce that the performance of the defect detection system varies depending on part colour and segment location. The performance of the algorithm is lower in segments 8, 9 and 10 where precision drops significantly to 0.46, 0.43 and 0.30, respectively. These segments contain highly curved sections which drastically distorts the projected pattern resulting in a higher number of FP. This can be improved by tuning the system differently on a per region basis to accommodate the different variations in surface curvature. The results by part colour show that the performance of the detection system is compromised on white parts. White surfaces reflect all light incident to it, so the algorithm becomes more sensitive to surrounding light. Besides, the contrast of the projected pattern is muted by white parts affecting the visibility of defects on the part surface. The combination of these factors reduces the accuracy of the algorithm on white parts.
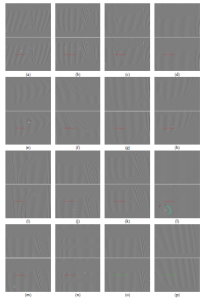
Figure 15: Some defect detection results on large bumpers First row: Gradient image, Second row: Detected defect ((o) is an example where defect is not detected as it is not enclosed by fringe region and (p) is an example of a defect free region)
Table 2: Defect detection results by segment
| Seg. | Samples | TP | FP | FN | Recall | Precision | F-measure |
| 1 | 10 | 6 | 4 | 0 | 1.00 | 0.60 | 0.75 |
| 2 | 10 | 0 | 0 | 0 | NA | NA | NA |
| 3 | 10 | 6 | 2 | 1 | 0.86 | 0.75 | 0.80 |
| 4 | 10 | 3 | 1 | 0 | 1.00 | 0.75 | 0.86 |
| 5 | 10 | 3 | 1 | 0 | 1.00 | 0.75 | 0.86 |
| 6 | 10 | 14 | 0 | 1 | 0.93 | 1.00 | 0.96 |
| 7 | 10 | 8 | 0 | 1 | 0.89 | 1.00 | 0.94 |
| 8 | 10 | 6 | 7 | 0 | 1.00 | 0.46 | 0.63 |
| 9 | 10 | 3 | 4 | 0 | 1.00 | 0.43 | 0.60 |
| 10 | 10 | 6 | 14 | 2 | 0.75 | 0.30 | 0.43 |
| 11 | 10 | 0 | 3 | 1 | 0.00 | 0.00 | NA |
| 12 | 10 | 2 | 0 | 0 | 1.00 | 1.00 | 1.00 |
| 13 | 10 | 2 | 0 | 0 | 1.00 | 1.00 | 1.00 |
| 14 | 10 | 4 | 0 | 0 | 1.00 | 1.00 | 1.00 |
| 15 | 10 | 3 | 0 | 0 | 1.00 | 1.00 | 1.00 |
| 16 | 10 | 3 | 0 | 0 | 1.00 | 1.00 | 1.00 |
| 17 | 10 | 0 | 0 | 2 | 0.00 | NA | NA |
| 18 | 10 | 1 | 0 | 0 | 1.00 | 1.00 | 1.00 |
| 19 | 10 | 2 | 1 | 0 | 1.00 | 0.67 | 0.80 |
| 20 | 10 | 3 | 2 | 1 | 0.75 | 0.60 | 0.67 |
| 21 | 10 | 0 | 0 | 0 | NA | NA | NA |
| 22 | 10 | 7 | 1 | 0 | 1.00 | 0.88 | 0.94 |
| 23 | 10 | 7 | 0 | 0 | 1.00 | 1.00 | 1.00 |
| 24 | 10 | 0 | 0 | 0 | NA | NA | NA |
Table 3: Defect detection results by color
| Part | Color | TP | FP | FN | Recall | Precision | F-measure |
| 1 | Black | 14 | 0 | 0 | 1.00 | 1.00 | 1.00 |
| 2 | Dark blue | 3 | 1 | 1 | 0.75 | 0.75 | 0.75 |
| 3 | Dark Blue | 6 | 1 | 0 | 1.00 | 0.86 | 0.92 |
| 4 | Dark silver | 9 | 2 | 2 | 0.82 | 0.82 | 0.82 |
| 5 | Dark blue | 0 | 1 | 1 | 0.00 | 0.00 | NA |
| 6 | Purple | 16 | 1 | 2 | 0.89 | 0.94 | 0.91 |
| 7 | Dark silver | 9 | 2 | 1 | 0.90 | 0.82 | 0.86 |
| 8 | White | 5 | 19 | 2 | 0.71 | 0.21 | 0.32 |
| 9 | White | 12 | 9 | 0 | 1.00 | 0.57 | 0.73 |
| 10 | Black | 15 | 4 | 0 | 1.00 | 0.80 | 0.89 |
6. Conclusion
A deflectometry based defect detection system is presented in this research paper. The developed system has successfully detected large and subtle defects on large painted automotive parts. The system analyses gradient variation in the measured phase for defect detection and does not require an existing dataset or pre-training for its functioning. The use of robotic arm lends it the capability to inspect varying surface geometries. The system examines the whole part by operating on individual segments. These defects are then aggregated to localize them on the full part.
The system successfully detected various manufacturing defects induced during moulding and painting processes on small test samples as well as on large automotive bumpers. For large bumper testing, additional algorithms are designed and used to extract the region of interest, as well as eliminate spurious defects detected due to edge effects and abrupt curvature changes. The algorithm processing takes approximately 0.35 seconds per segment, and this doesn’t include the time that it takes the robotic arm to move between segments.
It is noted that the implemented framework can only detect defects if they are enclosed by a fringe projected region from all sides. It is possible to use multiple cameras to reduce the number of segments and speed-up the inspection process. A colour fringe pattern could potentially be used to improve the system’s performance on light coloured parts. Use of a phase shifted coloured pattern can be explored as it will alleviate the requirement for a stationary partcamera/screen system by eliminating the need for multiple phase-shifted patterns.
- A. Tandiya, S. Akthar, M. Moussa, and C. Tarray, “Automotive semi-specular surface defect detection system,” in 2018 15th Conference on Computer and Robot Vision (CRV), May 2018, 285-291. DOI: 10.1109/CRV.2018.00047
- C. Fernandez, C. Platero, P. Campoy, and R. Aracil, “Vision system for on-line surface inspection in aluminum casting process,” in Proceedings of IECON ’93 – 19th Annual Conf. of IEEE Industrial Electronics, 15-19 Nov. 1993, 1854 – 1859. DOI: 10.1109/IECON.1993.339356
- Z. Liu, W. Wang, X. Zhang, and W. Jia, “Inspection of rail surface defects based on image processing,” CAR 2010 – 2010 2nd Int. Asia Conf. Informatics Control. Autom. Robot., vol. 1, pp. 472-475, 2010. DOI: 10.1109/CAR.2010.5456793
- Y.-G. Cen, R.-Z. Zhao, L.-H. Cen, L. Cui, Z. Miao, and Z. Wei, “Defect inspection for TFT-LCD images based on the lowrank matrix reconstruction,” Neurocomputing, vol. 149, 1206- 1215, 2015. DOI:10.1016/j.neucom.2014.09.007
- B. Liu, S. Wu, and S. Zou, “Automatic detection technology of surface defects on plastic products based on machine vision,” 2010 International Conf. on Mechanic Automation and Control Engineering, MACE2010, 2213 – 2216, 07 2010. DOI: 10.1109/MACE.2010.5536470
- J. Guo and W. Shao, “Automated detection of surface defects on sphere parts using laser and CDD measurements,” IECON 2011 – 37th Annu. Conf. IEEE Ind. Electron. Soc., pp. 2666-2671, 2011. DOI: 10.1109/IECON.2011.6119732
- S. Janardhana, J. Jaya, K. J. Sabareesaan, and J. George, “Computer aided inspection system for food products using machine vision A review,” 2013 Int. Conf. Curr. Trends Eng. Technol., pp. 29 – 33, 2013. DOI: 10.1109/ICCTET.2013.6675906
- P. M. Cho CS, Chung BM, “Development of real-time vision based fabric inspection system,” IEEE Trans. Ind. Electronics, vol. 52(4), 1073–9, 2005.
- S. V. der Jeught and J. J. Dirckx, “Real-time structured light profilometry: a review,” Optics and Lasers in Engineering, vol. 87, 18 – 31, 2016, Digital optical & Imaging methods in structural mechanics. https://doi.org/10.1016/j.optlaseng.2016.01.011
- D. Palouek, M. Omasta, D. Koutny, J. Bednar, T. Kouteck,and F. Dokoupil, “Effect of matte coating on 3D optical measurement accuracy,” Optical Materials, vol. 40, 02 2015. https://doi.org/10.1016/j.optmat.2014.11.020
- M. C. Knauer, J. Kaminski, and G. Hausler, “Phase measuring deflectometry: a new approach to measure specular free-form surfaces,” in Optical Metrology in Production Engineering, ser. procspie, W. Osten and M. Takeda, Eds., vol. 5457, 366-376, Sep. 2004. https://doi.org/10.1117/12.545704
- I. G. O. Kafri, “Moire deflectometry: A ray deflection approach to optical testing,” Optical Engineering, vol. 24, no. 6, 944 -960, 1985. [Online]. Available: https://doi.org/10.1117/12.7973607
- M. Servn, R. Rodriguez-Vera, M. Carpio, and A. Morales, “Automatic fringe detection algorithm used for Moire deflectometry,”Applied optics, vol. 29, 3266 – 70, 08 1990.
- B. Wang, X. Luo, T. Pfeifer, and H. Mischo, “Moire deflectometry based on Fourier-transform analysis,” Measurement,vol. 25, 24 – 253, 06 1999. https://doi.org/10.1016/ S0263-2241(99)00009-3
- A. E.-R. Ricardo Legarda-Senz, “Wavefront reconstruction using multiple directional derivatives and Fourier transform,” Optical Engineering, vol. 50, no. 4, 1 – 4 , 2011. [Online]. Available: https://doi.org/10.1117/1.3560540
- D. Fontani, F. Francini, D. Jafrancesco, L. Mercatelli, and P. Sansoni, “Mirror shape detection by ”Reflection Grating Moire Method” with optical design validation,” Proceedings of SPIE – The International Society for Optical Engineering 5856, Jun 2005. DOI: 10.1117/12.612114
- S.-W. K. Ho-Jae Lee, “Precision profile measurement of aspheric surfaces by improved Ronchi test,” Optical Engineering, vol. 38, no. 6, 1041 – 1047, 1999. [Online]. Available:https://doi.org/10.1117/1.602147
- G. P. Butel, G. A. Smith, and J. H. Burge, “Binary pattern deflectometry,” Appl. Opt., vol. 53, no. 5, 923 – 930, Feb 2014. [Online]. Available: http://ao.osa.org/abstract. cfm?URI=ao-53-5-923
- J. L. H. Willem D. van Amstel, Stefan M. B. Baumer, “Optical figure testing by scanning deflectometry,” Proc. SPIE 3739, Optical Fabrication and Testing, 6 September 1999. doi: 10.1117/12.360155, Available: https://doi.org/10.1117/ 12.369201
- S. Krey, W. D. van Amstel, K. Szwedowicz, J. Campos, A. Moreno, and E. J. Lous, “Fast optical scanning deflectometer for measuring the topography of large silicon wafers,” Proc. SPIE 5523, Current Developments in Lens Design and Optical Engineering V, 14 October 2004. doi: 10.1117/12.559702, https://doi.org/10.1117/12.559702
- K. Ishikawa, T. Takamura, M. Xiao, S. Takahashi, and K. Takamasu, “Profile measurement of aspheric surfaces using scanning deflectometry and rotating autocollimator with wide measuring range,” Measurement Science and Technolog, vol. 25, no. 6, Apr 2014. [Online]. Available: https://doi. org/10.1088%2F0957-0233%2F25%2F6%2F064008
- Y. Tang, X. Su, Y. Liu, and H. Jing, “3D shape measurement of the aspheric mirror by advanced phase measuring deflectometry,” Opt. Express, vol. 16, no. 19, 15090 – 15096, Sep 2008. [Online]. Available: http://www.opticsexpress.org/ abstract.cfm?URI=oe-16-19-15090
- D. Malacara, Optical Shop Testing (Wiley Series in Pure and Applied Optics), Wiley-Interscience, 2007.
- A. V. Maldonado, P. Su, and J. H. Burge, “Development of a portable deflectometry system for high spatial resolution surface measurements,” Appl. Opt., vol. 53, no. 18, 4023 – 4032, Jun 2014. https://doi.org/10.1364/AO.53.004023
- C. Horneber, M. Knauer, and G. Husler, “Phase measuring deflectometry – a new method to measure reflecting surfaces,” Annual Report Optik, 01 2000.
- J. Xiao, X.Wei, Z. Lu,W. Yu, and H.Wu, “A review of available methods for surface shape measurement of solar concentrator in solar thermal power applications,” Renewable and Sustainable Energy Reviews, vol. 16, no. 5, 2539 – 2544, 2012. https://doi.org/10.1016/j.rser.2012.01.063
- C. E. Andraka, S. Sadlon, B. Myer, K. Trapeznikov, and C. Liebner, “Rapid reflective facet characterization using fringe reflection techniques,” Proceedings of the Energy Sustainability, 19 – 23, 2009. DOI: 10.1115/1.4024250
- C. Devivier, F. Pierron, and M. Wisnom, “Damage detection in composite materials using deflectometry, a full-field slope measurement technique,” Composites Part A: Applied Science and Manufacturing, vol. 43, no. 10, 1650 – 1666, 2012. https://doi.org/10.1016/j.compositesa.2011.11.009
- J. Geng, “Structured-light 3D surface imaging: a tutorial,” Adv. Opt. Photon., vol. 3, no. 2, 128–160, Jun 2011. https: //doi.org/10.1364/AOP.3.000128
- M. Kujawinska and J. Wjciak, “High accuracy Fourier transform fringe pattern analysis,” Optics and Lasers in Engineering,vol. 14, no. 4, 325 – 339, 1991. https://doi.org/10.1016/0143-8166(91)90056-Y
- M. Takeda, H. Ina, and S. Kobayashi, “Fourier-transform method of fringe-pattern analysis for computer-based topography and interferometry,” J. Opt. Soc. Am., vol. 72, no. 1, 156- 160, Jan 1982. https://doi.org/10.1364/JOSA.72.000156
- L. Armesto, J. Tornero, A. Herraez, and J. Asensio, “Inspection system based on artificial vision for paint defects detection on cars bodies,” in Robotics and Automation (ICRA), 2011 IEEE International Conference on, 1–4, 9-13 May 2011. DOI: 10.1109/ICRA.2011.5980570
- C. Tarry, M. Stachowsky, and M. Moussa, “Robust detection of paint defects in moulded plastic parts,” Proc. – Conf. Comput. Robot Vision, CRV 2014, 306–312, 2014. DOI: 10.1109/CRV.2014.48
- T. Liu, C. Zhou, Y. Liu, S. Si, and Z. Lei, “Deflectometry for phase retrieval using a composite fringe,” Optica Applicata, vol. 44, no. 3, 451 – 461, 2014. DOI: 10.5277/oa140309
- Y. Surrel, “Deflectometry: A simple and efficient noninterferometric method for slope measurement,” Xth SEM Int. Congr. Exp. Mech., 2004.
- K. Hibino, B. F. Oreb, D. I. Farrant, and K. G. Larkin, “Phase shifting for nonsinusoidal waveforms with phase-shift errors,” J. Opt. Soc. Am. A, vol. 12, no. 4, p. 761, 1995. https: //doi.org/10.1364/JOSAA.12.000761
- E. Stoykova, J. Harizanova, and V. Sainov, “Pattern Projection Profilometry for 3D Coordinates Measurement of Dynamic Scenes,” Three-Dimensional Telev., pp. 85–164, 2008. DOI: 10.1007/978-3-540-72532-9_5
No related articles were found.