Graph-based Clustering Algorithms – A Review on Novel Approaches

Adv. Sci. Technol. Eng. Syst. J. 6(4), 21–28 (2021);
 DOI: 10.25046/aj060403
Classical clustering algorithms often require an a-priori number of expected clusters and the presence of all documents beforehand. From practical point of view, the use of these algorithms especially in more dynamic environments dealing with growing or shrinking corpora therefore is not applicable. Within the last years, graph-based representations of knowledge such as co-occurrence graphs of document corpora have gained attention from the scientific community. Accordingly, novel unsupervised and graph-based algorithms have been recently developed in order to group similar topics, represented by documents or terms, in clusters. The conducted work compares classical and novel graph-based algorithms, showing that classical clustering algorithms in general perform faster than graph-based clustering algorithms. Thus, the authors’ focus is to show that the graph-based algorithms provide similar clustering results without requiring an hyperparamter k to be determined a-priori. It can be observed that the identified clusters exhibit an associative relationship reflecting the topical and sub-topical orientation. In addition, it is shown in a more in-depth investigation that the Seqclu (sequential clustering algorithm) can be optimized performance-wise without loss of clustering quality.
1. Introduction
images or text documents, in the same cluster in an unsupervised manner. In contrast to supervised classification, where the algorithm has been trained how to map its input to an according output, cluster- ing only uses the provided input data and tries to find the best group- ing of objects based on that information. Due to the sheer amount different data-types and according use-cases, dozens of architectural concepts, such as hierarchical, partitioning or graph-based cluster- ing have been developed over the last decades[1]. Many of the classical, typically vector-based algorithms, such as the k-means[2], k-means++[3] or k-NN[4] algorithm come with the requirement of choosing the hyperparameter k, as the suggested number of ex- pected clusters, a priori. This forces the user to estimate beforehand what number of result clusters are expected. This approach there- fore softens the idea of an unsupervised algorithm providing the best possible result fully automatically, without user intervention. In addition, actual standard algorithms mentioned above, but also newer graph-based algorithms, e.g. Chinese Whispers[5] expose another weakness: they typically require a full set of documents beforehand and are not designed to adapt a growing or shrinking
having a long list of search results on a user’s query the knowledge, that lies within the available document corpus, can be presented much more easily[6]. With the work of [7], [8] it is shown that the use of co-occurrence graphs is very useful for graph-based concepts on which novel clustering techniques can be built on. Recent work on graph-based clustering algorithms[9], [10] provide novel ap- proaches in the field of clustering. This paper gives a comparison of these graph-based algorithms and shows their benefits over classical approaches, as well as requirements for further optimization.
2. Materials and methods
2.1 Classical clustering algorithms
- K-means, K-means++, Mini Batch
Due to its simplicity the k-means algorithm and its variants are the most prominent representatives of vector based clustering algo- rithms used. As k-means assigns each input data point to exactly one cluster it is considered as a classical hard-clustering algorithm.
The computational complexity, which is linearly proportional to the size of datasets, makes the k-means algorithm efficiently applica- ble even to larger datasets. Because each data point is represented numerically, the application field for k-means is wide: It can be used from document clustering up to other use cases, e.g. customer segmentation [11] or cyber-profiling criminals [12].
The general idea of the algorithm is partitioning the given data into k distinct clusters by iteratively updating the cluster centers and cluster associated data points. The k-means algorithm mainly per- forms two steps: Firstly, the user has to define manually the value k, which determines how many clusters should be a result of k-means. Secondly, a loop of two repeating steps of assigning the data set points to one of the clusters with lowest distance to the cluster’s centroid and the calculation of a new centroid for each cluster is performed. Mathematically it can be said that the k-means is an optimization problem where the objective function that is employed is the Sum of Squared Errors (SSE). During the assignment and up- date steps the k-means algorithm tries to minimize the SSE score for the set of clusters. A more detailed overview on the mathematical implications and technical origins can be found at [13].
Due to its impact on the clustering result the distance measure has to be chosen carefully. In general, the most popular choice for estimating the closest centroid to each of the datapoints is the Euclidean distance. Other distance measures, such as the Manhattan distance or cosine similarity can also be used [13]. The k-means algorithm comes with two major disadvantages:
- choosing the initial cluster centers
- estimating the k-value.
The clustering result of k-means highly depends on the initial- ization of the cluster centers [14]. In order to optimize the results provided by k-means especially the initialization of the cluster cen- ters has been subject of research over the years and lead to several approaches [15]–[16]. In contrast to the classical k-means algorithm as described in [2], the k-means++ more carefully determines the initial cluster centers and subsequently uses a weighted probability score to improve the finding of cluster centers over time.
Estimating the k-value and therefore the number of output clusters k a priori also is a big disadvantage in contrast to fully unsupervised clustering algorithms. From the practical point of view this would require the user to estimate a good k value before actual clustering can be performed. Especially in cases where the input data are very large or growing over time the manual selection of k is therefore not applicable.
Several approaches such as the Silhouette Coefficient [17] or Calinski–Harabasz Index [18] can be used to suggest the k-value automatically. In addition to the above-mentioned improvements, other algorithms like the Mini-batch k-means or fast k-means [19],
[20] aim to improve the scalability and performance of k-means for large datasets such as web applications. In case of the mini-batch k-means algorithm small random batches of data are chosen and assign each of the sample points to a centroid. In a second step the cluster centroid is then updated based on the streaming average of all of the previous samples assigned to that centroid.
- Chinese Whispers
The Chinese Whispers (CW) algorithm [5] is a randomized graph- based hard-clustering algorithm. Due to its simplicity and linear time properties, it performs very fast even for larger datasets. As it does not require a preliminary k-value it can be considered as an unsupervised clustering algorithm. The type of graph on which the CW algorithm is applied can be weighted, unweighted, undirected or directed. The CW is there-fore applicable to a wide range of use cases in natural language processing such as language separation or word sense disambiguation. The CW algorithm works in a bottom- up manner by first setting a random class label for each node of the graph and then merging class labels with those local neighborhood classes with the biggest sum of edge weights. In case of multiple winning classes, one is chosen randomly. Over time regions of the same class will stabilize and grow till they connect to another class region.
As shown in [5], CW scales are very well even for large datasets in linear time. It is also shown that the clustering quality is compara- ble to standard algorithms using the vector space model. As the CW algorithm has randomized properties its output changes on each run of the algorithm. This makes it hard for practical applications where the data change over time or in cases where the clustering process has to be repeated for the same data. Another disadvantage of the CW algorithm is its tendency of forming a large amount of often very small clusters. In order to extract the dominant clusters, e.g. to obtain an overview of related topics for each cluster, filtering is required which may result in unwanted information loss.
2.2 Novel graph-based clustering algorithms
- Dynamic clustering for segregation of co-occurrence graphs (DCSG)
The DCSG [10] algorithm is a novel clustering algorithm inspired by the human’s brain learning process. As the human brain devel- ops from child to adulthood it continuously learns new words and categorizes them forming the entire knowledge of the human being. Transferring this method to the concept of co-occurrence graphs, clustering can be applied in order to identify topical related regions (clusters) formed by the terms within the graph. DCSG imitates the learning process by reading each document on sentence base while building up the co-occurrence graph. The nodes represent the terms, edges the relation of the words. While adding each term to the co-occurrence graph clustering is applied by measuring the distance between each new term and its distance to the existing clus- ter centers. The distance between two terms is determined by the inverse of the DICE-coefficient [21], [22]. The cluster center itself is represented by its centroid term as defined in [23], [24]. A cluster center is formed by the node with the shortest average distance ∆d to every other node in the co-occurrence graph. In addition, the standard deviation µ is determined. Based on this information the cluster range rclusteri is defined as
![]()
and is used to determine which term belongs to which cluster. While processing new terms two major steps are performed
1. Insertion of terms
New terms will be added to the graph as nodes and edges to the according co-occurrent terms. If a term is already existing the related connections will be updated.
2. Clustering
Each term tnew will be merged into existing clusters if the distance tnew ∆d + 3µ. In case that tnew > ∆d + 3µ a new cluster will be created. In addition, the algorithm will check if due to the insertion any relations may have changed in order to update the cluster centers correctly.
Adding a new term that already exists in the graph will result in a change of the relation weights and cluster centers may change. In this case ∆d +3µ will also change. The membership of the according terms with that cluster therefore needs to be re-evaluated in case of exceeding the distance threshold might be moved to different clusters.
DCSG is a novel brain inspired algorithm that works in contrast to the classical approaches like k-means on dynamic data growing over time. As presented in the results on clustering text data show that this knowledge can be represented very well. Due to the high amount of recalculation steps, especially when the cluster centers move frequently, having a large amount of initial input data the DCSG algorithm will perform very slow. If the data is growing over time, just similar to the human brain’s learning process, this disadvantage will be compensated as the graph will converge over time and recalculations will decrease.
- Sequential Clustering using Centroid Terms (SeqClu)
The SeqClu-algorithm [9] is a co-occurrence graph-based hard- clustering algorithm that is capable of clustering documents in a sequential manner using the concept of centroid terms as described in [22]–[24].
In contrast to many of the standard clustering algorithms it does not require an a-priori definition of the number of clusters. As the algorithm works sequentially a set of feature vectors F of documents is processed incrementally at once or just as they appear over time. SeqClu is therefore applicable in cases where the input vector might change over time such as in a Web-Engine, where documents appear or disappear over time.
The general idea of the algorithm is to compare each new feature vector f (a document) against an existing set of clusters containing previously clustered documents. For each existing cluster the algo- rithm considers the membership of a new document by a distance determination process. If a closest cluster can be found without exceeding a certain threshold the document will join the accord- ing cluster. If not, a new cluster will be formed by the document extending the cluster model.
There are mainly three crucial parts that influence the behaviour of the algorithm:
- initialization,
- cluster membership value and
- threshold of membership (winning cluster determination).
The initialization can be performed in various ways and influ- ences the quality of clustering result. If a set of one or more clusters are predefined it will be used as a reference for all further arriving documents to be clustered. The simplest initialization would be using a single cluster having a randomly chosen document as the first cluster. In combination with an inaccurately chosen member- ship threshold this approach most likely will tend to merge new documents, especially a low number of documents, into the initial cluster and imprecise the overall clustering result. Instead, it is suggested to form at least two initial clusters formed by the most distant documents (antipodean documents) existing. This requires an additional preprocessing step as for each of the initially existing documents the distance between each of the documents centroid must be determined. It is known that the co-occurrence graph will converge at about 100 documents and the process of distance deter- mination can be very time consuming as the conducted experiments show. It is therefore suggested to consider only 2 to 100 randomly chosen documents and is also suspect of the experiments in this publication.
In order to determine a document’s cluster membership each newly arriving document needs to be matched against the existing clusters. For this purpose, the average distance between the new documents centroid and all existing documents in each of the clus- ters is determined by using Dijkstra’s shortest path algorithm. In order to speed-up the calculation process all previous path calcu- lations are cached having a linear time complexly for reoccurring path determinations.
Regarding the judgement whether a document shall be merged into an existing or form a novel cluster, a threshold is required. As the threshold determination process directly influences the cluster- ing result it must be chosen very carefully. To avoid having the user to choose this threshold manually, it is chosen dynamically for each of the clusters using the local connections between the cluster’s centroid and its nearest neighbors. In order to reduce the amount of computation time, only neighbors within a certain radius are considered using a breadth-first search with limited depth.
As first experiments have shown the SeqClu-Algorithm is able to cluster documents unsupervised in a sequential manner providing good results without performing any optimization regarding the pro- cess of threshold determination. The initial step of finding the two initial clusters, especially having a large initial set of documents, is very time consuming. On the other hand, the calculation results of the initialization phase can be reused for the clustering process itself having a lookup table. In this case the disadvantage of slow initialization becomes an advantage for the clustering process itself and will speed-up this phase of the algorithm, which will be shown in the experiments conducted in this publication.
2.3 Conceptual differences of tested algorithms
Table 1 provides an overview over the six tested algorithms from conceptual point of view. All algorithms work with different re- quirements for initialization and are applicable to different use cases. In general, the classical algorithms are flexible regarding the type of input data, which can be numerical or textual data. From the user point of view the biggest disadvantage is the requirement to provide the number of output clusters (k-value) a-priori. Therefore, user intervention is required in order to update the suggested number of output clusters or the use of additional algorithms that determine the k-value automatically. The classical algorithms are therefore especially inflexible in cases, where the corpus size changes over time. In contrast, the graph-based algorithms fully run unsupervised and therefore do not require any further change in initialization
each tagged by the author with their respective text category and therefore can be used as a gold standard in order to evaluate whether a document has been clustered correctly or not. Table 2 shows the parametrizations that were used for the individual algorithms even if the corpus grows or shrinks. From clustering point of view the algorithm will adapt and provide automatically an according number of output clusters.
Table 1: Conceptual differences of tested algorithms
| Algorithm | Type | Supervised/ unsupervised | A-priori no. of clusters | Growing corpora |
| K-means | vector-based | supervised | k-value | no |
| K-means++ | vector-based | supervised | k-value | no |
| Minibatch | vector-based | supervised | k-value | no |
| CW | graph-based | unsupervised | none | no |
| SeqClu | graph-based | unsupervised | none | yes |
| DCSG | graph-based | unsupervised | none | yes |
3. Results and discussion
3.1 Setup of experiments
For the conducted experiments, natural language preprocessing in form of sentence extraction, stop word removal and baseform reduc- tion has been applied to all of the used documents. The according output was used as standardized input for all algorithms tested. In addition, the co-occurrence graph G has been built on sentence- based co-occurrences measuring the distance between terms by the reciprocal significance value. The significance value itself is deter- mined using the DICE-coefficient. All small sub-graphs from the original co-occurrence graph have been removed finding the largest connected sub-graph within G in order to obtain a consistent single graph G. The graph is stored in an embedded graph database using Neo4j [25] where each node represents a term and the edges are an- notated with their significance and respective distance value. As the vector-based algorithms don’t use a co-occurrence graph the TF-IDF
[26] matrix was created based on the documents term-vector, which was extracted during natural preprocessing. The implementation of k-means, k-means++ and mini-batch were realized by using the python-based machine learning programming library scikit-learn version 0.23. The Chinese Whispers algorithm was taken from the ASV Toolbox [27] from the university of Leipzig and is written in Java. SeqClu and DCSG algorithms were both implemented using the Java programming language. All experiments have been performed on ten workstations with identical hardware specs.: Intel Core i7-7700K CPU @ 4.20GHz and 16 GB Memory
3.2 Used corpora and parametrizations
The conducted experiments were performed over corpora consisting of 40,60,. . . ,260,280 documents and for each corpus the tested algo- rithms did run 100 times in order to obtain statistical relevant results. The corpora each contained a random number of equally distributed documents of the categories politics, cars, money and sports of the German newspaper ”Der Spiegel”. The documents themselves were
Algorithm Parametrization
K-means, K-means++ Number of output clusters (k-value): 4
Initial cluster center: random Number of iterations: 100
Minibatch Identical to K-means Batchsize: 100
Number of samples (init): (3 ∗ batchsize)
CW Number of iterations: 100 Mutation rate: 0.0
DCSG No initialisation required
SecClu Initialisation: antipodean documents Dynamic threshold
3.3 Clustering Quality
Evaluating different clustering algorithms is difficult. Commonly used external evaluation measures, e.g. the f-measure or rand index, penalize false positive and false negative decisions. If the number of output clusters exceeds the number of classes it will result in a quality trade-off. Especially the tested graph-based clustering algo- rithms don’t require a pre-defined k-value and break this condition by exceeding the number of output clusters. In order to limit the ef- fect of quality trade-off the purity is preferred over other evaluation measures as it does not penalize if the number of output clusters is bigger than the number of class labels. The purity was calculated for each of the tested corpora and algorithms by C = c1, c2, , ck and M = m1, m2, , mj as the set of classes. For each cluster ck we determined the class mj with the most mem- bers nk, j in ck and then subsequently nk, j is summed up and divided by N.
Figure 1 shows the total average purity of all algorithms. The classical algorithms like k-means reside within a range of 0.7 to 0.8 exhibiting a good purity value. The graph-based algorithms, even with lower purity values, still are close having average values between 0.6 to 0.7.
It can be observed from Table 3 that for the standard algorithms the purity in average is almost constant and independent of the number of clustered documents.
The graph-based algorithms SeqClu and DCSG show, that their purity values increase in quality at about 100 to 160 documents per corpus. For SeqClu this behavior reflects that the co-occurrence graph converges at about 100 documents. Each additionally added document causes lesser changes to the co-occurrence graph resulting in lesser changing centroid terms, that are used by this clustering algorithm for cluster determination. The DCSG also shows this tendency as the knowledge of the graph that is used for clustering also improves over time and stabilizes.
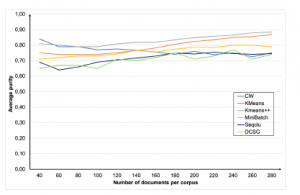
Figure 1: Comparison of average purity for different corpora sizes
Table 3: Average purity for each of the tested algorithms
| # of doc. | K-Means | K-Means++ | Minibatch | CW | SeqClu | DCSG |
| 40 | 0.75 | 0.81 | 0.71 | 0.84 | 0.69 | 0.65 |
| 60 | 0.74 | 0.80 | 0.72 | 0.79 | 0.64 | 0.67 |
| 80 | 0.74 | 0.79 | 0.73 | 0.79 | 0.66 | 0.67 |
| 100 | 0.74 | 0.79 | 0.73 | 0.77 | 0.69 | 0.65 |
| 120 | 0.75 | 0.81 | 0.74 | 0.78 | 0.70 | 0.71 |
| 140 | 0.76 | 0.82 | 0.77 | 0.77 | 0.72 | 0.70 |
| 160 | 0.78 | 0.82 | 0.75 | 0.76 | 0.73 | 0.72 |
| 180 | 0.81 | 0.83 | 0.77 | 0.74 | 0.75 | 0.75 |
| 200 | 0.81 | 0.85 | 0.79 | 0.76 | 0.74 | 0.71 |
| 220 | 0.83 | 0.86 | 0.79 | 0.74 | 0.75 | 0.73 |
| 240 | 0.85 | 0.87 | 0.80 | 0.75 | 0.75 | 0.77 |
| 260 | 0.85 | 0.88 | 0.80 | 0.72 | 0.74 | 0.71 |
| 280 | 0.87 | 0.88 | 0.79 | 0.75 | 0.75 | 0.74 |
| Avg. total | 0.79 | 0.83 | 0.76 | 0.77 | 0.72 | 0.71 |
3.4 Cluster-sizes and number of clusters
As the purity can be influenced by having a large number of clusters
– in worst case one cluster per document – it is required to take a closer look at the number of clusters and documents per cluster. This effect mainly has an effect to the graph-based algorithms as they expose in contrast to the standard algorithm (k = 4) a larger number of output clusters. As the SeqClu algorithm is in the authors focus of research the investigations were focused on this algorithm and resulted in the following two main observations:
- The average cluster size in average is almost constant between 4 and 5 documents per cluster and
- the number of clusters is slowly increasing from 20 to 50 for the tested cluster sizes from 40 to 280
In general, it can be concluded that the knowledge growth at this point seems to be not converged or the parametrization needs to be finer grained, as all the tests were using standard parametrization. In order to reveal possible indicators and starting-points for further optimization, the tested corpora were manually examined regarding the clustering result and the individual correctness of the clusters, even if the gold standard suggested number of output clusters is exceeded.
After examination the following commonly occurring observa- tions have been made for the major number of tested corpora:
1. Homogenous Clusters
Homogenous Clusters are found 4 to 5 times in average, hav- ing 10-20 documents with 100 percent accuracy and reflect an actual topic the documents focus on. Those clusters contain exactly one category and in addition, the topical relatedness within that category is identifiable. For example, a cluster of category “sports” can be clearly related to the topic formula 1 racing by the document centroids (number of occurrences in brackets): Season (3), Schumacher (8), Race (5)
2. Heterogeneous Clusters
Heterogeneous Clusters occur in 1 to 2 clusters at a size of 10-20 documents of mainly two mixed topics. It could be observed that in some cases the centroid term that mainly influences the categorization of a document is generic. For example, terms like Euro, Zahl or Percent are very hard to map to a certain category. The according document could be related to Money, Politics or even Sports. In general, it seems difficult to identify the main scope of a cluster automatically for heterogeneous but also homogenous clusters. An accord- ing algorithm must be able to identify the topic and in case of having a heterogeneous cluster, differentiate between the mixed topics, which could occur on term level, which is focus on further research.
3. Border Clusters
Border clusters occur at a varying number of times, depend- ing on the topics within the corpus. These cluster types have an average size of 5-6 documents dominated by exactly one topic, but also having a single document of a different topic within. For example, the cluster may contain the centroid terms War(2), Irak(2), USA(1) of category politics, but one document with centroid Beginning . The politic topic (War, Irak, USA) can be clearly identified as the main topic for this cluster. In this example the document with the centroid Be- ginning cannot be accurately assigned to a single topic. The actual document refers to the beginning of a voting process regarding enrolment fees at the beginning of the semester. As the term Beginning also makes sense if related to the begin- ning of war between US and Irak the cluster has its border to a different topic marked by this term. Border clusters are interesting due to the fact that they mark the border between somehow topical related areas in the graph. This might be used e.g. within a search engine to lead the searching user to adjacent fields of knowledge.
4. Single document clusters
Single document clusters are clusters formed by single doc- uments that could not be assigned to any other cluster by exceeding the dynamic threshold used in SeqClu. In very early steps there might be not as many clusters with clearly defined topics that could lead into the creation of these new clusters. As SeqClu is a single linkage algorithm it is prone to outliers. Further research in order to mitigate this problem has to be done in future work, e.g. by merging the single document cluster with a larger cluster within a short distance.
Putting things together it can be concluded that the graph-based clustering algorithm performs very well regarding purity. As the number of output clusters is greater than the gold standard suggests, the differentiation of different topics is much closer to real world applications. In contrast, the standard algorithms gain a high pu- rity. But when manually evaluating the clustering results topical differences are not detected.
3.5 Pure clustering performance
Figure 2 shows the pure execution time of clustering different corpus sizes for all standard and graph-based clustering algorithms, except DCSG.
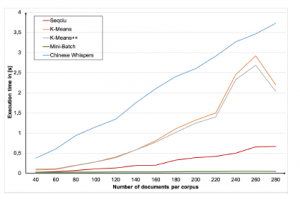
Figure 2: Pure execution time for clustering
In general, it can be concluded that the Minibatch algorithm performance is outstanding in comparison to the other algorithms even for larger corpora. As the Minibatch algorithm is designed especially for larger datasets, it is not surprising that it performs that well and faster than k-means and k-means++.
The graph-based SeqClu algorithm shows a linear increasing execution time for the pure clustering. It is also very fast in compari- son of the other algorithms as it benefits from a caching mechanism of shortest path calculations that is used during the initial cluster initialization.
Figure 3 shows the overall execution time including all prelimi- nary initializations for DCSG and SeqClu. In case of SeqClu and DCSG require, due to their focus on non-real-time applications and their heavy use of graph-based distance calculations, additional computations while clustering or during initialization. In case of the DCSG algorithm, that works on a sentence-based manner, a huge amount of distance determinations has to be performed which results in a high computation time of up to approx. 17 hours on 280 documents. As the scope of DCSG is not to be tremendously fast but trying to find an accurate representation of knowledge this performance drawback is not essential for the entire quality of the algorithm. Further investigations are beyond scope of the authors work and therefore not subject of this paper. SecClu’s execution time in comparison to DCSG is about 2 hours in case of 280 documents. It is mainly influenced by the calculation of the nearest neighbors and number of documents used during the determination of initial clusters (antipodean documents). Especially the determination of antipodean documents leaves space for improvements.
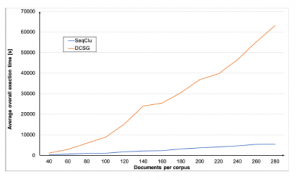
Figure 3: Execution time SeqClu and DCSG (initialization and clustering)
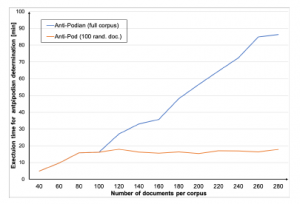
Figure 4: Execution times for initialization of SeqClu and SeqClu-100
The conducted experiments therefore have been performed by comparing the execution time for SeqClu using all available docu- ments during initialization versus SeqClu-100, using only the first up to 100 randomly chosen available documents instead. It can be concluded (see Figure 4) that depending on the corpus size up to approx. 70 minutes of computational time could be saved for the tested corpora using SeqClu-100.
It is expected that co-occurrence graph converges at about 100 documents and can be considered as stable. When using 100 ini- tial documents – even if randomly – chosen, the graph therefore is considered as stable and side-effects, e.g. on clustering quality should be negligible. Therefore, the purity has been also determined (Figure 5) concluding that there is no overall negative impact of using only 100 random documents for finding the two initial clusters on clustering quality.
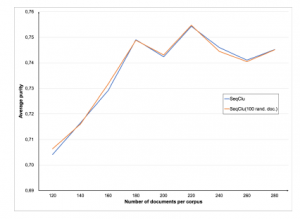
Figure 5: Comparison of purity for SeqClu and SeqClu-100
Further experiments also showed that the average cluster-sizes and number of output clusters do not change significantly and limit- ing the initialization of SeqClu to 100 documents is a performance enhancement which is reflected by having a better overall perfor- mance.
4. Conclusions
The provided work compares novel graph-based clustering algo- rithms against well-known vector-based algorithms. All algorithms were investigated regarding their clustering quality and general performance. The results show that the vector-based algorithms gen- erally perform at a higher speed in contrast to the examined graph- based clustering algorithms. In contrast, the classical approaches such as the k-means algorithm forces the user’s intervention a-priori, which limits the use cases where the user is able to investigate into the input data before actually clustering is applied. In contrast, the graph-based clustering algorithms show that a good categorization without the preliminary of a k-value requirement is possible. In addition, it can be concluded that graph-based clustering provides the property of having an associative representation – similar to the human brain – of the clustered data. A topical differentiation between individual topics subtopic is therefore much closer to the actual way of thinking of the user in contrast to classical approaches. The in-depth investigation into SeqClu’s clustering structure and relations between the result clusters gained in further starting-points for optimization. Additionally, it was shown by limiting the number of documents during initialization that the performance of SeqClu can be significantly improved without negative impact on the overall clustering quality.
- V. Estivill-Castro, “Why So Many Clustering Algorithms: A Position Paper,” SIGKDD Explor. Newsl., 4(1), 65–75, 2002, doi:10.1145/568574.568575.
- J. MacQueen, “Some methods for classification and analysis of multivariate observations,” in Proceedings of the Fifth Berkeley Symposium on Mathematical Statistics and Probability, Volume 1: Statistics, 281–297, University of California Press, Berkeley, Calif., 1967.
- D. Arthur, S. Vassilvitskii, “K-means++: The Advantages of Careful Seeding,” in Proceedings of the Eighteenth Annual ACM-SIAM Symposium on Discrete Algorithms, SODA ’07, 1027–1035, Society for Industrial and Applied Mathematics, Philadelphia, PA, USA, 2007.
- N. S. Altman, “An Introduction to Kernel and Nearest-Neighbor Nonparametric Regression,” The American Statistician, 46(3), 175–185, 1992, doi: 10.1080/00031305.1992.10475879.
- C. Biemann, “Chinese Whispers: An Efficient Graph Clustering Algorithm and Its Application to Natural Language Processing Problems,” in Proceedings of the First Workshop on Graph Based Methods for Natural Language Processing, TextGraphs-1, 73–80, Association for Computational Linguistics, Stroudsburg, PA, USA, 2006.
- M. Christen, et al., YaCy: Dezentrale Websuche, Online Documentation on http://yacy.de/de/Philosophie.html, 2017.
- M. Kubek, Dezentrale, kontextbasierte Steuerung der Suche im Internet, Ph.D. thesis, Hagen, 2012.
- M. Kubek, Concepts and Methods for a Libarian of the Web, FernUniversita¨t in Hagen, 2018.
- M. Hloch, M. Kubek, “Sequential Clustering using Centroid Terms,” in Autonomous Systems 2019: An Almanac, 72–88, VDI, 2019.
- S. Simcharoen, H. Unger, “Dynamic Clustering for Segregation of Co-Occurrence graphs,” in Autonomous Systems 2019: An Almanac, 53–71, VDI, 2019.
- M. Bacila, R. Adrian, M. Ioan, “Prepaid Telecom Customer Segmentation Using the K-Mean Algorithm,” Analele Universitatii din Oradea, XXI, 1112– 1118, 2012.
- M. Zulfadhilah, Y. Prayudi, I. Riadi, “Cyber Profiling using Log Analysis and K-Means Clustering A Case Study Higher Education in Indonesia,” International Journal of Advanced Computer Science and Applications, 7, 2016, doi:10.14569/IJACSA.2016.070759.
- C. Aggarwal, C. Reddy, DATA CLUSTERING Algorithms and Applications, 2013.
- J. Pena, J. Lozano, P. Larranaga, “An Empirical Comparison of Four Initialization Methods for the K-Means Algorithm,” 1999.
- E. Forgy, “Cluster Analysis of Multivariate Data: Efficiency versus Interpretability of Classification,” Biometrics, 21(3), 768–769, 1965.
- S. Khan, A. Ahmad, “Cluster center initialization algorithm for K-means clustering,” Pattern Recognition Letters, 25, 1293–1302, 2004, doi:10.1016/j.patrec. 2004.04.007.
- L. Kaufman, P. Rousseeuw, “Finding Groups in Data: An Introduction to Cluster Analysis,” 1990.
- T. Calin´ski, H. JA, “A Dendrite Method for Cluster Analysis,” Communications in Statistics – Theory and Methods, 3, 1–27, 1974, doi:10.1080/ 03610927408827101.
- D. Sculley, “Web-Scale k-Means Clustering,” in Proceedings of the 19th International Conference on World Wide Web, WWW ’10, 1177–1178, Association for Computing Machinery, New York, NY, USA, 2010, doi: 10.1145/1772690.1772862.
- A. Feizollah, N. Anuar, R. Salleh, F. Amalina, “Comparative Study of K-means and Mini Batch K- means Clustering Algorithms in Android Malware Detection Using Network Traffic Analysis,” 2014, doi:10.1109/ISBAST.2014.7013120.
- L. R. Dice, “Measures of the Amount of Ecologic Association Between Species,” Ecology, 26(3), 297–302, 1945, doi:10.2307/1932409.
- M. Kubek, T. Bohme, H. Unger, “Empiric Experiments with Text Representing Centroids,” in 6th International Conference on Software and Information
Engineering (ICSIE 2017), 2017. - M. Kubek, H. Unger, “Centroid Terms and their Use in Natural Language Processing,” in Autonomous Systems 2016, VDI-Verlag Du¨sseldorf, 2016.
- M. Kubek, H. Unger, “Centroid Terms As Text Representatives,” in Proceedings of the 2016 ACM Symposium on Document Engineering, DocEng ’16, 99–102, ACM, New York, NY, USA, 2016, doi:10.1145/2960811.2967150.
- A. Vukotic, N. Watt, T. Abedrabbo, D. Fox, J. Partner, Neo4j in Action, Man- ning, 2015.
- G. Salton, A. Wong, C. S. Yang, “A Vector Space Model for Automatic Indexing,” Commun. ACM, 18(11), 613–620, 1975, doi:10.1145/361219.361220.
- C. Biemann, U. Quasthoff, G. Heyer, F. Holz, “ASV Toolbox: a Modular Collection of Language Exploration Tools,” in Proceedings of the Sixth International Conference on Language Resources and Evaluation (LREC’08), European Language Resources Association (ELRA), Marrakech, Morocco, 2008.
No related articles were found.