Personalized Clinical Treatment Selection Using Genetic Algorithm and Analytic Hierarchy Process
 , Ilya Davydovych, Olena Petrunina, Olga Averianova, Le Dai Zyonh
Adv. Sci. Technol. Eng. Syst. J. 6(4), 406–413 (2021);
 DOI: 10.25046/aj060446
The development of Machine Learning methods and approaches offers enormous growth opportunities in the Healthcare field. One of the most exciting challenges in this field is the automation of clinical treatment selection for patient state optimization. Using necessary medical data and the application of Machine Learning methods (like the Genetic Algorithm and the Analytic Hierarchy Process) provides a solution to such a challenge. Research presented in this paper gives the general approach to solve the clinical treatment selection task, which can be used for any type of disease. The distinguishing feature of this approach is that clinical treatment is tailored to the patient’s initial state, thus making treatment personalized. The article also presents a comparison of the different classification methods used to model patient indicators after treatment. Additionally, special attention was paid to the possibilities and potential of using the developed approach in real Healthcare challenges and tasks.
1. Introduction
This paper is an extension of work originally presented in the 15th International Conference on Computer Sciences and Information Technologies, held in Zbarazh (Ukraine) in September 2020 [1].
It is well known that human treatment is a delicate moment, as any wrong decision can radically affect the person’s state [2], for which doctors will be primarily responsible [3]. The word ‘treatment’ can mean different things, and it should be understood that not all treatments are equal. For example, treating a person for influenza [4], wherein most cases it suffices to prescribe a few medications for a couple of weeks, is not equivalent to treating cancer [5], which can last for years [6-7]. Undoubtedly, this does not mean that influenza poses no risk to human health [8], but if influenza progresses to a critical stage, medical supervision and prescription of clinical treatment are mandatory [9-11].
Clinical treatment refers to the process during which the patient stays in a medical institution under the strict supervision of clinicians and specialists, and undergoes all stages of therapy (including experimental treatments) to eliminate the symptoms of disease or complications. One of the major objectives in Healthcare is to treat the disease itself (not the symptom), so treatment must be chosen carefully and without hesitation. It is therefore the regular practice to use clinical protocols (guidelines) [12-14] while prescribing treatment.
Briefly, clinical protocols are systematically developed statements, which assist clinicians and patients in making decisions about appropriate treatment for specific conditions based on the best scientific evidence at the time of development [15-17]. These protocols are the primary medico-technological documents that specialists must follow in any given clinical situation, choosing the most effective solution to cure a patient. A clinical protocol is a manual for a doctor, and it contains guidelines to treat a specific disease.
In Ukraine, Ministry of Healthcare allows international clinical protocols under Order no. 1422 of the by 29 December 2016, which entered into force on 28 April 2017 [18-19]. To get these protocols, the Ministry of Healthcare has signed an agreement with “Duodecim Medical Publications Ltd”, a Finnish medical-scientific company specializing in comprehensive solutions for evidence-based medicine [18]. Since then, about a thousand international clinical protocols in English have been available online for registered users in Ukraine. Using new clinical protocols in medical practice has become one of the most important ways of implementing evidence-based medicine in Ukraine [19].
Many researchers are now focusing on clinical protocols to model the clinical treatment process [10] because these protocols do not guarantee a complete cure for the patient. The reason is that doctors do not have full knowledge of medicines, their types, and their correct use. This responsibility lies with clinical pharmacists (or clinical provisors) [20-21]. Specialist training in this field in Ukraine was established in 1999 by the National University of Pharmacy in Kharkiv [22]. Despite more than 20 years of training such specialists, the country simply does not have enough clinical pharmacists, which may be due to the limited financial resources of local medical institutions. This problem, and the rapid digitization of Healthcare in Ukraine [23], make it an urgent task to develop an automated decision support system for clinical treatment selection.
The making of decision support system was chosen because the selection of optimal clinical treatment should not be made solely by a machine. Medical staff is responsible for causing harm to humans [24], which is why Artificial Intelligence (AI) software must be used with utmost care for these challenges.
The basic requirements for such systems are:
- Usage of clinical protocol standards as a basis for decision support in treatment selection.
- As set out in right no. 12 of the European Charter of Patients’ Rights [25], the individual characteristics of the patient must be considered.
- The availability of AI and Machine Learning (ML) techniques to provide high-quality assistance for medical staff.
This research aims to develop a general approach to selecting optimal clinical treatment based on the requirements listed above. The first thing to consider is how treatment outcomes are assessed, as that enables AI- and ML-based applications to improve efficiency in decision making.
2. Assessing the Quality of Treatment: An Overview
2.1. Scales of Patient Severity
The quality of clinical treatment should be assessed foremost by results, bearing in mind that the aim of providing medical care is to ease the patient’s state. At all stages of treatment in the various fields of medicine, the determination of a patient severity objective assessment is essential for clinical decision-making. The close association of state severity with the prognosis of mortality risk further extends the application of such tools at different stages of care. For example, intensive care units (ICU) must provide prognoses for patients within the first 24 hours of admission.
The stratification of patients into risk groups according to the severity of their state is necessary to compare treatments and their quality, establish differences between different medical institutions, and evaluate the results of clinical trials in evidence-based medicine.
Establishing a prognosis comprises estimating the probability of death using indicators that are commonly used to diagnose and treat critically ill patients [26]. Severity scales are the classic tools used to establish such prognoses.
Rating systems quantify or qualify the severity of a state and classify the patient into specific risk groups, based on the analysis of anatomical, physiological and biochemical abnormalities [26-27]. Over two dozen severity scales have been developed, but only some of them can be considered universally accepted.
The most commonly used (in ICUs of USA and EU countries) scoring systems for assessing patient severity are: SAPS II, APACHE II and III, GCS, MPM II, SOFA, MODS, and LODS [28].
2.2. Models of Patient Severity
Most morbidity estimation models are based on Logistic Regression [29]. Authors of [30] analyzed papers that use SOFA models to predict mortality in ICUs. Only ten studies (56%) applied logistic regression models, and five of them had validated models with independent tests. The following models were also considered: combined with other assessment scales (APACHE, MOD) and additional measures of organ failure, time models (sequential SOFA scores), and automatically detected from the data SOFA templates. For example, the predictive ability of APACHE II was assessed using Logistic Regression analysis. For the Logistic Regression model based on the APACHE II score, the AUC of the ROC curve [31] was 0.863. Authors note that although there is heterogeneity across studies, it is impossible to say which SOFA-based model is optimal.
Decision Tree [32] methods have recently become more widespread in medical research. Clinical practitioners swallow them because they are illustrative and can turn into logical conditions (classification rules). Classification Trees have been used in critical situations, e.g., to calculate the probability of death from coronary pathologies [33], intracerebral hemorrhage [34] or craniocerebral injury [35], to predict persistent autonomic states [36], and to stratify patient groups by the likelihood of mortality in the general population of ICUs [37-38].
In [39], the author predicted the probability of hospital mortality using three Decision Tree classification algorithms: CART, CHAID, and C4.5. All models are based on estimating the severity of patients within the first 24 hours of admission only (2864 patients, 70:30). Authors of [39] point out that the chief advantages of Decision Trees are that the resulting decision rules can be easily interpreted and the composition of the patient group obtained at each final node of the tree is relatively homogeneous. All Decision Tree models achieved the AUC of 0.75-0.76, which was close to the AUC for APACHE II (0.77) but lower than the Logistic Regression AUC (0.81).
It is worth noting that such multidimensional models are not designed to handle streaming data. Modern morbidity estimation models are based on ML methods such as Support Vector Machine (SVM) [40], Bayesian models [41], Artificial Neural Network (ANN) [42], etc.
The predicted length of stay (LOS) [43], which is based on monitoring data, is seen as a target that helps plan resuscitation resources and make ICU care individualized.
2.3. Information Systems of State Assessment and Forecasting
INTCare [44] is an intelligent decision support system for intensive care medicine. It is a system based on both collecting data from monitors at the bedside and updating the model, reducing the need for human intervention. INTCare currently provides predictions about organ failure and the likelihood of in-hospital death. Reliable prognostic results contribute to improving the quality of service. The system presents functional and structural aspects. It aims to automate the knowledge discovery process.
The most important feature of INTCare’s intelligent decision support system is the ability to operate autonomously and in real-time. Two approaches were used to model and predict 2 targets (survival and LOS):
- Collected data and physiological features during the first 24 hours of inpatient treatment.
- Collected patient clinical data in real-time.
In the first approach, the achieved results were poor (73% accuracy). However, when predictions (dwell time) were made using data collected in real-time, the results became higher (model sensitivity 96.1%). Researchers in their work used these models: SVM, Decision Trees, and Naïve Bayes. For survival prediction, the Decision Trees method had the best result with a sensitivity of 87.32%.
A systematic review of the literature (2008-2018) [45], which aims to investigate the use of ML to improve patient health, analyzed 78 such studies. The conclusion is that AI techniques can analyze and learn useful standards from clinical datasets (which are stored in electronic medical records) to provide better evidence for supporting health professionals’ decisions.
More recently, the work has appeared that uses Deep Learning (DL) techniques, namely, Recurrent Neural Networks (RNN) with the Long Short-Term Memory (LSTM) architecture [46]. Experiments have shown that it is possible to predict vital signs in advance with good accuracy (more than 80%) to the deterioration of the patient’s state. Predicting a patient’s vital signs and using them to calculate a prognostic index makes it possible to predict future severe diagnoses that would not be possible using only the patient’s current vital signs (50%-60% of cases were not detected).
Also noteworthy is the Ukrainian work by Nastenko et al. [47], which used Group Method of Data Handling (GMDH) [48] models and Simplex Method [49] optimization algorithm to select the treatment strategy.
3. Mathematical Background
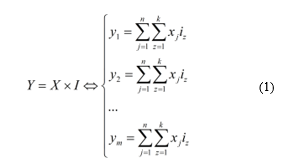
Let’s devise the general Healthcare challenge of this research. It is to find the optimal clinical treatment for the patient. In fact, in the mathematical space of objects, the patient (object) can be represented as a multidimensional vector, where the parameters are his/her indicators. In the simplest case, 2 patient states are possible in a given space: an initial state (before treatment) and a final state (after treatment). On this basis, 2 vectors of data are given for the challenge:
- – describes the initial state of the patient (x1, x2, …, xn are the patient’s indicators before clinical treatment).
- – describes the final state of the patient (y1, y2, …, ym are the patient’s indicators after clinical treatment).
Finding the optimal treatment involves finding the optimum of vector Y. The clinical treatment, which is applied to a patient for getting the Y-vector, can be described by a vector , where i1, i2, …, ik – are the different types of drugs (the influence parameters on the patient’s state). Therefore, Y-vector directly depends on vectors X and I (Fig. 1).
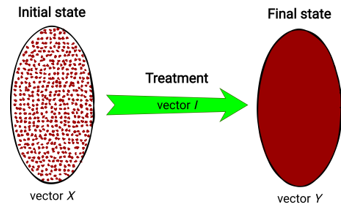 Figure 1: Visual representation of treatment process
This dependency can be described by the next general equation:
 Thus, it can be said that X = Y if no treatment is given (without regard to externalities).
Equations for y1, y2, …, ym (1) can be both linear or non-linear, parametric or non-parametric. With their usage, it seems possible to simulate (modeling) the clinical treatment process. Consequently, a multi-criteria optimization problem arises, where it is necessary to find such values of I-vector that will give the optimum of Y-vector. Values of X-vector are set by default, so the personalized solution search will be done by considering the patient’s initial state indicators (this idea was proposed in [47] for a single-criteria problem). So, it is necessary to create an algorithm that will solve such a task.
4. Personalized Clinical Treatment Selection Algorithm
As mentioned earlier, finding the optimal clinical treatment is a multi-criteria optimization problem. However, creating the algorithm for solving this problem raises the following issues:
- Simultaneous optimization of the Y-vector parameters (patient’s indicators after treatment).
- Searching the values of I-vector (influence parameters on the patient’s state), which gives the global optimum (NP-complete problem).
The first issue can be solved using Multi-Criteria Decision Making (MCDM) methods [50]. Since in most cases the final state of a patient is described by two or more Y-vector parameters (in this problem – the criteria for optimization), it is worthwhile to assess the patient’s state after treatment in the right way. MCDM methods allow getting a convolution of several criteria into one so-called “supercriterion”. Apart from solving simultaneous optimization, this supercriterion can be used as an assessment metric to describe the final state of the patient.
One of the simplest and most easily interpreted methods of MCDM is the Analytic Hierarchy Process (AHP) [51-52], invented by Thomas L. Saaty in the 70s. This method allows getting a function of additive convolution by pairwise comparison of criteria priorities. The comparison mechanism by AHP in general form is shown in Table 1.
Table 1: The General Form of Criteria Pairwise Comparison
| y1 | y2 | … | ym | |
| y1 | … | |||
| y2 | … | |||
| … | … | … | … | … |
| ym | … |
where: vi – the sequential number in the criteria list of Y-vector, ranked by importance.
The above table interprets the matrix of criteria pairwise comparison. To obtain a metric for the final patient state using AHP, the geometric mean for each matrix row is calculated. Then, the obtained values should be normalized; they will be the weights (w) of each criterion of the Y-vector, so the metric can be represented as follows:
![]() This metric is a function of additive convolution (Fac) of the criteria. It has the advantage of flexibility because it depends on priorities set out in Table 1 by the decision-maker. The signs in (2) are placed depending on whether it is necessary to maximize (then the “+” sign) or minimize (then the “-” sign) yi.
This metric is a function of additive convolution (Fac) of the criteria. It has the advantage of flexibility because it depends on priorities set out in Table 1 by the decision-maker. The signs in (2) are placed depending on whether it is necessary to maximize (then the “+” sign) or minimize (then the “-” sign) yi.
That solves the first issue of the given multi-criteria optimization problem, which allows converting it to the single-criteria optimization problem, where it is necessary to find the maximum of Fac. Solving it can be done by many optimization approaches. One of the most famous methods is the Genetic Algorithm [53-55] – a stochastic method for finding the required solution. The ideas of natural selection and genetics provide a fast search for the global optimum, thus solving the second issue of the NP-complete problem. The algorithm is shown schematically in Fig. 2.
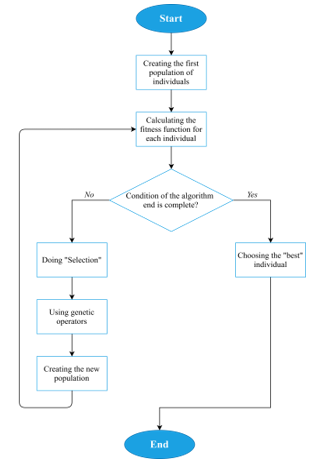 Figure 2: Genetic Algorithm scheme
To describe the Genetic Algorithm in more detail:
- A random sample (“population”) of N arrays (“individuals”, or “chromosomes”) that contain values of I-vector parameters (“genes”) is created (Figure 3).
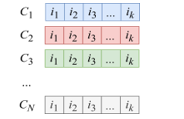 Figure 3: Population in general form
The number N, as well as the boundaries in which the values of genes will lie, are set directly by the researcher.
- “Fitness function” for each individual is calculated. In the current research, the fitness function is Fac (2).
- The condition of the algorithm end is checked (it can be the presence of the preassigned value of Fac or exceeding the time limit of the algorithm).
3.1. If the condition is complete, the Genetic Algorithm returns the “best” individual (optimal clinical treatment strategy).
3.2. If the condition is incomplete, the formation of a new population begins.
3.2.1. The “selection” [53-55] of individuals from the current population is carried out. This procedure aims to select individuals for the next generation creation, and the chance of selecting each individual directly depends on the value of his fitness function. The selected individuals form N pairs, which will then give “new” individuals.
3.2.2. The usage of “crossover” (one of the genetic operators) [53-55] for crossing the resulting pairs of individuals. A mixing of “genes” (parameters of I-vector) occurs between a pair of individuals, thus forming a new individual that stores the information about his “ancestors”. In the general case, randomly the “crossover point” is determined, which allows mixing a pair of “parents”: the genes of the first parent are before the crossover point, and after it – the genes of the second parent:
 Figure 4: Example of crossover
That creates a new individual. To ensure the diversity of the population during the entire algorithm’s operation, another genetic operator called “mutation” [53-55] is also used. This operator can be triggered with low probability instead of crossover, and its main purpose is to replace randomly selected genes of individuals with completely new ones.
3.2.3. Back to point number 2.
- Using the best individual as a recommendation for personalized treatment. Multiple choices can be derived so that the doctor has a choice.
As a result, the Genetic Algorithm has been got, where Fac is used as a fitness function, derived from the AHP ideology. The idea of using the convolution function (obtained by the MCDM method) as a fitness function of the Genetic Algorithm is not new. In [56], the authors used Weight Sum Approach and Tchebycheff Approach to get the convolution function. The authors of [57] were comparing Non-Dominated Sorting Genetic Algorithm II (NSGA-II), Multi-Objective Differential Evolution (MODE), and Multi-Objective Particle Swarm Optimization (MOPSO) algorithms. Such approaches are rather difficult to interpret, which makes it more complex to explain to the doctor the principle of the algorithm for finding the optimal clinical treatment. Therefore AHP was chosen to obtain a convolution function.
5. Statement of Findings
5.1. Description of Clinical Data
To test the performance of the algorithm, 2 clinical databases of patients with congenital heart defects [58] were used, which were provided by Amosov National Institute of Cardiovascular Surgery [59].
The first database (“DB1”) has 128 patients from 3 to 28 years. They underwent a total cavopulmonary connection (TCPC) in an extracardiac conduit modification as the final stage of hemodynamic correction between January 2005 and September 2016. Patients were treated in two phases: surgical treatment (various types of surgery were performed, including TCPC) and conservative treatment (use of medication). Only conservative treatment is considered for the research. With that in mind, the database has the following variables:
- 7 patient indicators before conservative treatment – the vector X.
- 22 types of drugs (that were used to treat patients) – the vector I.
- 38 patient indicators after treatment – the vector Y.
It is worth mentioning that patient indicators before treatment were selected with the help of doctors specifically for the research.
The second database (“DB2”) has 144 patients from 1 to 18 years. As in the first case, patients were treated in two stages (the only difference was the methodology). Variables of this database:
- 10 patient indicators before conservative treatment.
- 10 types of drugs (that were used to treat patients).
- 9 patient indicators after treatment.
It is also worth emphasizing that the variables’ names are not given so that people cannot use this research for self-medication.
5.2. Modeling the Patient Final State
As mentioned earlier, to perform an optimal clinical treatment selection, it is necessary to obtain models of the patient final state parameters (1). Both patient indicators before and after conservative treatment are either quantitative or qualitative features. Regression methods can be used to model quantitative features. However, doctors are not so much interested in what a particular value will equal a feature whether it will be in the normal range. Therefore, the authors of this research proposed another unique approach, namely, the binarization of quantitative features.
In this way, it is necessary to get models of the binary features (0 – patient indicator after treatment is normal, 1 – patient indicator is abnormal). Patient indicators before treatment and drugs indicators will be used as models’ predictors. That requires the use of classification methods. The following algorithms were chosen:
- Linear Discriminant Analysis (LDA) [60].
- Logistic Regression [29].
- Naïve Bayes [40].
- Linear SVM [41].
- SVM with Radial Basis Function (RBF) kernel [41].
- Gaussian Process Classifier (GPC) [61].
- Random Forest Classifier (RFC) [62].
- Adaptive Boosting (AdaBoost) [63].
- Multilayer Perceptron (MLP) [64].
All these algorithms were implemented using the Python programming language. Models were built for all final patient parameters in the “DB1” (38 indicators) and “DB2” (9 indicators) databases. To evaluate the models more adequately, the total data samples were split into training (80%) and test samples (20%). The models were evaluated according to their:
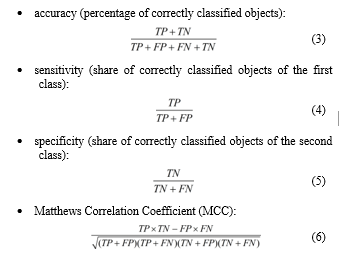 where: TP – true positives; FP – false positives (type I error); FN – false negatives (type II error); TN – true negatives.
The last metric (6) is a measure of binary classification quality. Its peculiarity is to consider positive and negative results, both true and false. MCC is a balanced measure that is used even for unbalanced classification. It is a correlation coefficient between real and predicted objects: it returns a value from -1 (complete mismatch) to 1 (perfect match). At 0, the classifier is considered to have made the prediction “by chance”.
Tables 2 and 3 show results of the classification, namely, the average values of the model classification metrics for each algorithm. As seen from the tables below, the RBF SVM classification algorithm performed best, showing an average model accuracy of around 100% on the test sample.
The resulting models are mathematical equations for patient indicators after treatment (1), which can be substituted in formula (2) to get Fac. This allows using the Genetic Algorithm to derive the best clinical treatment options for patients. These options will be personalized as each of the models is substituted for patient indicators before treatment.
Table 2: Final State Indicators Classification Results (“DB1”)
| Classification algorithm | Accuracy | Sensitivity | Specificity | MCC |
| Training sample (80%) | ||||
| LDA | 89.6% | 0.89 | 0.7 | 0.611 |
| Logistic Regression | 73.7% | 0.742 | 0.779 | 0.321 |
| Naïve Bayes | 74.4% | 0.807 | 0.758 | 0.429 |
| Linear SVM | 79.8% | 0.801 | 0.838 | 0.474 |
| RBF SVM | 100% | 1 | 1 | 1 |
| GPC | 98.6% | 0.949 | 0.715 | 0.679 |
| RFC | 99.9% | 1 | 0.996 | 0.998 |
| AdaBoost | 98.7% | 0.985 | 0.98 | 0.97 |
| MLP | 87.1% | 0.862 | 0.391 | 0.323 |
| Test sample (20%) | ||||
| LDA | 87.7 | 0.859 | 0.673 | 0.508 |
| Logistic Regression | 71.6 | 0.722 | 0.717 | 0.288 |
| Naïve Bayes | 75.3 | 0.811 | 0.74 | 0.412 |
| Linear SVM | 77.1 | 0.77 | 0.82 | 0.431 |
| RBF SVM | 99.2 | 0.987 | 0.99 | 0.982 |
| GPC | 97.6 | 0.936 | 0.728 | 0.661 |
| RFC | 99.1 | 0.995 | 0.972 | 0.975 |
| AdaBoost | 96.4 | 0.957 | 0.95 | 0.918 |
| MLP | 86.3 | 0.856 | 0.413 | 0.314 |
Table 3: Final State Indicators Classification Results (“DB2”)
| Classification algorithm | Accuracy | Sensitivity | Specificity | MCC |
| Training sample (80%) | ||||
| LDA | 79.6 | 0.639 | 0.713 | 0.413 |
| Logistic Regression | 65.6 | 0.656 | 0.665 | 0.242 |
| Naïve Bayes | 54.5 | 0.321 | 0.901 | 0.215 |
| Linear SVM | 68.6 | 0.699 | 0.691 | 0.307 |
| RBF SVM | 100 | 1 | 1 | 1 |
| GPC | 100 | 1 | 1 | 1 |
| RFC | 99.9 | 0.999 | 0.996 | 0.997 |
| AdaBoost | 95.1 | 0.917 | 0.972 | 0.891 |
| MLP | 90.1 | 0.892 | 0.604 | 0.511 |
| Test sample (20%) | ||||
| LDA | 76.4 | 0.6 | 0.646 | 0.267 |
| Logistic Regression | 63 | 0.625 | 0.616 | 0.192 |
| Naïve Bayes | 55.4 | 0.364 | 0.843 | 0.172 |
| Linear SVM | 64.1 | 0.644 | 0.618 | 0.204 |
| RBF SVM | 99.6 | 1 | 0.989 | 0.992 |
| GPC | 98.5 | 1 | 0.972 | 0.967 |
| RFC | 99 | 0.991 | 0.971 | 0.973 |
| AdaBoost | 89.8 | 0.852 | 0.886 | 0.748 |
| MLP | 88.8 | 0.846 | 0.598 | 0.46 |
6. Conclusions and Future Work
The research described the development of an algorithm for personalized clinical treatment selection by using the principles of the Genetic Algorithm (for quick treatment variant searching) and the Analytic Hierarchy Process (for patient final state indicators simultaneous optimization). It was detailed from start to finish how the algorithm performs the selection of optimal treatment, including such steps as binarizing the quantitative features of the patient after treatment, and further modeling them with different classification algorithms (in the conference paper [1] only Group Method of Data Handling algorithm was used for modeling). A comparative analysis of classification algorithms showed that the best option for obtaining patient indicators after treatment models is the Support Vector Machine classifier with Radial Basis Function kernel.
The resulting classification models are substituted into the function of additive convolution formula (obtained by Analytic Hierarchy Process), which is used as an optimization function that estimates the final state of the patient. The values of this function range from 0 to 1, and the higher the function value, the better the patient’s state. Such a feature could be used as a state-of-the-art metric for patient assessment.
This paper can be described as the beginning of creating a decision support system for personalized clinical treatment selection in Ukraine. It is necessary to carefully elaborate on all stages of the system to provide effective support for the doctor in deciding on a clinical treatment strategy. In this way, the system will be able to fill the absence of clinical pharmacists and optimize the work of medical institutions.
Also, despite the excellent results that were obtained, there were a few data to complete a full study. The problem is that Ukrainian medical institutions do not yet have much confidence in such Artificial Intelligence and Machine Learning methods, and with the medical liability legislation few institutions will provide data for comprehensive research and implementation. The decision support system requires a considerable number of resources and finances, which will be reviewed by authors for the future development of Medicine and Healthcare in Ukraine.
Conflict of Interest
The authors declare no conflict of interest.
Acknowledgment
The authors would like to express their gratitude to the experts from Amosov National Institute of Cardiovascular Surgery who provided clinical data and assist with the research.
- V. Babenko, O. Nosovets, “Calculating the Personalized Treatment Strategy by Genetic Algorithm Using Optimal Complexity Models,” in 2020 IEEE 15th International Conference on Computer Sciences and Information Technologies (CSIT), 1-4, 2020, doi: 10.1109/CSIT49958.2020.9321947.
- “Global, regional, and national age–sex specific all-cause and cause-specific mortality for 240 causes of death, 1990–2013: a systematic analysis for the Global Burden of Disease Study 2013,” 385(9963), 117-171, 2015, doi: 10.1016/s0140-6736(14)61682-2.
- S. Holm, “Final responsibility for treatment choice: the proper role of medical doctors?,” Health Expectations, 14(2), 201-209, 2011, doi: 10.1111/j.1369-7625.2011.00673.x.
- H. Mousa, “Prevention and Treatment of Influenza, Influenza-Like Illness, and Common Cold by Herbal, Complementary, and Natural Therapies,” Journal Of Evidence-Based Complementary & Alternative Medicine, 22(1), 166-174, 2016, doi: 10.1177/2156587216641831.
- M. Arruebo, N. Vilaboa, B. Sáez-Gutierrez, J. Lambea, A. Tres, M. Valladares, Á. González-Fernández, “Assessment of the Evolution of Cancer Treatment Therapies,” Cancers, 3(3), 3279-333, 2011, doi: 10.3390/cancers3033279.
- C. Pucci, C. Martinelli, G. Ciofani, “Innovative approaches for cancer treatment: current perspectives and new challenges,” Ecancermedicalscience, 13, 2019, doi: 10.3332/ecancer.2019.961.
- E. Crimini, M. Repetto, P. Aftimos, A. Botticelli, P. Marchetti, G. Curigliano, “Precision medicine in breast cancer: From clinical trials to clinical practice,” Cancer Treatment Reviews, 98, 102223, 2021, doi: 10.1016/j.ctrv.2021.102223.
- E. Chow, J. Doyle, T. Uyeki, “Influenza virus-related critical illness: prevention, diagnosis, treatment,” Critical Care, 23(1), 2019, doi: 10.1186/s13054-019-2491-9.
- D. Hall, A. Prochazka, A. Fink, “Informed consent for clinical treatment,” Canadian Medical Association Journal, 184(5), 533-540, 2012, doi: 10.1503/cmaj.112120.
- X. Lu, Z. Huang, H. Duan, “Supporting adaptive clinical treatment processes through recommendations,” Computer Methods And Programs In Biomedicine, 107(3), 413-424, 2012, doi: 10.1016/j.cmpb.2010.12.005.
- Z. Huang, W. Dong, L. Ji, H. Duan, “Outcome Prediction in Clinical Treatment Processes,” Journal Of Medical Systems, 40(1), 2015, doi: 10.1007/s10916-015-0380-6.
- S. Woolf, R. Grol, A. Hutchinson, M. Eccles, J. Grimshaw, “Clinical guidelines: Potential benefits, limitations, and harms of clinical guidelines,” BMJ, 318(7182), 527-530, 1999, doi: 10.1136/bmj.318.7182.527.
- L. Hughes, M. McMurdo, B. Guthrie, “Guidelines for people not for diseases: the challenges of applying UK clinical guidelines to people with multimorbidity,” Age And Ageing, 42(1), 62-69, 2012, doi: 10.1093/ageing/afs100.
- R. Rosenfeld, J. Shin, S. Schwartz, R. Coggins, L. Gagnon, J. Hackell et al., “Clinical Practice Guideline,” Otolaryngology–Head And Neck Surgery, 154(2), 201-214, 2016, doi: 10.1177/0194599815624407.
- L. Duff, E. Mclnnes, N. Cullum, A. Nelson, K. Luker, “Clinical guidelines,” Primary Health Care, 9(1), 28-30, 1999, doi: 10.7748/phc.9.1.28.s14.
- “Clinical Guidelines”. Physiopedia. (2012). Retrieved 24 March 2021, from https://bit.ly/3hPPpFY.
- “National Clinical Effectiveness Committee Standards for Clinical Practical Guidance”. Nursing and Midwifery Board of Ireland. (2015). Retrieved 24 March 2021, from https://bit.ly/3jY921d.
- “Clinical protocols” (in Ukrainian). Ministry of Healthcare of Ukraine. (2017). Retrieved 23 December 2020, from https://bit.ly/2T4LLj8.
- “???????? ?????????: ?? ?? ? ?? ? ???? ? ???????” (in Ukrainian). Ministry of Healthcare of Ukraine. (2017). Retrieved 23 December 2020, from https://bit.ly/2T26BzF.
- J. Saseen, T. Ripley, D. Bondi, J. Burke, L. Cohen, S. McBane et al., “ACCP Clinical Pharmacist Competencies,” Pharmacotherapy: The Journal Of Human Pharmacology And Drug Therapy, 37(5), 630-636, 2017, doi: 10.1002/phar.1923.
- F. Khan, N. Waqas, A. Ihsan, P. Khongorzul, J. Wazir, W. Gang et al., “Analysis of the Qualities Matching New Classification of Clinical Pharmacist,” Indian Journal Of Pharmaceutical Sciences, 81(1), 2019, doi: 10.4172/pharmaceutical-sciences.1000473.
- “Clinical Pharmacy (Educational Programme)”. National University of Pharmacy. (2015). Retrieved 15 October 2020, from https://bit.ly/3hZ0h46.
- “Ukraine to receive UAH 128 million for digitalization of services provided by Digital Transformation Ministry”. UNDP. (2020). Retrieved 12 March 2021, from https://bit.ly/3e4czHm.
- “???????????????? ???????? ???????????” (in Ukrainian). Legislation of Ukraine. (2011). Retrieved 14 March 2021, from https://bit.ly/3AOe9Hg.
- Ö. Emre, G. Sert, “European Charter of Patients’ Rights,” Turkish Journal Of Bioethics, 1(4), 198-205, 2014, doi: 10.5505/tjob.2014.69775.
- “ASA Physical Status Classification System | American Society of Anesthesiologists (ASA)”. American Society of Anesthesiologists. (2020). Retrieved 28 November 2020, from https://bit.ly/3xx4DGr.
- W. Owens, J. Felts, E. Spitznagel, “ASA Physical Status Classifications,” Anesthesiology, 49(4), 239-243, 1978, doi: 10.1097/00000542-197810000-00003.
- J. Havens, A. Columbus, A. Seshadri, C. Brown, G. Tominaga, N. Mowery, M. Crandall, “Risk stratification tools in emergency general surgery,” Trauma Surgery & Acute Care Open, 3(1), e000160, 2018, doi: 10.1136/tsaco-2017-000160.
- S. Sperandei, “Understanding logistic regression analysis,” Biochemia Medica, 12-18, 2014, doi: 10.11613/bm.2014.003.
- L. Minne, A. Abu-Hanna, E. de Jonge, “Evaluation of SOFA-based models for predicting mortality in the ICU: A systematic review,” Critical Care, 12(6), R161, 2009, doi: 10.1186/cc7160.
- J. Muschelli, “ROC and AUC with a Binary Predictor: a Potentially Misleading Metric,” Journal Of Classification, 37(3), 696-708, 2019, doi: 10.1007/s00357-019-09345-1.
- C. Bulac, A. Bulac, “Decision Trees,” Advanced Solutions In Power Systems: HVDC, FACTS, And Artificial Intelligence, 819-844, 2016, doi: 10.1002/9781119175391.ch18.
- P. Austin, “A comparison of regression trees, logistic regression, generalized additive models, and multivariate adaptive regression splines for predicting AMI mortality,” Statistics In Medicine, 26(15), 2937-2957, 2007, doi: 10.1002/sim.2770.
- O. Takahashi, E. Cook, T. Nakamura, J. Saito, F. Ikawa, T. Fukui, “Risk stratification for in-hospital mortality in spontaneous intracerebral haemorrhage: A Classification and Regression Tree Analysis,” QJM, 99(11), 743-750, 2006, doi: 10.1093/qjmed/hcl107.
- A. Rovlias, S. Kotsou, “Classification and Regression Tree for Prediction of Outcome after Severe Head Injury Using Simple Clinical and Laboratory Variables,” Journal Of Neurotrauma, 21(7), 886-893, 2004, doi: 10.1089/0897715041526249.
- G. Dolce, M. Quintieri, S. Serra, V. Lagani, L. Pignolo, “Clinical signs and early prognosis in vegetative state: A decisional tree, data-mining study,” Brain Injury, 22(7-8), 617-623, 2008, doi: 10.1080/02699050802132503.
- A. Abu-Hanna, N. de Keizer, “Integrating classification trees with local logistic regression in Intensive Care prognosis,” Artificial Intelligence In Medicine, 29(1-2), 5-23, 2003, doi: 10.1016/s0933-3657(03)00047-2.
- L. Gortzis, F. Sakellaropoulos, I. Ilias, K. Stamoulis, I. Dimopoulou, “Predicting ICU survival: A meta-level approach,” BMC Health Services Research, 8(1), 2008, doi: 10.1186/1472-6963-8-157.
- J. Trujillano, M. Badia, L. Serviá, J. March, A. Rodriguez-Pozo, “Stratification of the severity of critically ill patients with classification trees,” BMC Medical Research Methodology, 9(1), 2009, doi: 10.1186/1471-2288-9-83.
- V. Chauhan, K. Dahiya, A. Sharma, “Problem formulations and solvers in linear SVM: a review,” Artificial Intelligence Review, 52(2), 803-855, 2018, doi: 10.1007/s10462-018-9614-6.
- T. Fragoso, W. Bertoli, F. Louzada, “Bayesian Model Averaging: A Systematic Review and Conceptual Classification,” International Statistical Review, 86(1), 1-28, 2017, doi: 10.1111/insr.12243.
- R. Houthooft, J. Ruyssinck, J. van der Herten, S. Stijven, I. Couckuyt, B. Gadeyne et al., “Predictive modelling of survival and length of stay in critically ill patients using sequential organ failure scores,” Artificial Intelligence In Medicine, 63(3), 191-207, 2015, doi: 10.1016/j.artmed.2014.12.009.
- Moore, D., Keegan, T., Dunleavy, L., & Froggatt, K. (2019). Factors associated with length of stay in care homes: a systematic review of international literature. Systematic Reviews, 8(1). doi: 10.1186/s13643-019-0973-0
- P. Gago, M. Santos, A. Silva, P. Cortez, J. Neves, L. Gomes, “INTCare: a Knowledge Discovery Based Intelligent Decision Support System for Intensive Care Medicine,” Journal Of Decision Systems, 14(3), 241-259, 2005, doi: 10.3166/jds.14.241-259.
- N. Kaieski, C. da Costa, R. da Rosa Righi, P. Lora, B. Eskofier, “Application of artificial intelligence methods in vital signs analysis of hospitalized patients: A systematic literature review,” Applied Soft Computing, 96, 106612, 2020, doi: 10.1016/j.asoc.2020.106612.
- D. da Silva, D. Schmidt, C. da Costa, R. da Rosa Righi, B. Eskofier, “DeepSigns: A predictive model based on Deep Learning for the early detection of patient health deterioration,” Expert Systems With Applications, 165, 113905, 2021, doi: 10.1016/j.eswa.2020.113905.
- I. Nastenko, V. Pavlov, O. Nosovets, K. Zelensky, O. Davidko, O. Pavlov, “Solving the Individual Control Strategy Tasks Using the Optimal Complexity Models Built on the Class of Similar Objects,” Advances in Intelligent Systems and Computing IV, 1080, 535-546, 2020, doi: 10.1007/978-3-030-33695-0_36.
- V. Vaishnav, J. Vajpai, “Assessment of impact of relaxation in lockdown and forecast of preparation for combating COVID-19 pandemic in India using Group Method of Data Handling,” Chaos, Solitons & Fractals, 140, 110191, 2020, doi: 10.1016/j.chaos.2020.110191.
- R. Vanderbei, “The Simplex Method,” International Series In Operations Research & Management Science, 11-25, 2020, doi: 10.1007/978-3-030-39415-8_2.
- S. Panjwani, S. Naresh Kumar, L. Ahuja, “Multi-criteria decision making and its applications,” International Journal of Innovative Technology Exploring Engeering 8(9 Special Issue 4), 2019, doi: 10.35940/ijitee.I1122.0789S419.
- T. L. Saaty, “Decision Making for Leaders: The Analytic Hierarchy Process for Decisions in a Complex World,” RWS Publications, 1990, doi: 10.1016/0377-2217(89)90066-0.
- T. L. Saaty, “THE ANALYTIC HIERARCHY PROCESS WITHOUT THE THEORY OF OSKAR PERRON,” International Journal Of The Analytic Hierarchy Process, 5(2), 2014, doi: 10.13033/ijahp.v5i2.191.
- D. Whitley, “A genetic algorithm tutorial,” Statistics And Computing, 4(2), 1994, doi: 10.1007/bf00175354.
- J. García, C. Acosta, M. Mesa, “Genetic algorithms for mathematical optimization,” Journal of Physics: Conference Series, 5-5, 2020, doi: 10.1088/1742-6596/1448/1/012020.
- S. Katoch, S. Chauhan, V. Kumar, “A review on genetic algorithm: past, present, and future,” Multimedia Tools And Applications, 80(5), 8091-8126, 2020, doi: 10.1007/s11042-020-10139-6.
- Q. Zhang, H. Li, “MOEA/D: A multiobjective evolutionary algorithm based on decomposition,” IEEE Transactions on Evolutionary Computation, 11(6), 712–731, 2007, doi: 10.1109/TEVC.2007.892759.
- H. Monsef, M. Naghashzadegan, A. Jamali, R. Farmani, “Comparison of evolutionary multi objective optimization algorithms in optimum design of water distribution network,” Ain Shams Engineering Journal, 10(1),103–111, 2019, doi: 10.1016/j.asej.2018.04.003.
- A. Dydyk, O. Nosovets, V. Babenko, “Setting Up the Genetic Algorithm for the Individualized Treatment Strategy Searching,” Herald of Advanced Information Technology, 3(3), 125–135, 2020, doi: 10.15276/hait.03.2020.2.
- “Amosov National Institute of Cardiovascular Surgery”. Retrieved 1 October 2018, from https://bit.ly/2T9vWrq.
- D. HU, X. LI, F. NIE, “Deep linear discriminant analysis hashing,” SCIENTIA SINICA Informationis, 51(2), 279-279, 2021, doi: 10.1360/ssi-2019-0175.
- D. Mackay, M. Gibbs, “Variational Gaussian process classifiers. IEEE Transactions On Neural Networks, 11(6), 1458-1464, 2000, doi: 10.1109/72.883477.
- C. Mantas, J. Castellano, S. Moral-García, J. Abellán, “A comparison of random forest based algorithms: random credal random forest versus oblique random forest,” Soft Computing, 23(21), 10739-10754, 2018, doi: 10.1007/s00500-018-3628-5.
- D. Feng, Z. Liu, X. Wang, Y. Chen, J. Chang, D. Wei, Z. Jiang, “Machine learning-based compressive strength prediction for concrete: An adaptive boosting approach,” Construction And Building Materials, 230, 117000, 2020, doi: 10.1016/j.conbuildmat.2019.117000.
- J. Tang, C. Deng, G. Huang, “Extreme Learning Machine for Multilayer Perceptron,” IEEE Transactions On Neural Networks And Learning Systems, 27(4), 809-821, 2016, doi: 10.1109/tnnls.2015.2424995.