Real-time Measurement Method for Fish Surface Area and Volume Based on Stereo Vision

Adv. Sci. Technol. Eng. Syst. J. 6(5), 141–148 (2021);
 DOI: 10.25046/aj060516
In the automation of the fish processing industry, the measurement surface-area and volume of the fish requires a method that focuses on processing automation. The creation of a stereo-vision based on real-time measurement method is one of the most essential aspects of this work. To do this task, we completed two steps. The first, the acquisition of the image of the fish using a stereo camera and calibrating the image for size using sample of the image acquisition. Second, by applying image processing techniques and vision system, the fish surface area and fish volume is obtained in real-time. The experimental results of the proposed method have good results for fish surface area and fish volume. The measuring process using stereo-vision only takes a short time, making it suitable for the real-time method.
1. Introduction
Knowing the volume size is useful in the fish processing industry for size sorting, quality assessment, and microbial concentration [1]. After calculating the volume, other physical parameters such as mass and density are also easy to investigate. Surface area and volume are important physical parameters in fish[2,3]. Surface-area and fish volume are important parts in processing into fish products that must be known. In the salting process of fish, the area and thickness of the salt are affected by the surface area. Furthermore, understanding the surface area of fish is needed to calculate heat and mass transfer, determine other physical parameters including gas permeability, weight per unit surface area, and respiration rate. Fish-volume and other physical properties are appropriate for calculating water content, heat transfer, and respiration rates. Likewise, the volume of fish affects the rate of cooling and freezing, which is ultimately useful for determining the heat load on the cooling system and calculating cooling costs [4, 5].
Measurement of surface area and volume of fish is currently generally done manually by using the eyes of people or workers using a manual meter. Manual measurements can result in inaccurate, ineffective, and time-consuming measurements, especially when measuring fish in large numbers. The most commonly used for measuring surface area is the tape method, while the volume measurement used the water displacement method [6]. The tape method has drawbacks, such as timing problems, and may cause measurement errors due to human error. Similarly, because the fish has holes in its gills and mouth, volume measurement using the gas transfer method and the water displacement method is not practical for fish shapes. Analytical estimates based on principal dimensions and weight have been studied [7], but the results of this method are very time-consuming because the sensing process is carried out by human.
In the entire fish processing process, measuring the surface area and volume is critical. To increase production and minimize processing time and costs, the fish processing sector requires technology solutions that focus on processing automation. Innovative advances in image processing have empowered the use of new methods to quantify the surface region and volume of fish correctly, rapidly, and precisely. With the availability of image processing techniques, digital image analysis has begun to be used for simple measurement systems such as line measurements [8]. A partitioning technique utilizing the image processing has been completed to ascertain the surface region and volume of fish [9]. The working principle of this measurement method is offline. Real-time image segmentation to determine the coordinates of image objects has been carried out [10]. The segmentation principle employs stereo-vision as a measuring instrument, which is typically unstable and slow. With the availability of image processing methods and stereo-vision as measuring tools, the automation of the fish processing industry is feasible because to the development of a stereo-vision-based real-time measuring.
Based on the previous description, the researcher is interested in investigating and developing new methods for measuring the surface area and volume of fish, specifically real-time measurements, and creating a stereo-vision-based instrumentation system for real-time measurements.
The main objective of this research is to develop a method of measuring the surface area and volume of fish using a stereo camera as a vision instrument so the measurements can be applied in real-time. The development is implemented by combining the ellipsoid approach method and the real-time image segmentation method using a stereo camera as stereo-vision.
2. Related Work
As previously described, the fish handling industry requires mechanical arrangements that attention on mechanization of preparing to expand efficiency and lessen handling time and expenses. Estimating the surface region and volume of fish is a significant stage in the entire process of the fish handling industry. In order to automate the process of measuring the surface area and volume of fish, new methods need to be developed. Due to technological advances in image processing methods and the principle of real-time image segmentation using stereo-vision, research on image processing and stereo-vision applications for measurement is increasingly being carried out.
The first step in real-time measurement using stereo-vision is segmenting the image of the object to be measured. Studies on image segmentation methods are still being carried out at present, all of which aim to improve the quality of the image segmentation of objects. The selection of automatic thresholding for image segmentation based on genetic algorithms was done in [11]. Research on image segmentation of fish objects using the K-means cluster enhancement algorithm to obtain fish body contours by separating the fish image from the background in complex background conditions has been carried out [12]. All the studies mentioned above showed satisfactory results. However, the proposed studies were limited to static imagery.
Researchers have conducted several preliminary investigations on fish image segmentation in addition to the studies described above. Research to determine the amount of fish skin injury has been proposed [13]. The proposed research was to realize the form of injury to fish based on the L*A*B* color space and the HSV color space. Subsequent research proposed a new approach to measuring 2D injury rates in fish with a modified K-means cluster algorithm based on the L*A*B* color space [14]. The experimental results of this study indicate that the proposed new approach is closer to the level of injury and actual injury to fish than the results of the manual threshold method on L*A*B* color images. The two studies above resulted in fish image segmentation, which effectively measures the level of injury to fish skin. However, in practice, it was still carried out offline. An offline image segmentation development is real-time image segmentation. The real-time image segmentation method for online measurement purposes was developed [10]. This real-time image segmentation method uses a stereo camera as stereo-vision to determine the coordinates of the image object. The emphasis was on determining the coordinate image of the object.
Image processing techniques are still being used to develop methods for measuring surface area and volume. Some of them was the determination of the volume and surface area of bubbles [15], estimating the volume and weight of apples using the 3D reconstruction method [16], and the determination of the surface area and volume of the fish using the ellipsoid approach method applied to image processing [9]. However, the determination and estimation of volume and surface area of image objects were still done offline in these studies. The strategy to decide surface region and volume of axisymmetric farming items was created [17]. In this study, the image captured by the CCD camera was processed using adobe photoshop. The use of an inexpensive 3D scanner to measure the surface area and volume of sweet potatoes was proposed [18]. The results of the method were satisfied for the identification of features related to shape using 3D scanner-based measurement.
In this study, we will develop a method of measuring the surface-area and volume of fish in real-time using a stereo camera as stereo-vision. Development is done by combining the ellipsoid approach method that researchers have reported in [9] and the real-time image segmentation method using a stereo-camera as stereo-vision reported in [10]. In the elliptical approach, the fish object is considered an ellipsoid shape by making partitions on three sides of the view according to the analytical model. Partitions on three sides are analyzed as image pixel shape are estimated as surface area and volume. The real-time segmentation process is carried out on a stereo-vision video frame that will capture the 3D coordinate value of the fish object to be measured. Real-time 3D coordinate values in the stereo-vision video frame corresponding to the image pixel values on the partitions of each viewpoint of the fish. The pixel value will be converted to millimeter size according to stereo-vision calibration.
3. Proposed Real Time Measurement Method
This section presents a real-time estimating technique for the surface region and volume of fish by using a vision system. The stereo camera mounted on the highest point of the fish object is used to capture the images. Image calibration for fish size was carried out using one image sample taken with a stereo camera. The stereo camera performs the segmentation procedure in real time on the video frame. The calibration of the stereo camera yielded intrinsic and extrinsic parameters. Open-source computer vision libraries (OpenCV, C++) were used to create an image segmentation algorithm that works in real-time. To extract objects in a “graph-based image,” it utilizes a combination “HSV color space, threshold value, mathematical morphological transformations, and contour detection techniques.” This research provides a method for performing real-time image segmentation. This process uses open-source computer vision (OpenCV, C++) to determine the surface area and volume of the fish. The utilization of a stereo camera to quantify the surface region and volume of fish in 3D directions is introduced as well in this paper. To test the validity of the proposed real-time measurement methodology, the experimental findings of the proposed real-time measurement technique are compared to those of the analytical measurement approach.
3.1. Stereo Camera Image Acquisition
The experimental arrangement for this proposed measuremet is shown in Figure 1. A stereo camera was utilized to capture the images in this study. Figure 2 depicts the target measurement experimental setup. The cross-line serves as a guide for precisely positioning the target fish. A stereo camera can automatically determine the fish’s location.
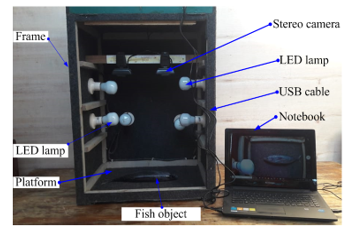 Figure 1: Experimental arrangement of proposed measurement
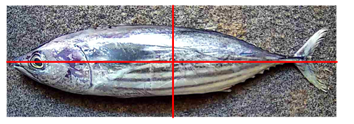 Figure 2: Experimental setup for target measurement
3.2. Image Calibration
A sample image taken with a stereo camera is used to calibrate the size of the fish image. A caliper was used to measure the physical dimensions of the fish in millimeters, as shown in Figure 3. The value of the calibration constant for the measurement of surface area and fish volume was based on the findings of image calibration of one fish object. The number of pixels from the outermost distance of the fish pictures is the unit of measurement in millimeters
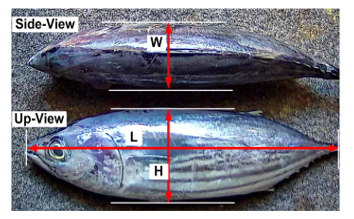 Figure 3: Fish measured by using micrometer
3.3. Partition for image processing method
Figure 4 depicts a fish surface region and volume picture preparation technique. Each circle area and volume may be calculated as follows:
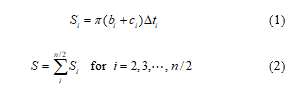
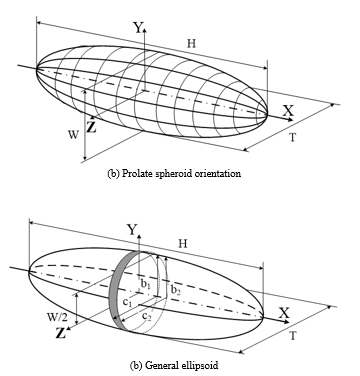 Figure 4: Model used for image processing method
Area of each disc is calculated as average area of left and right planes, and dti is very thin and set as a pixel. The volume of each disc can be calculated as follows:”
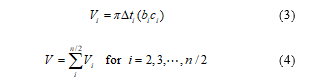 where and denote heights of the discs of the left and right planes in top view, and denote widths of the discs of left and right planes in side view, respectively, denotes as the thickness between disc of the left and right planes, and n denotes the number of boundary point of the fish contours.”
3.4. Stereo Camera Calibration
The focal length of a stereo camera is an important parameter in a measurement algorithm. This value is obtained by calibrating a stereo camera. This parameter determines whether a camera lens’s ability to focus on an object through distorted images is strong or weak. There are four intrinsic parameters: fx and fy as the focal lengths of the camera in terms of pixel dimensions in the x and y direction, and (u0,v0) is the principal point. The camera usually represents lens distortion that is a radial distortion given as follows:
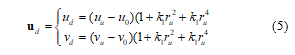 distortion-free is expressed as p(uu,vu) and distortion-normalized image coordinates is expressed as p(ud,vd). The radial distortion coefficients are expressed as k1 and k2, and The focal length is determined by the camera model.
 In terms of pixel size in the x and y directions, the focal length of the camera are denoted by fx and fy .
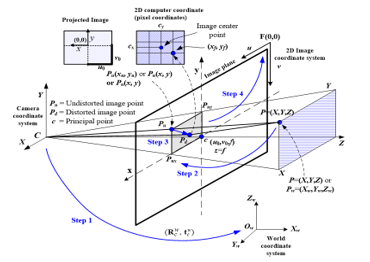 Figure 5: Steps of camera calibration
The most significant role of camera calibration is to identify the four intrinsic parameters and the two distortion coefficients.
The recommended calibration procedure as follows:
- Setup camera, print a pattern and attach it to a planar surface.
- Take a few images of the model plane under different orientations by moving either the plane or the camera.
- Detect the feature points in the images.
- Estimate the intrinsic and extrinsic parameters of the camera.
There are four steps to convert a point from the world coordinates to the computer memory image coordinate, shown in Figure 5.
3.5. Real-Time Image Segmentation
The segmentation process is done in real-time on the video frame by using a stereo camera. In reducing complexity and computation time, hue and value feature spaces are segmented. After that, they combine as a feature image segmentation. A stereo camera is applied to capture the images of the fish. In this work, use contour-based segmentation and mathematical morphological method for real-time segmentation. Image segmentation is done by combining the HSV color space, threshold, mathematical morphological transformations, and contour detection techniques to extract objects in graphics-based images. Software design is implemented by using the C++ programming language. A library available in open-source computer vision (OpenCV, C++) is used to implement real-time image segmentation by loading images, creating windows to hold an image in real-time, and saving the image.
3.6. 3D Measurement
The 3D position is obtained from stereo triangulation. First, two images are obtained from a set of three-dimensional test points whose three-dimensional coordinates are known. Secondly, the estimated 3D coordinate of the same points is computed from their projections using the calibrated parameters. Finally, the discrepancy between real and estimated positions is compared. In this case, the accuracy depends on the calibration of both cameras. Figure 6 shows the principle of 3D measurement using a stereo camera. The projective transformation for the basic stereo camera image is sought with the epipolar constraint that the epipolar line is horizontal, and 3D measurements are made from the information about the corresponding point by a stereo camera. The pairs of baseline stereo images are generated from ordinary images with the projective transformation of the axes of X, Y, and Z.
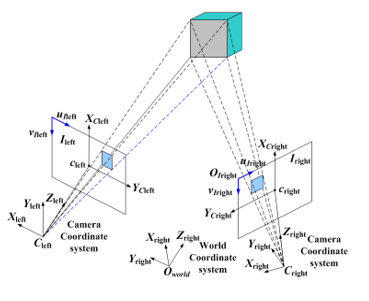 “Figure 6: 3D measurement principle using stereo camera”
The triangulation of stereo camera model is shown in Figure 7. Generally, stereo systems may have optical axes with the fixation point at a finite distance from the cameras. The left and right image planes are represented by the segments Ileft and Iright, respectively, and Ol and Or are the centers of projection, or optical centers in the left and right of the camera, respectively. Because the optical axes are parallel, their point of centroid called the fixation point lies intimately far from the cameras.”
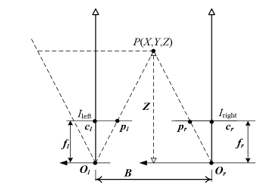 Figure 7: Triangulation of stereo camera mode
By assuming that the 3D coordinate frame has its origin in the optical center of the left camera, the perspective projection from the 3D camera coordinate (X, Y, Z) to the ideal image coordinate (x, y) is as follows:
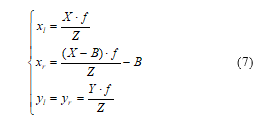 From Equation (7), the Z coordinate can be determined as follows:”
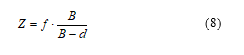 where xl=pl-cl, xr=pr–cr, and d=xr–xl is a disparity that is the difference in image position between corresponding points in the two images. Once Z is determined, it is straightforward to calculate X and Y using similar triangles:
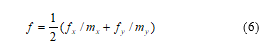
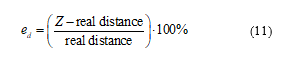
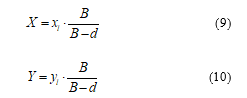 Following the segmentation procedure, the 3D object coordinates are determined. “First, the object is recognized to determine its center, and then the principle of determining 3D coordinates is implemented. The following is how the distance error rate is calculated.
 3.7. Fish Surface Area and Volume Measurement
Figure 8 shows the flow chart of the software developed to calculate the surface area and volume of the fish. The process begins with obtaining two synchronous images of the cameras and their subsequent correction using the parameters obtained from the calibration. Once the images are corrected, the fish real-time image segmentation algorithm is executed individually for the up-view image and side-view image. It is done for the up-view image to obtain fish length and width in pixels, and the same process is done for the side-view image to obtain fish length and height in pixels.
The first process is done for the up-view image so that length (L) and width (W) are obtained, and these results are stored as a saved model. The length (L) and height (H) is calculated in a side view, and the result is saved as a saved model. For the last process, the values of LWH are used for the calculation process of surface area and volume.
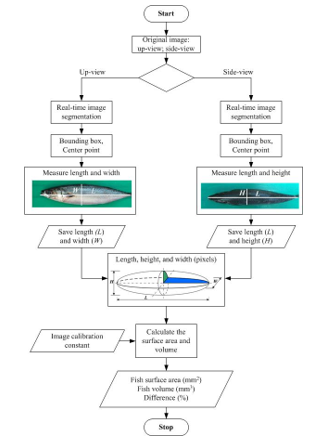 “Figure 8: Flowchart to calculate fish surface are and volume
4. Experiment Results
4.1. Experiment Result for Image Calibration and Stereo Camera Calibration
In this experiment, for image calibration, we used a vernier caliper to measure the physical dimension of the fish in millimeters. We use the image calibration result of one fish object as a calibration constant value for measuring fish surface area and volume measurement. The size in millimeters is obtained by measuring the number of pixels from the outermost distance of the fish images. Figure 3 shows the fish image processing results used for image calibration. An example of one fish has a dimension of 290 mm (L) x 51.1 mm (H) x 38.22 mm (W), and the calibration result is obtained as 1 pixel = 0.0251 mm for (L), 1 pixel = 0.00557 mm for (H), and 1 pixel = 0.00475 mm for (W).
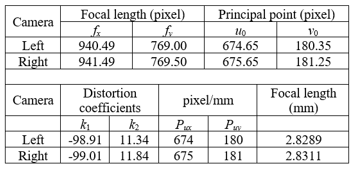
Camera intrinsic parameters are calibrated at a working distance of about 1000 mm. The chessboard image is used as a calibration pattern, and a 19” LCD monitor is used to display the image pattern. Table 1 shows the calibration results of the left camera and right camera, respectively.
Table 1: Calibration results of the intrinsic camera parameter
 4.2. “Experiment result for Real-Time Image Segmentation”
The proposed segmentation method is designed to detect fish objects useful for fish processing. The proposed image segmentation method is applied to different scanning objects before it is applied to the fish. Various common objects, such as simple objects, small and large objects, objects of different shapes, and various objects, are used in this experiment. Once the stereo camera finds the center position of the image fish it wants to measure, the open-source computer vision will segment the fish image, calculating it to prepare for real-time surface area and volume measuring.
The vision targets tested in the experiments are fish as a real detected vision object. Figure 9 shows fish target detection. Figure 9(a) shows the original RGB color image, Figure 9(b) shows the threshold image, and Figure 9(c) shows a segmented image with a centroid position.
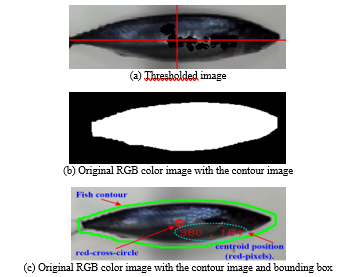 “Figure 9: Fish target detection”
The image processing stage involves image segmentation for the fish object target, the object centroid, and the bounding box in pixels. The white background used in the experimental setup simplifies the background detection procedure in both RGB color images obtained with a stereo camera.
The results of segmenting fish objects using the lowest threshold (Th = 0) and a bounding box are shown in Figure 10. The best results were found in this research, as shown in Figure 10(a). The feature segmentation findings from this experiment will be used in the next step because of their high accuracy. The results of feature segmentation in Figure 10 are used in the next test. By applying the graph cut algorithm, the results are shown in Figure 11. Finally, image segmentation is obtained from the object’s bw image, as shown in Figure 11(a).
 “Figure 10: Segmentation of the fish object with Th = 0 and bounding box”
 “Figure 11: Segmentation of the fish object with Th=0”
4.3. Experimental#results of fish surface#area and volume measurement
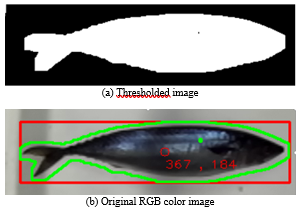
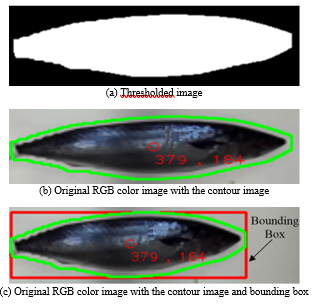
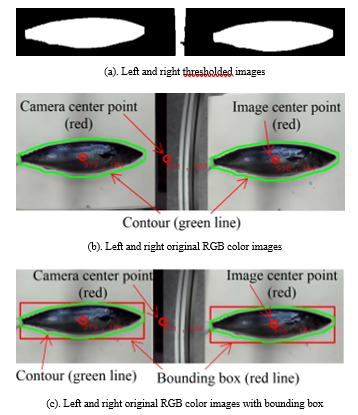
Figure 12 shows the representation of the right camera and the left camera in real-time image segmentation. The white area of the fish threshold image in Figure 12(a) is represented by the inner area of the green line in the original RGB color image of the fish in Figure 12(b). The white area in the threshold image and the green line in the original RGB color image are visible for the left camera and right camera. In other words, image segmentation works well. It is also indicated by the bounding box in the green line area, the center point of the original left-right image (red), and the center point between the left camera and the right camera.
 “Figure 12: Representation of the right camera and left camera”
The length, width, and height of the bounding box (L, W, and H) correspond to the fish image’s length, width, and height in pixels. Because calculating the surface area and volume can be limited to one image, the centroid will be calculated for both images obtained with the stereo camera system. The thresholded image of the target analyzed in one experiment, as shown in## Figure 12(a). Figure 12(b) shows the results of the detection of fish to be analyzed, namely the location of the centroid (red circle) and the contour (green line). Figure 12(c) shows the results of fish detection, which will be used to calculate the surface area and volume of fish. The result obtained in this case shows the centroid location (red circle), contour (green line), and bounding box in the stereo camera image. One example of the object experiment result is shown in Figure 12(b) and Figure 12(c). In this result, the image centroid for the left camera in pixels is (379,184), the center of the image for the right camera in pixels is (958,191), and the image center is for stereo cameras in pixels (671,187). The distance between the planes of the two cameras and the plane of pixels can be determined using this value.
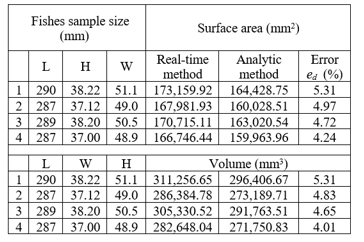
The 2D image coordinates (pixels) of the center of mass in a stereo camera are shown in Table 2. Table 3 shows the results of the 3D coordinates (mm). Based on experimental results for 3D coordinate measurements, the least distance error rate, as listed in Table 3, is at a distance of 550 mm. The distance between the stereo camera and the object will be adjusted to 550 mm to measure the surface area and volume of the fish. The results of using stereo-vision to measure the surface area and volume of four fish in real-time are shown in Table 4. In Table 4, the measurement results using the analytical method are used as a comparison to obtain the effectiveness of the proposed real-time measurement method.
Table 2: Image coordinate of the centroid point
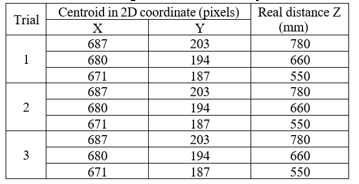 Table 3: Real-time measurement results of surface area and volume of four fishes
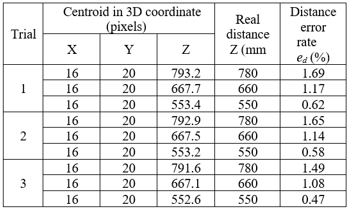 Table 4: Real-time measurement results of surface area and volume of four fishes
 5. Conclusions
A method for measuring fish surface area and volume in real-time using a stereo camera as a stereo-vision was proposed. The measurement process was done in real-time on the video frame. Image object segmentation is done first before measurement. The hue (H), saturation (S), and value (V) were separately segmented before they are combined. The result of this segmentation was the targeting object.
Experiment results show that real-time image segmentation of the proposed method had a good result. The experiments demonstrated that the calibration process could quickly detect the chessboard corners. After the calibration results, the focal lengths of the left camera and right camera were about 2.8289 mm and 2.8311 mm, respectively. The focal length difference between the two cameras was about 0.00221 mm. For desired object distances of 780 mm, 660 mm, and 550 mm, the distance error rate was less than 2% for both distances of 650 mm and 550 mm in three trial times. However, for 780 mm, the distance error rate was bigger than the two distances of 550 mm and 660 mm and was more than 3%. The 3D coordinate measurement results revealed that increasing the distance increased the distance error in the Z coordinate, which was caused by the camera’s vision field of view. As a result, a distance of 550 mm is used in the next analysis, which involves measuring the surface area and volume of the fish.
The surface area and volume of fish were measured by the proposed real-time measurement and compared to the analytic measurement method. Experimental results using a sample of four fishes show that the differences in surface area and volume were 4.24%~5.31% and 4.01%~5.01%, respectively. The process of real-time image segmentation, feature extraction, and measurement of fish surface area and volume takes about 0.0018 milliseconds. The results show that the proposed method can accurately measure the surface area and volume of fish in real-time.
The real-time image segmentation, 3D information, and measurement methods for surface area and volume proposed in this research could be applicable in fish recognition and sorting applications. The 3D information-based stereo camera could be applied to an automated fish processing system to handle fish on a conveyor belt.
The measurement method developed by this research can be utilized to automatically measure the surface area and volume of fish using stereo-vision. Furthermore, by employing this approach, measuring will become easy, faster, more effective, and efficient. The findings of this study can also be accustomed to other fields of research, such as real-time assessment of fruit product dimensions, fish sorting processes on moving conveyors, and moving goods robots.
Acknowledgment
This research was funded by PNBP BLU 2021, Sam Ratulangi University, Manado, Indonesia.
- E.S. Bridge, R.K. Boughton, R.A. Aldredge, T.J.E. Harrison, R. Bowman, S.J. Schoech, “Measuring egg size using digital photography: Testing Hoyt’s method using Florida Scrub-Jay eggs,” Journal of Field Ornithology, 78(1), 109–116, 2007, doi:10.1111/J.1557-9263.2006.00092.X.
- R. Badonia, A. Ramachandran, T. V Sankar, “Quality Problems in Fish Processing,” Journal of the Indian Fisheries Association, 18, 283–287, 1988.
- A. Getu, K. Misganaw, “Post-harvesting and Major Related Problems of Fish Production,” Fisheries and Aquaculture Journal, 06(04), 2015, doi:10.4172/2150-3508.1000154.
- D. J. Lee, X. Xu, J.D. Eifert, P. Zhan, “Area and volume measurements of objects with irregular shapes using multiple silhouettes,” Optical Engineering, 45(2), 027202, 2006, doi:10.1117/1.2166847.
- A.B. Koc, “Determination of watermelon volume using ellipsoid approximation and image processing,” Postharvest Biology and Technology, 45(3), 366–371, 2007, doi:10.1016/J.POSTHARVBIO.2007.03.010.
- S.M.A. Moustafa, “Theoretical Prediction of Volume, Surface Area, and Center of Gravity for Agricultural Products,” Transactions of the ASAE, 14(3), 549–0553, 1971, doi:10.13031/2013.38336.
- T.Y. Wang, S.K. Nguang, “Low cost sensor for volume and surface area computation of axi-symmetric agricultural products,” Journal of Food Engineering, 79(3), 870–877, 2007, doi:10.1016/J.JFOODENG.2006.01.084.
- F. Pla, J.M. Sanchiz, J.S. Sánchez, “An integral automation of industrial fruit and vegetable sorting by machine vision,” IEEE International Conference on Emerging Technologies and Factory Automation, ETFA, 2, 541–546, 2001, doi:10.1109/ETFA.2001.997731.
- J. Rantung, M.T. Tran, H.Y. Jang, J.W. Lee, H.K. Kim, S.B. Kim, “Determination of the Fish Surface Area and Volume Using Ellipsoid Approximation Method Applied for Image Processing,” Lecture Notes in Electrical Engineering, 465, 334–347, 2017, doi:10.1007/978-3-319-69814-4_33.
- J. Rantung, J.M. Oh, H.K. Kim, S.J. Oh, S.B. Kim, “Real-Time Image Segmentation and Determination of 3D Coordinates for Fish Surface Area and Volume Measurement based on Stereo Vision,” Journal of Institute of Control, Robotics and Systems, 24(2), 141–148, 2018, doi:10.5302/J.ICROS.2018.17.0213.
- ? ??, Q. Bao Truong, V. Huy Pham, ? ? ? Byung-Ryong Lee, H.-S. Kim, “Automatic Thresholding Selection for Image Segmentation Based on Genetic Algorithm,” 17(6), 587–595, 2011, doi:10.5302/J.ICROS.2011.17.6.587.
- H. Yao, Q. Duan, D. Li, J. Wang, “An improved K-means clustering algorithm for fish image segmentation,” Mathematical and Computer Modelling, 58(3–4), 790–798, 2013, doi:10.1016/J.MCM.2012.12.025.
- M.T. Tran, H.H. Nguyen, J. Rantung, H.K. Kim, S.J. Oh, S.B. Kim, “A New Approach of 2D Measurement of Injury Rate on Fish by a Modified K-means Clustering Algorithm Based on L*A*B* Color Space,” Lecture Notes in Electrical Engineering, 465, 324–333, 2017, doi:10.1007/978-3-319-69814-4_32.
- M.T. Tran, J. Rantung, T.H. Nguyen, H.K. Kim, S.B. Kim, “Measurement of injury rate on fish skin and performance comparison based on L*A*B* and HSV color spaces,” Aug. 2021, doi:10.1051/matecconf/201815902010.
- J. Wen, Q. Sun, Z. Sun, H. Gu, “An improved image processing technique for determination of volume and surface area of rising bubble,” International Journal of Multiphase Flow, 104, 294–306, 2018, doi:10.1016/J.IJMULTIPHASEFLOW.2018.02.004.
- B. Zhang, N. Guo, J. Huang, B. Gu, J. Zhou, “Computer Vision Estimation of the Volume and Weight of Apples by Using 3D Reconstruction and Noncontact Measuring Methods,” Journal of Sensors, 2020, 2020, doi:10.1155/2020/5053407.
- C.M. Sabliov, D. Boldor, K.M. Keener, B.E. Farkas, “Image Processing Method to Determine Surface Area and Volume of Axi-Symmetric Agricultural Products,” International Journal of Food Properties, 5(3), 641–653, 2002, doi:10.1081/JFP-120015498.
- A. Villordon, J.C. Gregorie, D. LaBonte, “Direct Measurement of Sweetpotato Surface Area and Volume Using a Low-cost 3D Scanner for Identification of Shape Features Related to Processing Product Recovery,” HortScience, 55(5), 722–728, 2020, doi:10.21273/HORTSCI14964-20.