Automated Hydroponic System using Wireless Sensor Networks

Adv. Sci. Technol. Eng. Syst. J. 7(2), 1–17 (2022);
 DOI: 10.25046/aj070201
Researchers have associated agriculture and food processing with adverse environmental impacts like; falls in the underground freshwater table, energy consumption, and high carbon emission. These factors have the worst effect on developing countries. Therefore, there is a need for on-demand food production techniques that require minimum resource utilization. For these reasons, scientists are now focusing their attention on hydroponics. Hydroponics is the process of growing crops without the use of soil. However, different components of the system need to be closely monitored and controlled. In this paper, we compared the performance of an automated hydroponic system using cluster-based wireless sensor networks against a multihop-based one. We used Simponics for the simulation. It is a simulator based on the OMNET++ framework. Simulation results show that both latency and energy overhead of the multihop network increases with the number of nodes. However, they stay constant on a cluster-based network.
1. Background
Hydroponics is the soil-less process of crop cultivation [1]. Modern hydroponic systems were dated back to 1627, albeit knowledge of plants’ essential nutrients has not yet fully developed [2]. Nonethe-less, scientists have been using this technique to study plants. In 2019, the hydroponic market was approximately worth 8.1 billion US Dollars, and it could reach up to 16 billion US Dollars by 2025
- Hydroponic systems are attractive because of the following advantages [1]: 1) No soil is required. 2) Crops grow faster in this technique than in traditional farming. 3) Neither location nor space is a constraint because nutrients and water are readily available, and plants can be grown vertically [4]. 4) The system also works indoors. Therefore, it is una ected by adverse climate conditions. 5) Also, pesticides and herbicides are not needed since plants are isolated.
Essentially, a hydroponic system has five main components as shown in Figure 1, these are: 1) the growing area is that area where the plants grow. It uses trays or a network of pipes that deliver nutri-ents to the plants. But, the plants need adequate spacing for proper growth and protection against infectious diseases. 2) The reservoir is a container that stores the nutrient solution used by the system. Electric pumps transport the nutrient solutions from the reservoir to the growing area. 3) The growing medium is the substrate on which the plants grow [5]. The growing medium substitutes the soil. It provides support and air to the roots [6]. Some prominent growing mediums are Rockwool, Coconut Fiber/Coconut chips, Grow Rock, and Perlite. 4) Light is necessary for photosynthesis. In indoor hydroponic systems, light-emitting diodes (LEDs) or other light sources of light provide lighting in place of the sun. However, greenhouse-based hydroponic systems use sunlight as a source of light for plants. 5) Finally, the plant that is to be grown is another component of the hydroponic system. In theory, all plants can be grown using hydroponic systems. However, some plants are di cult to grow using hydroponic because of the expenses involved.
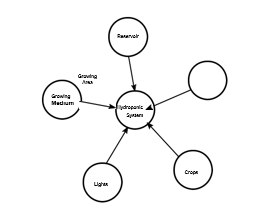 Figure 1: Components of a hydroponic system
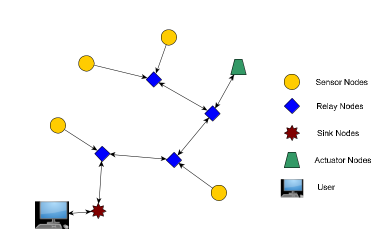 Figure 2: A typical Wireless Sensor Network (WSN)
In large-scale systems, the hydroponic system’s components require more maintenance than traditional farming techniques. Au-tomation is necessary to reduce maintenance costs and ensure ef-ficiency. One of the avenues investigated by scientists is the use of wireless sensor networks. A Wireless sensor network (WSN) is a network of limited resources (such as processor, memory, en-ergy) computing devices equipped with sensors for fine-grained sensing of their environment [7]. WSN finds application in preci-sion agriculture, military, health-care, and manufacturing industry [8, 9, 10, 11].
Figure 2 shows a typical WSN. It consists of Sensor nodes, Relay nodes, actuators, Sink nodes, and workstations. The sensor nodes are responsible for sensing the environment. The sensors usu-ally connect to a computing device such as a microcontroller. The microcontroller processes the signals it receives from the sensors. Also, the sensor node has a short-range (typically 100 m) transmitter that sends the sensed data to the sink node. Since the sensor node is short-ranged, there is a possibility that it cannot reach the user. Therefore, a relay node is necessary to forward information to the sink node. The sink node is the gateway that connects the WSN to the outside world. It connects to a workstation or the cloud. The user/network administrator accesses the WSN’s data through the workstation for storage and further analysis. The sink node also receives information from the user, such as commands to the actua-tors in the sensor networks. An actuator converts information into action, thus manipulating the environment. For example, actuators can open or close a valve, turn on or o lights, and the like.
1.1. Motivation
Green Farm [12] is a small desktop hydroponic system designed for growing vegetables at home. The system consists of a growth tray, nutrient reservoir, light-emitting diodes (LEDs) for lighting, and a ventilator fan. The microcontroller controls the lights and fans
- Many other similar desktop hydroponic systems are widely available in the market [14, 15, 16]. There are attempts to automate greenhouse-based hydroponics systems: Saaid et al. [17, 18] devel-oped an automatic pH control system for deep water culture (DWC) hydroponics. The pH level of the nutrient solution must be in a certain range to ensure healthy crops. The system uses an Arduino Mega 2560 microcontroller to control the pH level of the system.
The user inputs the appropriate pH level via a keypad. Then, the microcontroller compares the reference pH with the value obtained from the pH sensor. The system uses two tanks, one for acid and another for a base solution. Control valves control the pH level of the nutrient solution in the reservoir.
However, the technique is not scalable because of the large number of wires required to connect the hundreds of sensors for the system. It will also lead to an increase in energy consumption. Moreover, there is redundancy in the data sent to the user, which may overwhelm the user’s workstation. These problems can be solved using WSN.
Unfortunately, there are few papers on the deployment of WSN in hydroponics. Figure 3 summarizes the findings of our survey paper [19]. Our findings have shown us that only 13% of the papers we studied are related to WSN. Moreover, none of the papers investi-gated the impact of scalability and energy harvesting on WSN-based hydroponic systems. We believe it is because the papers use proto-types for their analysis, which makes investigating scalability too expensive and technically di cult. Hence, we develop a simulator that will enable users to investigate energy harvesting and scalability of WSN-based hydroponic systems. Subsection 1.2 discusses the contribution of the paper in details.
1.2. Contributions and Content
In this paper, we proposed a WSN-based automated hydroponic system. It has the following contributions:
- We developed an automated hydroponic system using clus-tered WSN. The clustering technique allows the system to scale up by grouping all sensors in one greenhouse under one cluster head (CH).
- We (to the best of our knowledge) proposed the first use of ultra micro-hydro-turbines (UMHT) [20] for the energy harvesting in WSN applications.
- Also, a two-level energy harvesting technique is proposed. First, solar energy is harvested from the sun to power the submersible pump, ventilator fan, sensors, and actuators in the reservoir. The sensor nodes carry out the second level of energy harvesting. They scavenge energy from the flow of nu-trient solution using UMHT or excess light in the hydroponic system using mini-solar panels [21].
- We also used data aggregation to reduce energy consumption and transmission delay due to tra c. The sensors measure environmental conditions such as temperature and humidity. These parameters do not vary widely from one location to another. Therefore, a function can be derived to calculate the temperature and humidity of any position in the greenhouse.
- We also developed an OMNET++ based simulator named “Simponics”. It enables the study of hydroponic systems. The modular simulator allows users to investigate the performance of the hydroponic systems when scaled either vertically or horizontally. Furthermore, users can add new sensors, actua-tors, and transmitters.
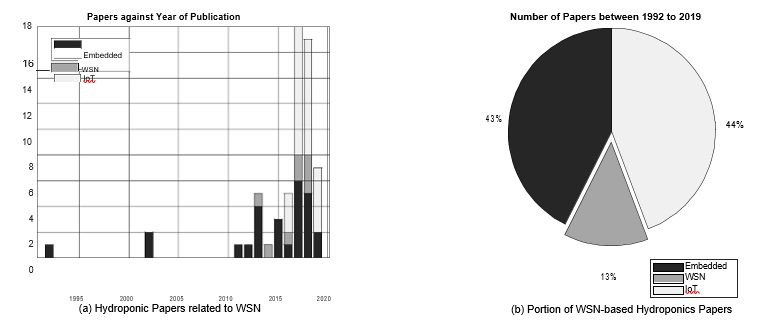 Figure 3: Experimental Setup for the proposed hydroponic system with Two Sensor nodes
The remaining parts of this paper are as follows: Section 2 presents state-of-the-arts hydroponic automation techniques avail-able in both the literature and the industry. Section 3 provides a detailed description of the proposed system. Section 4 describes the experiments and simulations carried out and analyzes the results obtained from the two. Section 5 concludes the paper and presents future works in the research.
2. Literature Review
Figure 1 shows a traditional hydroponic system. It consists of all the five components mentioned in Section 1. The technique for deliver-ing the nutrients’ solution to the growth tray determines the type of hydroponic system. Table 1 shows the di erent types of hydroponic systems currently available. Except for a non-reversed version of a drip system (in which excess nutrient solution in the growth area is allowed to evaporate), the remaining hydroponic systems require nutrients to be renewed or replenished biweekly [22]. However, this is not the only chore needed for a successful hydroponic system. One must ensure that; the pH is between 5.5 and 6.5 [23], the pumps are working, the pipes are not blocked, the nutrient solution is cir-culating, the optimum temperature is stable, and there is adequate lighting (if the system is indoors) [24]. Furthermore, farmers are not used to these kinds of farming systems. Therefore, they must learn how to farm as well as maintain the hydroponic system.
In a nutshell, hydroponic systems are not as scalable as tradi-tional farming [26] because of the immense care they need. But, researchers noted that automated hydroponic systems minimize sys-tem maintenance costs. Thus, increasing its sustainability. Initially, researchers started developing solutions using computer systems: Some authors [27, 28] monitor ions in the nutrient solution. The systems use an array of ion-selective electrodes. However, the nu-trient mixture sub-system is not automated. They also ignored the temperature and PH of the solutions. Both parameters are also nec-essary for growing healthy plants. Thus, scaling up such systems will be a di cult task. To reduce energy consumption and improve flexibility, re-searchers chose embedded systems. As mentioned in Section 1, the researchers in [17, 18], used an Arduino Mega 2560 microcon-troller and a pH sensor to monitor the pH level of a Deep Water Culture (DWC) hydroponic system. They then inject acid or base to control the acidity or alkalinity of the nutrient solution using electric valves. In [29, 30] an electric conductivity (EC) sensor, a water temperature sensor, and a water level sensor were added to increase sustainability and e ciency. The level sensor prevents the nutrient solution from spilling out of the reservoir. Charumathi et al.
- added a humidity sensor and an LCD screen to improve plant nutrient uptake and system control for the farmer, respectively. In addition, the system allows the farmer to switch between manual to automatic modes. Nalwade and Mote [32] replaced the LCD screen with a GSM module so that farmers get SMS on the status of the hydroponic system.
Alas, the embedded types of automated hydroponic systems are not scalable because of the energy consumption incurred by many sensors and the maze of wires connecting them. Moreover, main-tenance and diagnostics di culty will increase when the number of sensors and microcontrollers increases. To increase the harvest, farmers must scale up the hydroponic system. As such, researchers use the Internet of Things (IoT). IoT is a connection of network-enabled computing devices (i.e., things) to the Internet for data acquisition, communication, and processing [33]. The advantage of using IoT is that it allows the integration of numerous sensors into the system via the Internet.
For example, Siregar et al. [34] proposed an Arduino Uno-based monitoring system for an indoor hydroponic system for lettuce, red spinach, and mustard pak choi plants. They used a combination of Open Garden Shield (OGS) and Open Garden Hydroponics (OGH) [35, 36]. The OGS is an Arduino extension board consisting of a
Table 1: Types of Hydroponic Systems in the Literature
| S/No. | Hydroponic | Nutrient delivery | Advantage | Disadvantage |
| type | ||||
| 1 | Wick | Plant’s root take in the nutri- | 1) The roots have access to | The system delivers small |
| ents via a wick. | both nutrients and air. 2) It is | quantity of water, which may | ||
| easy to maintained. | starve some plants. |
| 2 | Deep | Wa- | A growth tray floating on |
| ter | Culture | nutrient solution on top of | |
| (DWC) | which the plants are sown. | ||
- The system is good for plants that require a lot of wa-ter. 2) It is easy to maintain.
- The plant’s root have lit-tle or no access to air. 2) It is also prone to fluctua-tions in pH and nutrient con-centration in small-scale sys-tems, which causes health problems for the plants.
- Encourages more nutrient uptake in the plants.
PH sensor, water temperature sensor, Electric Conductivity Sensor, Light Sensor, ambient temperature, GSM / GPRS. A GSM shield sends the data from the sensors to a remote server. For simplicity, small-scale hydroponics come assembled. Moreover, a desktop automated hydroponic system using IoTtalk [37] was developed in [38, 39]. IoTtalk is an IoT platform that manages reconfigurable multi-sensor devices known as MorSensor over the Internet[37]. The systems allow hobbyists to manage hydroponic systems with-out much experience of how they work. Admittedly, these systems are not suitable for large-scale agriculture.
Therefore, Lakshmiprabha et al. [40] used ThingSpeak. ThingS-peak is like IoTtalk; it is an IoT platform that manages sensors through a remote server in the cloud [41]. The system monitors wa-ter level, humidity, and temperature with the help of Rasberry Pi 3 B+ and Field-Programmable Gate Array (FPGA). Also, Crisnapati et al. [42] developed a larger model of the system. The system is modular. Thus, allowing for easy maintenance. However, the sys-tem relies on communication with a server that may not be available all the time. Also, a fixed threshold may not be optimal, since the need and consumption rate of the plants’ change as they grow. Since IoT-based hydroponic systems are known to have heterogeneous sub-systems, the researchers in [43, 44] proposed an IoT-based hy-droponic system using publish-subscribe middleware over MQTT protocol. The use of middleware allows heterogeneous sub-systems’ seamless interoperability. Since the system connects to the Inter-net, then cybersecurity is essential [45]. Therefore, they integrated TLS/SSL to encrypt MQTT packets.
However, some researchers argue that wireless sensor networks (WSN) are a better solution for developing countries because of their low cost and resilience [48]. The concepts (i.e., WSN and IoT) could be quite confusing, even though this paper has defined both technologies. For clarity, Table 2 compares and contrasts WSN and IoT [46]. The most important part of WSN-based network design is the choice of a suitable transmission protocol that will ensure low latency and energy consumption. One of the most widely used WSN protocols is Zigbee [49]. Kalovrektis et al. developed
Table 2: Comparison between WSN and IoT [46].
| S/No. | WSN | IoT |
| 1 | Network coverage is confined within a local area. | Aided by the Internet, the network coverage is wide. |
| 2 | The Network is self-organizing | Nodes either access the network independently or as |
| determined by the backbone. | ||
| 3 | Networks must have a limited number of nodes. | Network supports unlimited number of nodes. |
| 4 | Data is only processed by end nodes and aggregator | Data is processed by all nodes.z |
| nodes. | ||
| 5 | Higher energy management capabilities than IoT. | Lower energy management compared to WSN. |
| 6 | Low level of heterogeneity. | High level of heterogeneity. |
a Zigbee-based real-time smart hydroponic system. The system’s performance is satisfactory. But, its performance degrades when the sensors are far from the control station.
Recently, Prabha et al. [50] developed a Zigbee-based aquapon-ics monitoring system. An aquaponics system is a hydroponic system that gets its nutrient from fish waste in a nearby aquarium
- The system consists of Zigbee end nodes and a gateway. Each end node contains a PIC16F877A microcontroller, which collects data from the sensor connected to it. A Zigbee transceiver sends the data to the control station, while the microcontroller uses the data to control the aquaponics through some actuators. For example, the system uses information from the Light Dependent Resistor (LDR) to decide when to switch on the light via a relay switch; it also uses the data from the temperature sensor to deduce when to turn on the cooling fan; lastly, the microcontroller uses the data from the ammonia, chlorine and pH sensors to determine when to turn on the pump or replace the water in the system.
Based on the knowledge we gathered from our survey [19], the WSN monitoring and control systems in the literature are not scal-able. They lack energy harvesting, which ensures the sensor nodes do not run out of energy. Also, they lack data aggregation, which reduces redundant tra c in the network. Finally, they lack network clustering, which also reduces tra c.
Granted, IoT systems are scalable. However, they require infras-tructure that will enable access to the Internet. Such infrastructure is unavailable in most rural areas in developing countries. Unfority, self-configuration, and recovery from failure make it the right technology for deployment in remote areas [53].
Another study quantifies the e ect of desalinated seawater on soil-based cultivation and hydroponic systems [54]. They also in-vestigated their energy consumption and greenhouse gas emissions. They found that the use of NFT increases energy consumption ir-respective of the water source. Additionally, there is a significant increase in greenhouse gas emissions compared to soil cultivation. However, the yield is higher [54]. The researchers only compared energy consumption and gas emission of desalinated water in hy-droponic systems. Other parameters like temperature and pH were not studied. Thus, our research aimed at bridging this gap. We want to investigate the overhead of sensors in both cluster-based and multihop-based networks.
3. Proposed System
Figure 5 shows the proposed system. We viewed the deployment of the WSN from two perspectives: (1) how the nodes were deployed in the greenhouses as shown in Figure 5a, and (2) how the deployed nodes from the di erent greenhouses communicate with one another to send data to the workstation (see Figure 5b).
3.1. Greenhouse
tunately, these are where most farmers reside. Therefore, using Firstly, in each of the greenhouses, the sensor nodes were deployed IoT is not a viable solution in such areas. In rural areas where as shown in Figure 5a. Our proposed system is a modified NFT infrastructure is unavailable, the cost of installation, maintenance hydroponic system. We chose NFT because it requires no growing (e.g., internet subscription), and system management are arduous medium, timer, and air pump [19]. Thus, the system consumes if not impossible for the farmers. In 2019 a study was conducted less energy while maintaining good plant health. The NFT uses to understand the economic viability of investment in hydroponic perforated pipes for the growth area. It also uses a light-emitting systems, especially in emerging countries. The finding suggests that diode (LED) and a reflector as a light source. Then, a submersible before an investor ventures into hydroponic systems, they need to pump delivers the nutrient solution from the reservoir to di erent consider high initial costs. Secondly, he must factor in the expense parts of the system. A rechargeable battery is used to power the of monitoring the system a specialist [52]. This paper aims to bridge pump and the LED. The system uses solar panels to charge the the gap between these two risk factors through WSN automated battery. As shown in Figure 5a, There are two solar panels; primary hydroponic systems. We do believe that WSN is a viable solution and secondary. The earlier provide energy to the LEDs and pumps, for hydroponics automation in developing countries. Its reliabil- while the latter connects to the sensor nodes for energy harvesting.
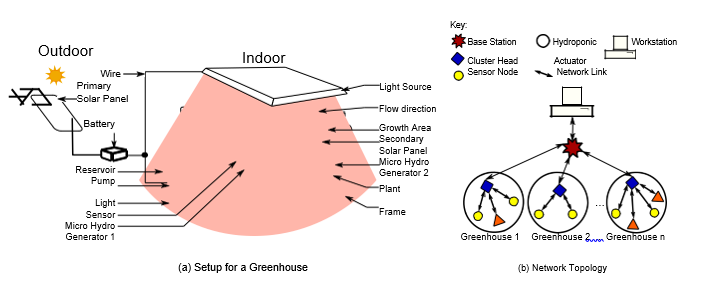 Figure 5: Setup for the proposed hydroponic system
The sensor nodes measure temperature, humidity, electric con-ductivity (EC), and pH. The sensor nodes use mini-solar panels [21] to scavenge the excess light from the growth area. Only the light that falls on the leaves helps in photosynthesis. Therefore, the light that falls elsewhere is a waste. Hence, the mini-solar panel converts the wasted light energy into electrical energy. Thus, improving the e ciency of the system. We call them secondary solar panels be-cause they feed on the unused light energy drawn from the primary solar panel. Another source of energy wastage is the kinetic energy and the potential energy of the nutrient solution pumped by the sub-mersible pump. We used ultra-micro-hydro turbines (UMHT) [20] to harvest the kinetic and potential energy of the moving fluid. A UMHT is a credit card-sized turbine that converts fluid’s mechanical to electrical energy. The sensor nodes sense the environment and forward the data to a base station (BS). The BS then sends the data to a workstation. The workstation serves as the control center where the network administrator can monitor the hydroponic systems.
3.2. Network
nodes will sense the environment and forward the results to the CH. The CH gathers the data from the di erent sensor nodes, aggregates them, and forwards the aggregated data to the BS. Note that the CH and the BS do not go to sleep to avoid data loss.
Secondly, Figure 5b shows the network topology of the proposed system. In the figure, each of the greenhouses has several WSN nodes deployed. The number and type of nodes depend on the requirement of the greenhouse. A small greenhouse will have fewer sensor nodes. Also, greenhouses that use DWC will have few or no actuators since they do not have pumps and valves. Each greenhouse has a cluster head (CH). The CH is responsible for collecting data from other nodes in that greenhouse and forwarding them to the BS. The BS then sends the data to the workstation.
The sequence diagram in Figure 6 shows how the proposed system’s network works. It shows that the sensor nodes go to sleep for a predetermined period (n sec). The sleep period depends on the tolerance of the plants towards changes in the environmental parameters. Tagle et al. [55] took measurements every 5 mins. For fine-grain sensing, our proposed system wakes up every 60 s to sense the environment. The system takes 6 s to complete the sensing session because the slowest sensor is the humidity sensor, which takes 6 s to complete its reading [56]. Whenever they wake up, the
The CH carries out the Data aggregation. Data aggregation is a process for gathering data and summarizing it to reduce data redun-dancy [57]. For data aggregation of the temperature and humidity, the system uses mean and standard deviation as shown in Equation 3 and 4, respectively. We chose the mean and the standard deviation because we are interested in how the temperature and humidity vary across the greenhouse. The pH and EC are only measured at the nutrient reservoir because the movement of the solution through the system keeps the nutrient composition homogeneous. Therefore, there is no need for data aggregation for these data. For a given environmental parameter like temperature, the system uses Equation 1 and 2 to calculate the sum and the sum of squares, respectively. After the summation of all temperature values from all the sensor nodes, the mean and standard deviation are calculated according
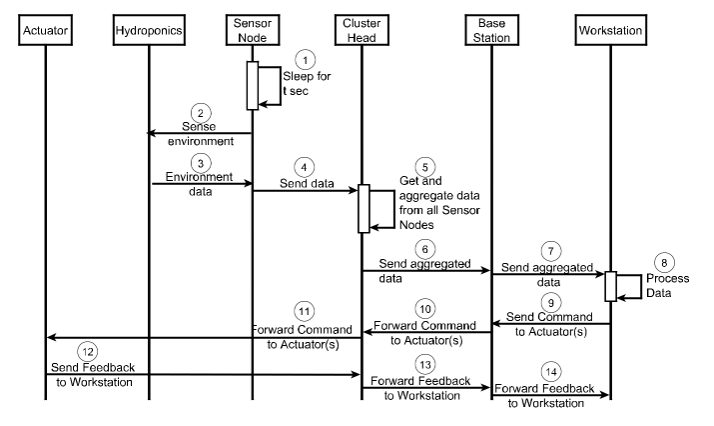 Figure 6: Sequence Diagram of the Proposed System
Algorithm 1 describes how the CH aggregates data it obtains from its children. Each of the j sensor nodes in a greenhouse mea-sures i di erent environmental parameters. The sensor nodes wake up every 60 s and sense the environment. Then the data they obtain is forwarded to the CH. Line 6 shows that the CH extracts the en-vironmental parameters from each packet it receives. Each of the parameters’ values and the square of the values are separately accu-mulated with the respective parameters of the other sensor nodes as shown inline 7 and 8 respectively. For example, if the temperature is the first parameter, then s1 and ss1 are the accumulated sum and sum of squares of the temperature from all j sensor nodes. Then the accumulated sum and sum of squares is s2 and ss2 if humidity is the second parameter. The same goes for the remaining i parameters. The CH knows the number of its children (n) in the cluster. Thus, it knows when it has gathered all the data from all sensors (see inline 3). Then, the CH uses the value of n to calculate and of each parameter from s and ss. However, this is only possible when the CH receives all the data from the nodes in its cluster. As shown in line 12 and 13, and are calculated for each of the i parameters using Equation 3 and 4, respectively. In the end, the CH obtains i number of means and standard deviations. The CH then forwards them to the BS, who then forwards them to the workstation.
The CH sends the aggregated data to the BS. The BS then for-wards the aggregated data to the workstation. The received data is processed, and the system uses the results to control the environ-ment. For example, if the temperature is high, the system sends a command to the actuator(s) to start the cooling fans to improve air circulation and lower the temperature. As shown in Figure 6, the workstation sends instructions to the controllers through the BS and the CH. Whenever an actuator receives a command, it responds with its state (e.g., on/o or open/close) as feedback to the workstation. It allows the user/administrator to know what is happening in the given greenhouse. The actuator sends its response to the workstation through the CH and then the BS. Currently, our proposed simulator has no actuators. However, they can be added by users, depending
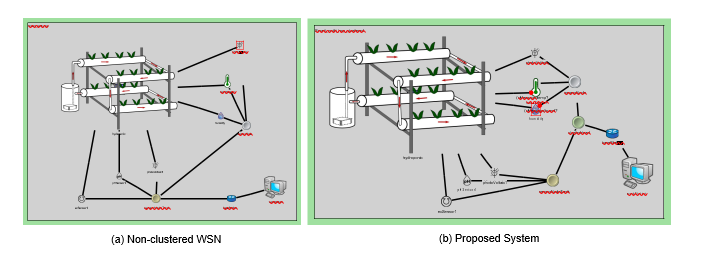 Figure 7: Experimental Setup for the proposed hydroponic system with Two Sensor nodes on the scenario.
4. Discussion of Results
Simponics++ is an OMNET++ based simulator we developed to investigate the performance of our proposed hydroponic system. OMNeT++ is an object-oriented library and framework for devel-oping a discrete event- and a modular network simulation based on C++ programming language [58]. The word “network” means any system that consists of the interconnection of sub-systems. Ex-amples of such networks are; queueing networks, communication networks, and on-chip networks. The OMNET++ framework is modular, which means that simulators can be developed by model-ing the sub-systems independently and then connecting them like LEGO blocks to form a complete system. Therefore, users can easily modify our simulator to add, edit, or delete components (or sub-systems) such as growth areas, sensors, actuators, transceivers, and others. Simponics++ is available on GitHub for modification and this experiment’s reproduction [59].
Figure 7 shows the experimental setup for the proposed system. On the left, in Figure 7a, is a typical non–clustered WSN. It con-sists of two sensor nodes; the one at the top reads the temperature and humidity of the greenhouse, while the other (at the bottom) is connected to the nutrient reservoir to measure the pH and electric conductivity (EC) of the nutrient solution. The network uses the shortest path first technique to transmit data to the base station (BS): the sensor at the top of the diagram sends its data to the node at the bottom because it is closer to the BS. This node then sends the data to the BS on behalf of the sensor node at the top. We use the non-clustered network as a control experiment to compare with the proposed system. The performances investigated are the energy consumption and latency of the network. The energy consumption rate of the components determines how long it monitors the hydro-ponic system without the network shutting down. The latency of the network determines the agility of the system in reporting and responding to changes in the environment, such as pH, temperature, light, and nutrient availability.
On the right is Figure 7b, which shows the proposed system.
The figure shows a cluster-based WSN with two sensor nodes: the one at the top reads the temperature and humidity of the greenhouse, while the other (at the bottom) is connected to the nutrient reservoir to measure the pH and electric conductivity (EC) of the nutrient solution. Both sensor nodes take readings of the environment. They send the data directly to the cluster head (CH). The CH then ag-gregates the data from both of the children before sending the data to the BS. The BS then sends the reading to the workstation for analysis, as explained in Section 3.2.
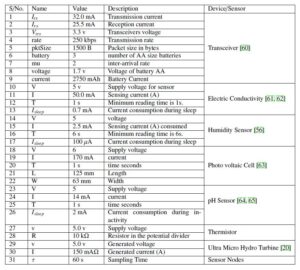
Table 3 shows the simulation parameters used in all the simu-lations in this paper. The table’s columns show; the name of the variables as coded in the simulator, the value for the variables, a description of the variables, and the device or sensor to whom they belong. Also, we have provided all the simulations carried out in this paper on GitHub [59]. We set parameters for the di erent sen-sors from their respective datasheets. The transceiver is a Zigbee sensor mote whose characteristics are in [60]. The thermistor is a variable resistor whose resistance changes with the temperature. In this paper, the thermistor is NTC 10k [66]. We derive Equation 5 from the table in [66]. It determines the resistance of the thermistor (Rth) when given its temperature (T ).
Concerning the photovoltaic cells, there is a need for solar irra-diance from which the cells will harvest energy. We model the solar irradiance in this simulation from the month of October in Nigeria, as reported in [67]. From the paper [67], Equation 6 is developed, where t is time in hours in the 24-hour format and fs(t) is the solar irradiance in W=m2.
We carried out four experiments to investigate the energy and latency performances of the proposed system. Figure 8 shows the topologies of the experiments. The experiments were set up in Simponics++ as follows:
Table 3: Parameters for the Simulation
A two (2) node non-clustered WSN developed. One of the sensor nodes (SN) senses temperature and humidity and sends the data to the BS through the other sensor node (SNT). The BS then sends the data to the workstation. The sensor node connected to the tank is known as SNT. It senses the pH and electric conductivity (EC). It forwards sensed data to the BS, which then sends it to the workstation. Figure 8a shows the topology of the experimental setup.
- In the second experiment, two more sensor nodes; SN1 and SN2. Both sensor nodes added are of SN type, meaning that they sense temperature and humidity. Figure 8b shows the topology of the setup for this experiment: SN2 sends its data to the BS through SN1, then SNT, while the SN1 sends its data to the BS via SNT. However, SN forwards its data to the BS in one hop. Whenever the BS receives a packet, it for-wards it to the workstation immediately for data processing.
- The third experiment is the proposed system. The system consists of two sensor nodes SN and SNT, similar to the ones in (1) above. Figure 8c shows the setup. Both sensor nodes send their data to the cluster head (CH). The CH waits until it gathers and aggregates all information. Then it forwards it to the BS, which then forwards it to the workstation for further processing.
- In the final experiment, the number of nodes in the clustered network of the proposed system was increased to four, as shown in Figure The network consists of three sensor nodes of type SN, labeled SN, SN1, and SN2. Also, there is one SNT sensor node connected to the tank to sense pH and EC, like in the experiment (3) above. All nodes send their data to the CH. The CH aggregates all the data into one packet and sends it to the BS. Finally, the BS sends it to the workstation for data analysis.
We repeated the experiments with solar panels installed in all nodes (except the workstation). The solar panels installed on the nodes are secondary (small size). They scavenge the light energy that missed the leaves.
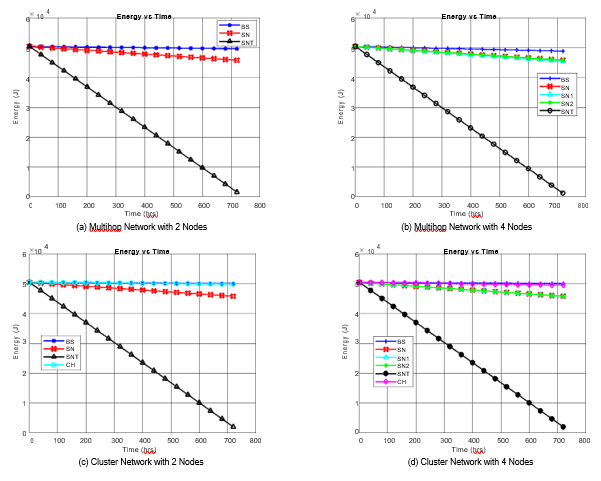 Figure 9: Energy of the Proposed System over a Period of 30 Days
supports the simulation results that argue the relationship between energy and time is approximately linear. The derivation for this model is available in Appendix 6. Also, the model agrees with the simulation on the y-intercept being Etotal and slope determined by (2N + + 1)Etrx= + Pss. The slope is the energy consumption rate and is proportional to the number of children nodes, the energy con-sumption of the sensors in the node (be it sleeping or sensing). Also, it is inversely proportional to the sampling period . In general, the energy consumption for the sensor nodes in the clustered network is less because N = 0, meaning no sensor node has the overhead of forwarding another sensor node’s data. Therefore, we are left with ( + 1)Etrx= + Pss. The reduction is not well pronounced because of >> N. It means that the sensor nodes consume the same energy regardless of the size of the network in the clustered network, as opposed to the non-clustered network, where the energy consumption rate of any given sensor nodes increases by 2NEtrx= whenever the number of children (N) for that node increases.
Second, the energy consumption of the sensor node at the tank (i.e., SNT) is by far more than the energy consumption of any other node in any case. It is due to the energy consumption of the EC sensor, which consumes 250.0 mJ of energy when sensing data from the environment, compared to the 4.25 mJ of energy consumed by the humidity and temperature sensors (combined). To accurately verify this claim, we compare the energy consumption rate of SN and SNT in the case of the clustered network, since they are N = 0. From Figure 9c, we obtain the slope of SNT and SN. We get 0.0185 J s 1 for the SNT and 0.0013 J s 1 for SN. It means that the SNT sensor consumes 14 times more energy than SN. Therefore, low power sensor nodes are necessary for a sustainable and scalable smart hydroponic system.
The third observation is that if the same system changes from non-clustered to clustered, the energy consumption at the BS dras-tically falls. Thus, extending the life of the network. Note that if the BS is dead, the network becomes useless. The clustered net-
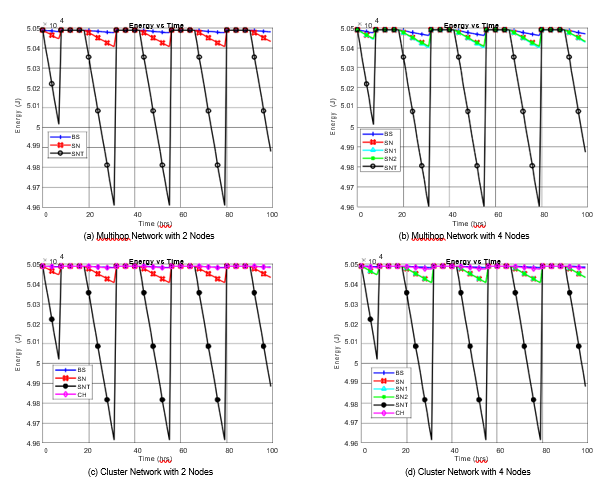 Figure 10: Energy Consumption Sensor Nodes with Energy Harvesting over a Period of 30 Days
The energy consumption experiment is repeated with energy harvesting as shown in Figure 10; we added a 125 mm by 63 mm solar panel to the sensor nodes, cluster heads (CHs), and the base stations (BSs). The solar irradiance is modeled after the solar energy available in Nigeria in the month of October [67]. The experiment tries to answer the question, “Is energy harvesting going to sustain the networks?”. For the solar panel to su ce, it must satisfy Equa-tion 12, where fs(t) is the solar energy per unit area produced during the day, A is the surface area, and E(t) is the energy consumed in 24 hours (i.e., day and night) by the sensor node. Since the area of the solar panel is 7:875 10 3 m2. Then the sensor node must not consume more than 58.06 Wh or approximately 209.02 kJ per day as expressed in Equation 12.
Clearly, Figure 10 shows that the solar panels quickly replenish the energy consumption of both clustered and non-clustered net-works. It is because the energy consumed by the sensor nodes does not exceed 209.02 kJ daily. The daily energy consumption of the SNT, which has the most energy consumption, is only 900 J daily. Thus, the solar panel replenishes energy consumed as early as the first two hours after sunrise. Then, the sensor nodes consume energy directly from the solar panels, never to use the battery again until sunset. Then the solar panel replenishes it in the morning. This consume-replenish cycle is evident in the figures. However, in all sub-figures in Figure 10, the energy consumption of the first cycle is followed by subsequent identical cycles. It is because the simulation starts at 0000 hours in the morning. Thus, in the first cycle, the sensor nodes use the battery energy for six hours only. Then, it is quickly replenished two hours after sunrise. The following day
4.2. Latency
the sun sets at 1800 hours. Hence, the nodes use the battery for 12
Latency of Packet from Sensor Nodes to BS and CH hours rather than the six hours the previous day. Thus, the sudden increase in energy consumption of the battery in other days after the first.
Figure 11 zooms in on the waveform for 24 hours. We chose the second day because the energy consumption is more than the first, as we have seen earlier. The sub-figures are in two columns. The left row shows the behavior of sensor nodes in the multihop network (both 2 and 4 sensor node networks), and the right column shows the behavior of the clustered network. In the first row, Figure 11a and 11b show the energy consumption of the BSs in the di erent experiments for the multihop and the clustered network, respec-tively. Figure 11a shows that the energy consumption increases with an increase in the number of sensor nodes. But, in the clustered network in Figure 11b, the energy consumption is independent of the number of sensor nodes in the network. This observation is in line with the prediction of Equation 11. All the BSs in the clustered networks consume equal and less energy because the CHs behave like their regional BS. By gathering data and aggregating it, the CH reduces N several transmissions to one. Thus, reducing the work-load of the BSs. Equation 14 shows an approximation of the saved energy. It shows that one can save more energy by putting more nodes in a cluster while keeping a low number of CHs. However, the cluster heads consume almost the same amount of energy as the BS of the non-clustered (multihop) network because the CH manages the same number of nodes as the BS in the non-clustered network. Nevertheless, the clustered network continues to work even if a CH is dead. In some implementations, the sensor nodes vote for another CH.
The energy consumption of the sensor nodes is the same in both cases as shown in Figure 11c and 11d, except for the sensor node SN1. SN1 consumes more energy than the others because of the overhead due to its child SN2. This instance shows that the clustered network helps the sensor nodes in the network to conserve energy since they do not have any children to incur overhead on them. However, it is noteworthy that the energy overhead due to forwarding data (receiving and transmitting to the next hop) is ap-proximately 9.11 mJ. It is less than the energy consumption of the sensors. It is evident in Figure 11e and 11f; even though the SNT nodes in the multihop network have children, their overhead is not evident because of the energy overhead of the EC sensor. Thus, the two figures look identical despite the packets the SNT sensor nodes forward. In a nutshell, all the sensor nodes replenish their energy and switch to using the solar panel for at least 10 hours before switching back to the battery daily.
Another matter of great importance in WSN-based hydroponic systems is the latency of the system — how fast does the network report an event? Latency is the time it takes data to reach the BS from a sensor node. Monitoring plants’ health is a time-sensitive matter. Therefore, the system’s latency provides an insight into the scalability of both the cluster-based and the multihop-based WSN. We carry out some experiments to investigate the latency of the two systems. Figure 12 shows the latency of the di erent experimental setup: We label the latency of the CH to BS in a two sensor node network as “Clustered BS 2”. Therefore, “Clustered BS 4” means CH to BS latency of a clustered network with four sensor nodes in the cluster. Similarly, the latency of sensor nodes to CH in two sen-sor nodes per cluster and four sensor nodes per cluster are labeled “Clustered CH 2” and “Clustered CH 4”, respectively.
Regarding the latency of the multihop network, we label them as; “Multihop 2” and “Multihop 4”, which represent the latency of a multihop network with 2 and 4 hop networks, respectively. In the multihop network, the maximum latency depends on the latency of the longest route to the BS as shown in Equation 16. However, the latency of the clustered network remains the same. The sensor nodes in the network forward its data to its CH, who then forwards the packet to the BS. Therefore, the latency of a clustered network is equivalent to the time it takes data to move two hops, as shown in Equation 15.
Thus, the clustered network is more scalable since the latency remains the same with an increase in the number of sensor nodes. Nonetheless, the latency of the multihop network increases linearly with an increase in the size of the longest route. Therefore, the latency can only become high in the case of an industrial-scale auto-mated hydroponic system with thousands of sensor nodes. Similarly,
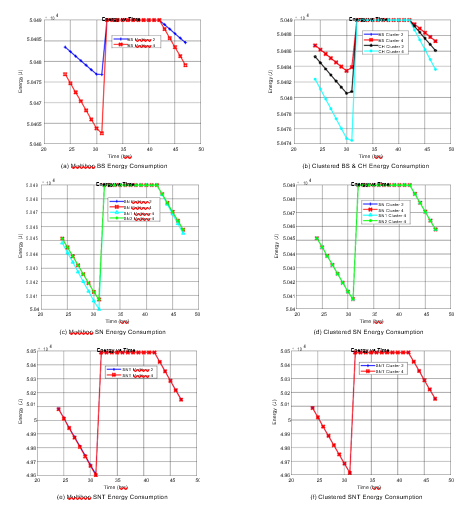 Figure 11: Energy Consumption Sensor Nodes with Energy Harvesting over a Period of 30 Days
the energy consumption of the sensor nodes in the clustered network is constant regardless of the number of nodes in the network. But, the CH’s energy consumption increases linearly with the number of nodes. Since there are few CH in a network, one can solve their energy overhead problem by providing more energy sources. How-ever, for the multihop network, the energy consumption increases for all nodes that have children. Therefore, it is too expensive to provide more energy sources to the sensor nodes while maintaining
5. Conclusion and Future Works
In this paper, we simulated both cluster-based and multihop WSN on an NFT hydroponic system. Within the limits of experimental errors, we were able to conclude that, clustered network helps to develop a scalable hydroponic system because the clustered network saves approximately 2NEtrx(1 CH=N)= of energy compared to the multihop, where N is the number of sensor nodes and CH is the number of cluster heads, and Etrx is the energy of the during trans-mission. Also, the latency of the clustered network is approximately equal to the time it takes a packet to move two hops. But, it increases with an increase in the path length for the multihop network. In the future, we shall add the plant growth model, fluid mechanics for the flowing nutrient solution, and nutrient consumption rate of di erent plants. We shall investigate how IoT and WSN could alle-viate the contemporary hydroponics problems such as; maintenance cost, installation cost, plant disease detection, and plant disease prevention.
6. Derivation of a Model for the Proposed System
The instantaneous energy consumed (E(t)) by the sensor node is the sum of:
- Energy consumed by sensors during sensing (Es).
- Energy consumed by sensors while sleeping (Esleep), when sensor node is not sensing the environment.
- Energy consumed by the sensor node during transmission of data (Etr).
- Energy consumed by the sensor node when forwarding data from N number of children (E f ).
Other parameters are:
- Initial Battery Energy (EInit).
- Energy Consumed by the Sensor Nodes (ES N ).
- Power consumed during sensing (Pss).
(+ (1 + 2N)) Etrx + Pss
Conflict of Interest
The authors declare no conflict of interest.
Acknowledgment
The authors would like to thank the Tertiary Education Trust Fund (TETFund), Yobe State University (YSU) Damaturu Nigeria and King Fahd University of Petroleum and Min-erals (KFUPM) for their support in this research.
- T. Baras, DIY Hydroponic Gardens: How to Design and Build an Inexpensive System for Growing Plants in Water, Cool Springs Press, 2018.
- M. Stone, How To Hydroponics: A Beginner’s and Intermediate’s In Depth Guide To Hydroponics, Martha Stone, 2014.
- Y. Nishikant, “Hydroponics Market by Type (Aggregate Systems, Liquid Sys- tems), Crop Type (Vegetables, Fruits, Flowers), Equipment (HVAC, Led Grow Light, Irrigation Systems, Material Handling, Control Systems), Input, and Region – Global Forecast to 2025,” 2019, accessed on 18th June, 2020.
- S. Kumar, A. Sharma, S. Rana, “Vertical Farming: New Agricultural Approach for 21st Century,” Agri Mirror: Future India, 1(1), 27–68, 2020.
- J. Muro, I. Irigoyen, P. Samitier, P. Mazuela, M. Salas, J. Soler, M. Urrestarazu, “Wood fiber as growing medium in hydroponic crop,” in ISSCH, 179–185, Almeria, Spain, 2004, doi:10.17660/ActaHortic.2005.697.22.
- T. Alexander, D. Parker, The Best of Growing Edge, New Moon Pub, 1994.
- F. Aliyu, T. Sheltami, “Development of an energy-harvesting toxic and com- bustible gas sensor for oil and gas industries,” Sensors and Actuators B: Chem- ical, 231, 265 – 275, 2016, doi:10.1016/j.snb.2016.03.037.
- J. Ko, C. Lu, M. B. Srivastava, J. A. Stankovic, A. Terzis, M. Welsh, “Wireless sensor networks for healthcare,” Proceedings of the IEEE, 98(11), 1947–1960, 2010, doi:10.1109/JPROC.2010.2065210.
- M. A. Hussain, K. kyung Sup, et al., “WSN research activities for military application,” in ICACT, 271–274, IEEE, Gangwon, Korea (South), 2009.
- Y. Wang, X. Yin, D. You, “Application of wireless sensor networks in Smart Grid,” power System technology, 34(5), 7–11, 2010.
- R. Hussain, J. Sahgal, P. Mishra, B. Sharma, “Application of WSN in rural development, Agriculture water management,” International Journal of Soft Computing and Engineering (IJSCE), 2(5), 68–72, 2012.
- U-Tec, “Green Farm,” 2020, accessed on 18th June, 2020.
- green-farm hydroponics, “Green Farm – Grow Your Own Herbs and Vegeta- bles! – Organic fertilizers – do they work with hydroponic,” 2015, accessed on 18th June, 2020.
- U-ING, “Cube Green Farm Hydroponic Grow Box by U-ING,” 2016, accessed on 18th June, 2020.
- H. Twiggs, “The 9 best home hydroponics kits,” 2018, accessed on 18th June, 2020.
- Z. Eran, B. Elad, B. Roy, “Terraplanter,” 2020, accessed on 18th June, 2020.
- M. Saaid, N. Yahya, M. Noor, M. M. Ali, “A development of an automatic microcontroller system for Deep Water Culture (DWC),” in ICSPA, 328–332, IEEE, Kuala Lumpur, Malaysia, 2013.
- M. F. Saaid, A. Sanuddin, M. Ali, M. S. A. I. M. Yassin, “Automated pH controller system for hydroponic cultivation,” in ISCAIE, 186–190, IEEE, Langkawi, Malaysia, 2015, doi:10.1109/ISCAIE.2015.7298353.
- F. Modu, A. Adam, F. Aliyu, A. Mabu, M. Musa, “A Survey of Smart Hydro- ponic Systems,” Advances in Science, Technology and Engineering Systems Journal, 5(1), 233–248, 2020.
- DFRobot, “WATER TURBINE GENERATOR (5VDC),” 2017, accessed on 18th June, 2020.
- Voltaic, “Voltaic Systems 1W 6V 113x89mm DRAWING CURRENT 2017 7 20,” 2017, accessed on 18th June, 2020.
- T. Asao, H. Kitazawa, K. Tomita, K. Suyama, H. Yamamoto, T. Hosoki, M. Pramanik, “Mitigation of cucumber autotoxicity in hydroponic culture using microbial strain,” Scientia Horticulturae, 99(3), 207 – 214, 2004, doi: 10.1016/S0304-4238(03)00098-0.
- W. Baudoin, R. Duffy, Good Agricultural Practices for Greenhouse Vegetable Crops: Principles for Mediterranean Climate Areas, Food and Agriculture Organization of the United Nations, 2013.
- J. Jones, Chapter seven: Hydroponic Application factors, Taylor & Francis, 2014.
- J. Jones, Hydroponics: A Practical Guide for the Soilless Grower, CRC Press, 2016.
- G. L. Barbosa, F. D. A. Gadelha, N. Kublik, A. Proctor, et al., “Comparison of land, water, and energy requirements of lettuce grown using hydroponic vs. conventional agricultural methods,” International journal of environmental research and public health, 12(6), 6879–6891, 2015.
- H.-J. K., W.-K. K., M.-Y. R., C.-I. K., et al., “Automated sensing of hydro- ponic macronutrients using a computer-controlled system with an array of ion-selective electrodes,” Computers and Electronics in Agriculture, 93, 46 – 54, 2013, doi:10.1016/j.compag.2013.01.011.
- W.-J. C., H.-J. K., D.-H. J., D.-W. K., et al., “On-site ion monitoring system for precision hydroponic nutrient management,” Computers and Electronics in Agriculture, 146, 51 – 58, 2018, doi:10.1016/j.compag.2018.01.019.
- T. Nishimura, Y. Okuyama, A. Satoh, “High-accuracy and low-cost sensor module for hydroponic culture system,” in GCCE, 1–4, IEEE, Kyoto, Japan, 2016, doi:10.1109/GCCE.2016.7800514.
- T. Nishimura, Y. Okuyama, A. Matsushita, H. Ikeda, A. Satoh, “A compact hardware design of a sensor module for hydroponics,” in GCCE, 1–4, IEEE, Nagoya, Japan, 2017, doi:10.1109/GCCE.2017.8229255.
- S. Charumathi, R. M. Kaviya, J. Kumariyarasi, R. Manisha, et al., “Optimiza- tion and Control of Hydroponics Agriculture using IOT,” Asian J. Appl. Sci. Technol, 1(2), 96–98, 2017.
- R. Nalwade, T. Mote, “Hydroponics farming,” in ICEI, 645–650, IEEE, Tirunelveli, India, 2017, doi:10.1109/ICOEI.2017.8300782.
- S. Alam, S. T. Siddiqui, A. Ahmad, R. Ahmad, M. Shuaib, “Internet of Things (IoT) Enabling Technologies, Requirements, and Security Challenges,” in ADIS, 119–126, Springer, Singapore, 2020, doi:10.1007/978-981-15-0694-9 12.
- B. Siregar, S. Efendi, H. Pranoto, R. Ginting, U. Andayani, F. Fahmi, “Re- mote monitoring system for hydroponic planting media,” in ICISS, 1–6, IEEE, Tangerang, Indonesia, 2017, doi:10.1109/ICTSS.2017.8288884.
- Cooking Hacks, “Open Garden – Hydroponics & Garden Plants Monitoring for Arduino,” 2014, accessed on 13th August, 2020.
- Cooking Hacks, “Open Garden Hydroponics,” 2014, accessed on 13th August, 2020.
- Y.-B. Lin, Y.-W. Lin, C.-M. Huang, C.-Y. Chih, P. Lin, “IoTtalk: A manage- ment platform for reconfigurable sensor devices,” IEEE Internet of Things Journal, 4(5), 1552–1562, 2017, doi:10.1109/JIOT.2017.2682100.
- T.-H. Wu, C.-H. Chang, Y.-W. Lin, L.-D. Van, Y.-B. Lin, “Intelligent plant care hydroponic box using IoTtalk,” in GreenCom, 398–401, IEEE, Chengdu, China, 2016, doi:10.1109/iThings-GreenCom-CPSCom-SmartData.2016.94.
- L. Van, Y. Lin, T. Wu, Y. Lin, et al., “PlantTalk: A Smartphone-Based In- telligent Hydroponic Plant Box,” Sensors, 19(8), 1763, 2019, doi:10.3390/ s19081763.
- K. E. Lakshmiprabha, C. Govindaraju, “Hydroponic-based smart irrigation system using Internet of Things,” International Journal of Communication Systems, 1(1), 1–10, 2019, doi:10.1002/dac.4071.
- M. A. Maureira, D. Oldenhof, L. Teernstra, “ThingSpeak–an API and Web Service for the Internet of Things,” 2011, accessed on 2nd September, 2020.
- P. N. Crisnapati, I. N. K. Wardana, I. K. A. A. Aryanto, A. Hermawan, “Hom- mons: Hydroponic management and monitoring system for an IOT based NFT farm using web technology,” in CITSM, 1–6, IEEE, Denpasar, Indonesia, 2017, doi:10.1109/CITSM.2017.8089268.
- M. A. Triawan, H. Hindersah, D. Yolanda, F. Hadiatna, “Internet of things using publish and subscribe method cloud-based application to NFT-based hydroponic system,” in ICSET, 98–104, IEEE, Bandung, Indonesia, 2016, doi:10.1109/ICSEngT.2016.7849631.
- S. Ruengittinun, S. Phongsamsuan, P. Sureeratanakorn, “Applied internet of thing for smart hydroponic farming ecosystem (HFE),” in Ubi-Media, 1–4, IEEE, Pattaya, Thailand, 2017, doi:10.1109/UMEDIA.2017.8074148.
- A. Satoh, “A Hydroponic Planter System to enable an Urban Agricul- ture Service Industry,” in GCCE, 281–284, IEEE, Nara, Japan, 2018, doi: 10.1109/GCCE.2018.8574661.
- J. A. Manrique, J. S. Rueda-Rueda, J. M. T. Portocarrero, “Contrast- ing Internet of Things and Wireless Sensor Network from a Conceptual Overview,” in iThings, 252–257, IEEE, Chengdu, China, 2016, doi:10.1109/ iThings-GreenCom-CPSCom-SmartData.2016.66.
- Philips, “Get started,” Accessed on 27th February, 2022.
- M. Zennaro, B. Pehrson, A. Bagula, “Wireless Sensor Networks: a great op- portunity for researchers in Developing Countries,” in WCITD, 1–7, WCITD, Pretoria, South Africa, 2008.
- S. Farahani, ZigBee wireless networks and transceivers, Newnes, 2011.
- R. Prabha, R. S. Saranish, S. Sowndharya, A. Santhosh, R. Varsha, K. Sumathi, “IoT Controlled Aquaponic System,” in ICACCS, 376–379, IEEE, Coimbatore, India, 2020, doi:10.1109/ICACCS48705.2020.9074401.
- S. Diver, L. Rinehart, “Aquaponics-Integration of hydroponics with aquacul- ture,” 2000, accessed on 18th June, 2020.
- S. V. Souza, R. M. T. Gimenes, E. Binotto, “Economic viability for deploying hydroponic system in emerging countries: A differentiated risk adjustment proposal,” Land Use Policy, 83, 357 – 369, 2019, doi:10.1016/j.landusepol. 2019.02.020.
- M. Kocakulak, I. Butun, “An overview of Wireless Sensor Networks towards internet of things,” in CCWC, 1–6, IEEE, Las Vegas, NV, USA, 2017, doi: 10.1109/CCWC.2017.7868374.
- M. Martinez-Mate, B. Martin-Gorriz, V. Mart´ınez-Alvarez, M. Soto-Garc´ıa, et al., “Hydroponic system and desalinated seawater as an alternative farm- productive proposal in water scarcity areas: Energy and greenhouse gas emis- sions analysis of lettuce production in southeast Spain,” Journal of Cleaner Production, 172, 1298 – 1310, 2018, doi:10.1016/j.jclepro.2017.10.275.
- S. Tagle, R. Pena, F. Oblea, H. Benoza, et al., “Development of an Automated Data Acquisition System for Hydroponic Farming,” in HNICEM, 1–5, Baguio City, Philippines, 2018, doi:10.1109/HNICEM.2018.8666373.
- D-Robotics UK, “DHT11 Humidity & Temperature Sensor,” Datasheet, 1–9,
2010. - S. A. D., K. F., J. R., R. F., et al., “A survey on data aggregation techniques in IoT sensor networks,” Wireless Networks, 26(2), 1243–1263, 2020, doi: 10.1007/s11276-019-02142-z.
- Omnet.org, “What is OMNET++,” 2020, accessed on 2nd September, 2020.
- F. M. Aliyu, F. Modu, A. S. Adam, A. Mabu, M. A. Musa, “Simponics,” 2020, accessed on 2nd September, 2020.
- E. C., C. Jose, G. C., “Modeling of current consumption in 802.15. 4/ZigBee sensor motes,” Sensors, 10(6), 5443–5468, 2010, doi:10.3390/s100605443.
- Atlas Scientific, “EZO-ECT M Embedded Conductivity Circuit,” Atlas Scien- tific LLC, 6(1), 1–75, 2019.
- Atlas Scientific, “Conductivity Probe K 10,” Atlas Scientific LLC, 2(7), 1–13, 2020.
- Parallax Inc, “Specification for 1W PV Module,” 2020, accessed on 2nd September, 2020.
- Atlas Scientific, “Micro Footprint pH Monitoring Subsystem,” Atlas Scientific LLC, 4(0), 1–13, 2020.
- Atlas Scientific, “Lab Grade pH Probe Double Junction Silver/Silver Chloride with EXR Glass,” Atlas Scientific LLC, 4(2), 1–13, 2020.
- V. Dale, “NTC Thermistors, Resistance/Temperature Conversion, Curve 2,” 2010, accessed on 2nd September, 2020.
- D. W. Medugu, F. W. Burari, A. A. Abdulazeez, “Construction of a reliable model pyranometer for irradiance measurements,” African journal of Biotechnology, 9(12), 2010.