Deep Learning in Monitoring the Behavior of Complex Technical Systems

Adv. Sci. Technol. Eng. Syst. J. 7(5), 10–16 (2022);
 DOI: 10.25046/aj070502
The article is devoted to the methods of monitoring and control of vibration processes occurring in the structure and units of complex and unique electromechanical equipment. The monitoring object is considered as a dynamic multidimensional information object, for the study of which analytical and numerical methods of modeling and simulation of multidimensional chaotic systems are used in the context of the scientific direction of physics of open systems. The structure of research of signals of vibration activity of equipment, description of mathematical models and algorithms based on them are presented. Demonstrative results of experiments carried out to analyze and evaluate the possibilities of controlling the behavior of a complex system using methods of influencing signals of various nature are presented. Using the methodology of Visual Thinking will improve the quality and efficiency of monitoring the vibrational activity of a complex technical object. Such a technique will make it possible to reasonably interpret the decision made to control the vibration process. The calculated parameters and the constructed visual images of the processed signals are proposed for use in the Input Layer of the Recurrent Neural Network of the Deep Learning algorithm.
1. Introduction
The analysis of vibration processes occurring in the interconnected nodes of complex power equipment is an urgent task to ensure its trouble-free, long-term and efficient operation. During operation, the equipment is exposed to electrical, mechanical, hydraulic, seismic and other forces and influences. Examples of devices with complex vibrational media are a hydraulic unit or a powerful pump design for pumping liquid. The operation of such devices is often accompanied by vibration processes with high intensity in a wide frequency range, the sources of which can be turbulent fluid flows, cavitation processes, friction in bearings of rotating assemblies, pressure pulsations on blades, etc. In the vibration signal of such devices, you can find information about the sources of vibration, beats, imbalances, resonances caused by them, or, conversely, false damping of intensity, in cases with antiphase influences from other sources of vibration. The situation becomes much more complicated when several such devices operate in parallel on the same platform, foundation. In this case, it becomes an important task to identify the cause-and-effect relationships of the true sources of vibration [1-10].
Traditionally, the process of operating complex electro-mechanical equipment is accompanied by monitoring of the vibrational environment and searching for vibration sources that can be caused by design features, transients or scenarios of technological processes. In addition, as you know, along with internal processes, equipment is exposed to external influences in the form of unpredictable changes in load, environmental impact, etc. Thus, monitoring the main parameters of the equipment allows you to identify problem areas or trends in their development at an early stage.
Monitoring the analyzed object from the standpoint of the information object will reveal previously unknown features of its dynamics, which will increase the reliability, argumentation and efficiency of the analysis. At the same time, its parameters can be presented in the form of information flows. Typically, complex dynamical systems exhibit non-linear behavior. Taking into account the nonlinear nature of the dynamic vibration processes occurring in the nodes and elements of complex technical means, their analysis and assessment should be carried out from the standpoint of the interaction of multidimensional chaotic systems [1-5, 8, 9, 11-16]. The main idea of the work is to apply the theory of chaotic systems, which connects mathematics and the studied physical processes, while the use of nonlinear recurrent analysis makes it possible to simplify the study of objects presented in 2D and 3D formats.
The use of analytical-numerical methods with computer modeling and simulating of various operating modes will allow you to safely test various control strategies.
An important role is played by the visualization of the studied vibration processes, since along with the signals in the spectrum of the observed data, the use of modern methods of analysis will make it possible to reveal hidden oscillations, the effects of the manifestation of the system’s memory, external influences and other information that is important for the development of a control strategy.
For the studies of the vibration activity of the control object carried out in the work, the time series obtained from the devices for collecting measuring information, the processes and functions modeled in MATLAB, as well as surrogate data were used. [2, 10, 11, 14, 15, 17, 18].
The issues of collecting measurement information and the equipment used for this are not considered in the work.
2. Research Methods Used for Analysis and Control
The research structure presented in Figure 1 [3, 19, 20, 21], covers a variety of iterative algorithms for the analysis, assessment and control of the dynamics of a complex system, the development of which takes place within the framework of an open system.
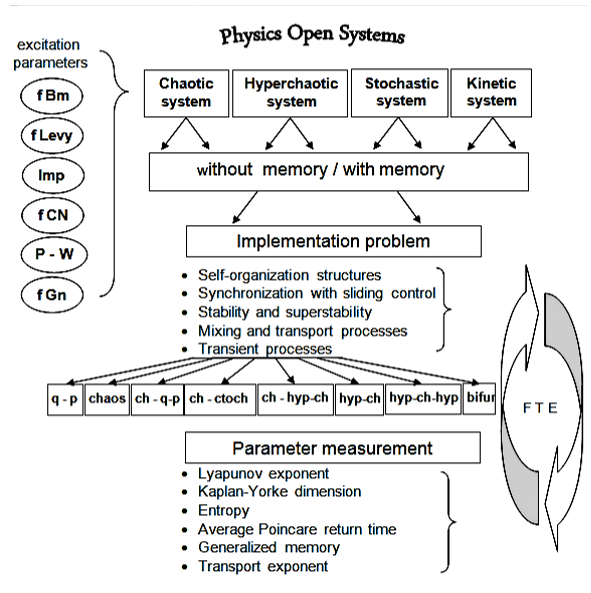
Figure 1: Structure of the study of dynamical systems Legend:
fBm – fractional Brownian motion; fLevy – fractional Levy motion; Imp – impulsive function; fCN – fractional Colored noise; P-W – piecewise function; fGn – fractional Gaussian noise; q – p – quasi-periodic; ch – q-p – chaos – quasi-periodic; ch-stoch – chaos – stochastic; ch – hyp-ch – chaos – hyper-chaos; hyp – ch – hyp – hyper-chaos – chaos – hyper-chaos; bifur – bifurcation; F T E – fractional time evolution.
It is known that the evolution of a dynamic chaotic system is sensitive to initial conditions, the influence of system memory, as well as to minor disturbing influences.
In this work, we propose to use, for example, functions such as Brownian motion, fractional Levy motion, fractional color noise, fractional Gaussian noise, anti-synchronization, and others, as acting to correct or control the behavior of the simulated process [6, 17, 21-24]. In this case, the spectrum of changes in the nature of dynamic processes can vary from quasiperiodic to hyper chaotic processes. The choice of a particular type depends on the goals and objectives of the research.
The analysis and study of the dynamics of vibration processes was carried out according to the algorithms described below. The analysis results are visualized in the form of recurrent plots, Finite-time Lyapunov Exponent (FTLE), dependences of the Poincare return times, Lyapunov exponents, Tsallis entropy, etc. [2, 11, 12, 25-29].
The proposed mathematical model covers the most significant components affecting processes of interconnections and interactions of information flows circulating in the investigated dynamic system [10]:
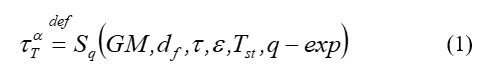
where – thermodynamically spectrum of the dimensions of the Poincare’s return time in an open space; – entropy of Tsallis; GM – generalized memory; – fractal dimensions in the function of entropy of Tsallis; – mean return time for Poincare; – stability of Tsallis entropy; – stability of thermodynamics; -exp – exponential of Tsallis. [6, 8, 18, 19, 30-32].
The idea of modeling dynamic processes evolving within the framework of an open system is based on the thermodynamic-informational paradigm, which made it possible to connect the informative and operational components of data and knowledge.
3. Research Algorithm
Let’s imagine a complex technical system as a set of interconnected pieces of equipment that demonstrate the nonlinear nature of dynamics. The structure of the research algorithm is shown in Figure 2.
Each of the components of the system is influenced as well as influenced by others. To study the behavior of such a system, it is necessary to carry out a set of measurements and calculations of informative parameters, on the basis of which it will be possible to make a decision on the continuation of monitoring or the choice of control actions for correction.
The list of measured, calculated and graphically presented data can be expanded, which will increase their overall information content. The figure 2 also shows a library of influencing functions designed to correct and control the dynamics of the observed processes. This list can also be supplemented in the process of analyzing the response of the system in order to obtain satisfactory characteristics.
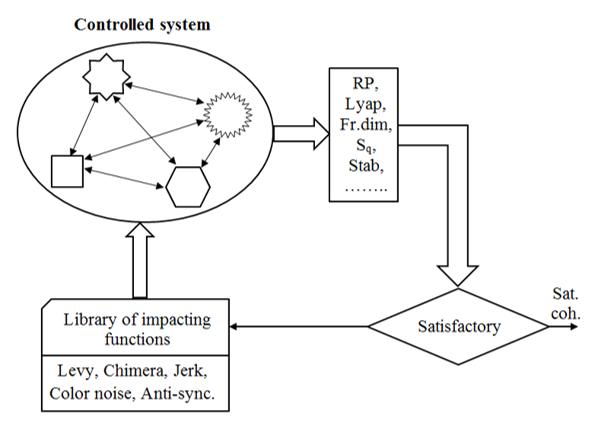
Figure 2: The structure of the research algorithm.
3.1. Interaction of System Components
Numerical modeling of the processes under study begins with the presentation of fragments of the observed time series and the selection of areas of interest. The generalized structure of the algorithm for studying the interrelationships and mutual influence of the system components, assessing the situation that has arisen and choosing the control actions [3, 11, 15, 33, 34].
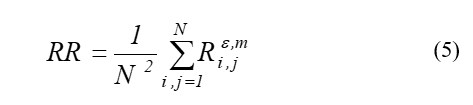
Recurrent diagrams obtained as a result of non-linear recurrent analysis of observables of a connected controlled system can be used to visually assess the current situation and its dynamics:
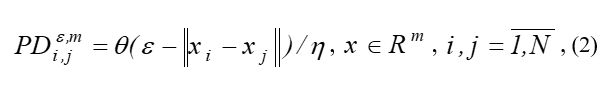
where is the number of states under consideration; ; – the size of the neighborhood of the point at the moment ; – norm; – Heaviside function [11, 29, 35].
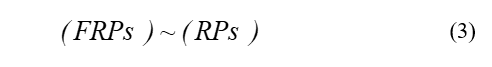
Considering that the time of the First Poincare recurrence times (FPRs) corresponds to a Recurrence Plot (RP) of a certain process, that is, FPRs or [8, 16]:
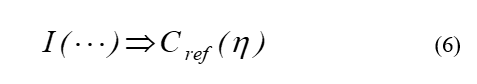
Next, the most informative parameters of the system behavior are calculated, such as the Lyapunov characteristic exponents, fractional dimension, Tsallis entropy, stability indicator, etc. According to the results of the analysis of the constructed RP-s, we search for areas that meet the objectives of the research by the criterion:
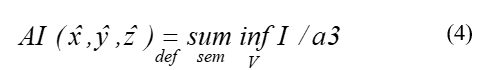
where is the area of interest, formed on the thesis of the selection of information in such a way that it is the most meaningful from the semantic point of view and the minimum in terms of the amount of information; – adequately taking into account reflexivity, while taking into account that the measure of recurrence [8, 16]:
represents the probability of repeating trajectories when implementing a mapping
The next stage is associated with the calculation of informative parameters and making a decision on the relevance of the application of impacts and, accordingly, the choice of their type. The structure shown in Figure 1 shows examples of influencing functions [3, 19, 20]. As is known, in the practice of using algorithms for controlling the behavior of chaotic systems, they are guided by the principles of actions based on the extreme sensitivity of chaotic dynamical systems to small disturbances, the effectiveness of which depends on falling into the required area. The work also used the principles of selecting areas of interest (AI) and types of impacts. In our case, the following functions were used as impacting functions: Levy flight, Chimera states, Color noise, Jerk, Anti-synchronization and others [3, 17, 22, 23].
3.2. Algorithm “Measurement – Recognition – Decision Making”
An important part of the study of the dynamics of a chaotic system are the stages: “measurement – recognition – decision making” [18, 19, 33]. Nonlinear recurrent analysis can serve as a catalyst for the implementation of the control task due to its visual images in the form of RP and their characteristic features in the form of topology, texture, color palette. The use of the Visual Thinking methodology will allow you to quickly comprehend the current situation, increase the reliability of the analysis and justify the decision on the impact on the controlled system.
The structure of the adaptive system for analyzing and controlling the behavior of fractional-order chaotic systems is shown in Figure 3.
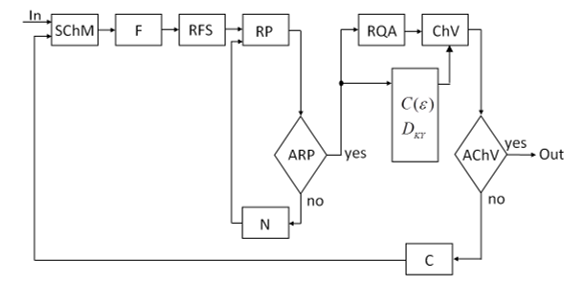
Figure 3. The structure of the adaptive system.
This structure demonstrates the application of the adaptive algorithm to the processes observed in the nodes of the power equipment of hydroelectric power plants [3, 19]. The operation of the algorithm is based on the principles of synergetic, Poincare’s return time theorem, covers the stages of analysis of measurement information, nonlinear recurrent analysis with the construction of RP, calculations of informative parameters of the system under study.
Legend:
- SChM – stochastic and chaotic mappings;
- F – filter;
- RFS – phase space reconstruction;
- RP – recurrent diagramming;
- RQA – recurrent quantitative analysis;
- ChV – characteristic vector generation;
- ARP – analysis of recurrent diagrams;
- AChV – analysis of characteristic vector;
- N – norm setting ;
- C – calculation of: correlation integral , new fractional dimension of Kaplan-Yorke and implementation filtering chaotic information, recurrent analysis of controlled processes.
3.3. Thermodynamic Information Paradigm
It is known that in an open system the issues of energy and matter transformation are considered from the standpoint of thermodynamics. The formation of an information-theoretical approach to modeling processes in open systems contributes to the combination of dynamic and informational components, as a result of which the development of complex systems begins to be determined by its information properties as well as their relationship to the external environment [3, 10, 18, 20, 36].
The theory of dissipative structures that determine physicochemical processes was developed as an “exchange of information”, which made it possible to universalize thermodynamic categories [10, 36].
It is pertinent to note that the dynamics of nonlinear processes of dissipative systems is also described by Poincare’s theory, although they were developed for Hamiltonian systems. Also noteworthy is the relationship between metric entropy and Poincare recurrence.
3.4. Nonlinear Recurrence Analysis, Recurrence Plots
Visualization of nonlinear recurrent analysis with the representation of RP allows you to visually assess the dynamics of the system under study by its texture, topology and color scale, to study the AI allocated to test the hypothesis about the use of a control or corrective action [3, 11, 37-41]. As an example, in Figure 4 shows the operation of the algorithm for searching for the Area of Interest and extracting it on the sections of the time series of the chaotic process signal that are of interest to the researcher (color noise affects the Chen fractional system). The corresponding recurrent diagrams and distance matrices of the nonlinear recurrent analysis are constructed for the Areas of Interest highlighted on the time series chart. [37-39].
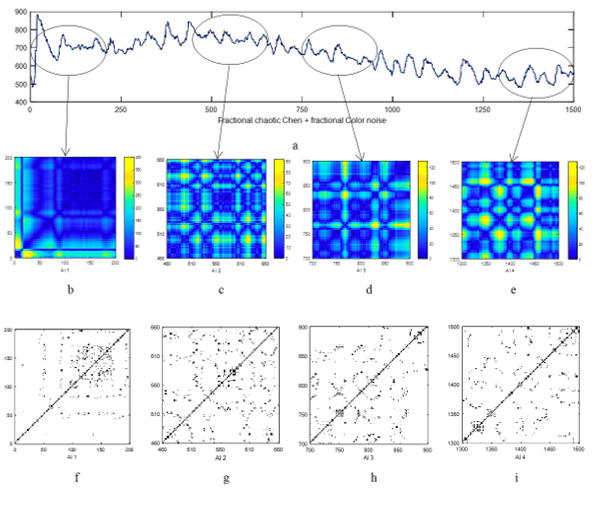
Figure 4. Interaction systems fractional Chen and Color noise: a –time series; b, c, d, e – distance matrix; f, g, h, i –recurrence plots.
3.5. Mixing Issues
Stirring is one of the key concepts in dynamical systems theory. The analysis of mixing processes of phase trajectories is an important part of studies of the behavior of chaotic systems. Lyapunov exponents, FTLE, Lagrangian coherent structures (LCS) are considered effective visual-informative indicators of the dynamics of chaotic systems, visual images of which allow one to assess the chaotic nature of the system, the presence of features on the trajectories of the system in the phase space.
An example of the spatial structure of FTLE, presented below (Figure 5), illustrates the features of phase trajectories and transitions of various states of a chaotic process during mixing and / or interaction of systems. [27, 28, 32].
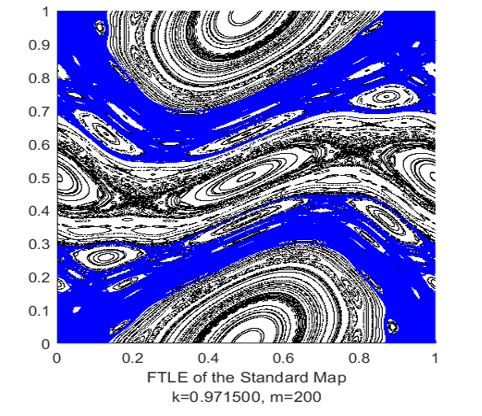
Figure 5. Visualization of characteristic parts of complex system behavior using FTLE.
4. Application of Artificial Intelligence Methodology for Research of Complex Technical Systems
The examples of visual information presented above are necessary for a comprehensive analysis and diagnostics of ongoing processes and making, on their basis, an informed decision to control or correct the behavior of a complex system.
Analysis, assessment of the situation and decision-making is the final stage of research, and is mainly based on various analytical and visual information (the value and information content of which is known to everyone), which complements knowledge based on Visual Thinking. All this predetermined further steps in the need to use artificial intelligence to solve the urgent problem of studying the behavior of complex technical systems [11, 39, 41, 42].
The above was a reasoned prerequisite for the application of the methodology Deep Learning methods based on Recurrence NN in the study of vibration processes in complex mechanical systems [11, 42-50].
The results of preliminary measurements, analyzes, simulations and transformations are used as input information for the Input Layer of Deep Learning architecture. The presented data are generalized and used as new knowledge for further analysis and evaluation using the Neural Network, which is part of the Deep Learning algorithm. As showed in Figure 6, the middle – Hidden Layer, is presented as a Recurrence NN algorithm, the work of which is to assess the dynamics of vibration processes taking into account the manifestations of system memory.
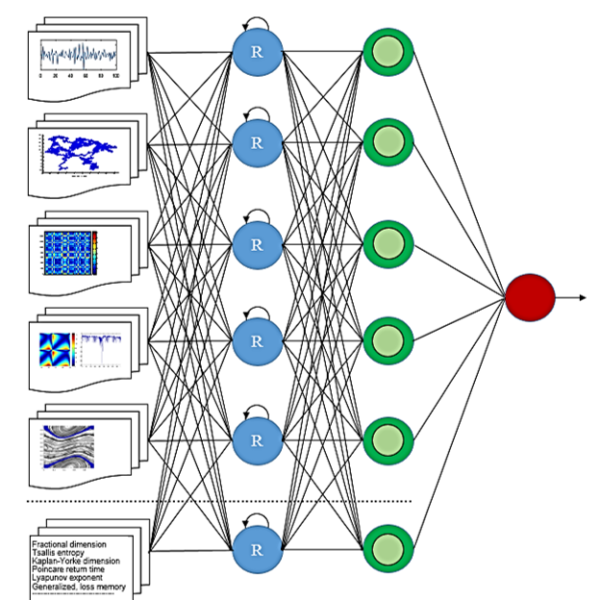
Figure 6. The structure of a recurrent neural network algorithm Legend:
Input Layer components – time series of observed vibration processes, Levy’s movements or other influences, recurrent plots of a fragment of the processes under study, stability of selected Areas of Interest, FTLE-graph of the information flow interaction area, calculated informative parameters and others; the Hidden Layer is represented by a recurrent algorithm and system memory, on which the dynamics and behavior of the system depend; the Output Layer – is the solution generated by the algorithm.
In addition, the Recurrence Neural Network algorithm in its work analyzes and uses the results of the calculated informative system parameters and the choice of control or corrective forces, taking into account the requirements of operating scenarios, etc. These algorithms may include the above-described iterative and evaluation algorithms for analyzing measurement information, visual images, time series, RP and FTLE plots, Lyapunov exponents, Tsallis entropy, fractal dimensions and other information that complements and contributes to a better understanding of the ongoing processes [27, 42, 44, 46, 48]. The solution to the problem posed to ensure the reliable operation of the monitored equipment can be represented as an output layer, in the form of recommendations to a person who decides on further actions to operate the equipment.
5. Conclusion
The article presents the main fragments of a large research work devoted to the problems of analyzing the vibration activity of complex power electromechanical equipment, presented in the form of an information model of nonlinear multidimensional chaotic processes. To generalize a large amount of parametric and visual information, modern methods of analysis and decision-making based on them were used. The structure of a deep learning algorithm based on Recurrence NN and Memory of system is substantiated and presented. Using DL to analyze and diagnose the state of a complex electromechanical system subject to vibration processes will increase the accuracy and speed of drawing conclusions about its condition and will facilitate informed decision-making based on all monitoring parameters.
Conflict of Interest
The authors declare that there is no conflict of interest regarding the publication of this paper.
Acknowledgment
The author expresses his deep gratitude to Vladimirsky E.I., for advice and assistance at the stages of writing the manuscript.
Funding
The work was not funded by third-party organizations, grants or sponsors, and was completely performed by the author as part of his research work.
- A. Alimasi Low Frequency Vibration Visual Monitoring System Based on Multi-Modal 3DCNN-ConvLSTM. Sensors 2020, 20, 5872. 13p. doi: 10.3390/s20205872
- B. Goswami, A Brief Introduction to Nonlinear Time Series Analysis and Recurrence Plots. Vibration. 2019, 2, 332–368. doi: 10.3390/vibration2040021
- B. Ismailov, An Analysis and Control of Dynamic Processes in Mechanical Parts of Power Equipment. International Journal of Mechanical and Production Engineering Research and Development (IJMPERD). 8(5), 2018. 347-352. doi: 10.24247/ijmperdoct201839
- M. Ghazali, Vibration Analysis for Machine Monitoring and Diagnosis: A Systematic Review. Hindawi, Shock and Vibration. 2, 2021, 25 p. doi: 10.1155/2021/9469318
- G. Wojnar, R., Wieczorek A.N. and Konieczny Ł. Multidimensional Data Interpretation of Vibration Signals Registered in Different Locations for System Condition Monitoring of a Three-Stage Gear Transmission Operating under Difficult Conditions. Sensors (Basel). 2021; 21, 7808. doi: 10.3390/s21237808
- X. Zhang, Sui T., Zhang H., Zhang Y., Liu L., Zhang Sh. An Active Vibration Control Method for Typical Piping System of Nuclear Power Plant. 2021 IEEE 10th Data Driven Control and Learning Systems Conference (DDCLS). doi: 10.1109/DDCLS52934.2021.9455612
- B. Ismailov, Visualization of Measuring Experiments in a Context of Acceptance of the Decisions. 2nd world conference on soft computing. WconSC’12. Baku, 2012, 97-102.
- E. Vladimirsky, Ismailov B.I. Synergetic methods of control of chaotic systems. Baku, “ELM” 2011. 240 P.
- B.I. Ismailov The Visual Control of Vibration Dynamic System. Eastern-European Journal of Enterprise Technologies. 2012(59). 25-30.
- B.I. Ismailov. Thermodynamic – Informational Paradigm in the Context of the Formation of a Mathematical Model of Transient Processes in an Open System. European Journal of Engineering Research and Science, 2(10), 2017. 17-20. doi: 10.24018/ejers.2017.2.10.494
- J. Eckmann, Kamphorst S.O., Ruelle D., Recurrence Plots of Dynamical Systems. // Europhysics Letters., 4, 1987. 973-977.
- H. Poincaré, Sur la problème des trois corps et les équations de la dynamique. Acta Mathematica. 13, 1–271. https://projecteuclid.org/journals/acta-mathematica/volume-13/issue-1-2
- G. Robinson, Recurrence determine the dynamics. Chaos 19, 023104. (2009). 1-6. doi: 10.1063/1.3117151
- Sprott J.C. Chaos and Time Series Analysis. Oxford University Press, 2003. 507p. https://sprott.physics.wisc.edu/chaostsa/
- Sprott J.C. Do We Need More Chaos Examples? Chaos Theory and Applications (CHTA). 2, Issue №: 2. 2020. https://dergipark.org.tr/en/pub/chaos/issue/54264
- Vladimirsky E.I. Poincare returns time in the interaction of chaotic and stochastic systems. Eastern-European Journal of Enterprise Technologies. №6/4 (60). 2012. 4-8. doi: 10.15587/1729-4061.2012.5673
- Chen D., Zhang R., Ma X., Liu S. Chaotic synchronization and anti-synchronization for a novel class of multiple chaotic systems via a sliding mode control scheme. Nonlinear Dynamics. 69, 35–55, 2012. doi: 10.1007/s11071-011-0244-7
- Ismailov B.I. Simulation of Influences on the Dynamics of Transitional and Recurrent Processes of Complex Technical Systems. International Journal of Innovative Technology and Exploring Engineering. 9(1), 2019. 4929- 4932. doi: 10.35940/ijitee.A8116.119119
- Ismailov B.I. Poincare recurrence in open systems. Journal of Multidisciplinary Engineering Science and Technology (JMEST). 3(9), 2016. 5565-5569. chrome-extension://mhjfbmdgcfjbbpaeojofohoefgiehjai/index.html
- Vladimirsky E.I., Ismailov B.I. Transient and recurrence processes in open system. International Journal of Advanced and Applied Sciences (IJAAS), 4(10) 2017, 106-115. doi: 10.21833/ijaas.2017.010.015
- Daitche A. and Tél T. Memory effects in chaotic advection of inertial particles. New Journal of Physics. 16, 2014. 31p. 073008 doi: 10.1088/1367-2630/16/7/073008
- Dubkov A., Spagnolo B., and Uchaikin V. Levy flight superdiffusion: An introduction. International Journal of Bifurcation and Chaos. (2008). 1-33. doi: 10.1142/S0218127408021877
- Murray S. Metastable chimera states in community-structured oscillator networks. Chaos 20, 013108, 2010. 1-5. doi: 10.1063/1.3305451
- Peng T. and Yan O. Torsional vibration analysis of shaft with multi inertias. Scientific Reports. 2022. 12:7333. doi: 10.1038/s41598-022-11211-x
- Danca Marius-F., Kuznetsov N., Matlab code for Lyapunov exponents of fractional order systems. International Journal of Bifurcation and Chaos. 28(05), 1850067 (2018). doi: 10.1142/S0218127418500670
- Rabha W. Ibrahim, and Maslina Daru. Analytic Study of Complex Fractional Tsallis’ Entropy with Applications in CNNs. Entropy, 2018, 20, 722; doi: 10.3390/e20100722
- Sanjeeva B. Uncertainty in Finite-time Lyapunov Exponent computations. Journal of Computational Dynamics. American Institute of Mathematical Sciences 7, №: 2, 2020. 313–337. doi: 10.3934/jcd.2020013
- Brunton S.L. and Rowley C.W. Fast computation of finite-time Lyapunov exponent fields for unsteady flows. Chaos 20, 017503 (2010). doi: 10.1063/1.3270044
- P. Varandas, Entropy and Poincare Recurrence from a Geometrical Viewpoint. Nonlinearity, 22(10), 2009. 2365. doi: 10.1088/0951-7715/22/10/003
- Ismailov B.I. Numerical methods of control the hidden oscillations of fractional-order chaotic systems. Journal of Multidisciplinary Engineering Science and Technology (JMEST). 3(8), 2016. 5490-5494. chrome-extension://mhjfbmdgcfjbbpaeojofohoefgiehjai/index.html
- Vladimirsky E.I., Ismailov B.I. Fractional-order Chaotic Filter with Generalized Memory. International Journal of Contemporary Applied Sciences. 3, No. 4, 2016. 46-61. chrome-extension://mhjfbmdgcfjbbpaeojofohoefgiehjai/index.html
- Vladimirsky E.I., Ismailov B.I. “Synchronization, control and stability of fractional order Hyperchaotic systems in the context of the generalized memory”. International Journal, of New Technology and Research (IJNTR), Volume-1, Issue-8, 2015. 42-48. https://www.neliti.com/publications/263636/synchronization-control-and-stability-of-fractional-order-hyperchaotic-systems-i
- Ismailov B.I. Research of Dynamics of Coherent Behavior of a Complex Related Heterogeneous Structures. Sciences of Europe # 27, 2018. 60-64. https://cyberleninka.ru/article/n/research-of-dynamics-of-coherent-behavior-of-a-complex-related-heterogeneous-structures
- Vladimirsky E.I., Ismailov B.I. Fractional Structure «MIXING – TRANSPORT» as open system. Eastern-European Journal of Enterprise Technologies. №4/4 (70). 2014. 4-9. doi: 10.15587/1729-4061.2014.26199
- Majumdar K., Jayachandran S. A Geometric Analysis of Time Series Leading to Information Encoding and A New Entropy Measure. Journal of Computational and Applied Mathematics. 2018, 328: 469 – 484. doi: 10.48550/arXiv.1810.05900
- Chandrashekar R., Ravikumar C. and Segar J. A Fractional entropy in Fractal phase space: properties and characterization. 2014. 22p. doi: 10.1155/2014/460364
- Ismailov B.I. Nonlinear recurrent analysis in signal processing problems. Sciences of Europe. 1, № 45. 2019. 16-21. https://cyberleninka.ru/article/n/nonlinear-recurrent-analysis-in-signal-processing-problems
- Hirata Y. Recurrence plots for characterizing random dynamical systems. Commun Nonlinear Sci Numer Simulat 94 (2021) 105552. 20p. doi: 10.1016/j.cnsns.2020.105552
- Hobbs B. and Ord A. Nonlinear dynamical analysis of GNSS data: quantification, precursors and synchronization. Progress in Earth and Planetary Science. 2018. 35p. doi: 10.1186/s40645-018-0193-6
- Fragkou A., Charakopoulos A., Karakasidis T. and Liakopoulos A. Non-Linear Analysis of River System Dynamics Using Recurrence Quantification Analysis. AppliedMath. 2022, 2, 1–15. doi: 10.3390/appliedmath2010001
- Li Y. and Li Z. Research on Recurrence Plot Feature Quantization Method Based on Image Texture Analysis. Hindawi. Journal of Environmental and Public Health. Volume 2022, Article ID 2495024, 12p. doi: 10.1155/2022/2495024
- Evagorou M., Erduran S. and Martyla T. The role of visual representations in scientific practices: from conceptual understanding and knowledge generation to ‘seeing’ how science works. International Journal of STEM Education (2015). 13p. doi: 10.1186/s40594-015-0024-x
- Duries T., Brunton S.L, Noack B.R. Machine Learning Control – Taming Nonlinear Dynamics and Turbulence. Springer, 2017. 211p.
- Lee S.W., Yu H.T., Yang H.J., Song I.S., Choi J.M., Yang J.H., Lim G.M., Kim K-S., Choi B.K. and Kwon J.W. A Study on Deep Learning Application of Vibration Data and Visualization of Defects for Predictive Maintenance of Gravity Acceleration Equipment. Applied Sciences 2021. 11, Issue 4. doi: 10.3390/app11041564
- Lee W.S., Flach S. Deep Learning of Chaotic Classification. Computing Science > Machine Learning. Science and Technology. 2020. Volume 1, Number 4. doi: 10.1088/2632-2153/abb6d3
- Avci O., Abdeljaber O., Kiranyaz S., Hussein M., Gabbouj M., Imman D.J. A review of vibration-based damage detection in civil structures: from traditional methods to Machine Learning and Deep Learning applications. Mechanical Systems and Signal Processing. 2021. 147, 107077. doi: 10.1016/j.ymssp.2020.107077
- Pathak J., Zhixin Lu, Brian R. Hunt, Michelle Girvan, Edward Ott. Using machine learning to replicate chaotic attractors and calculate Lyapunov exponents from data. Chaos. 27 (12), 2017. doi: 10.1063/1.5010300
- Wang T., Zhang L., Qiao H. and Wang P. Fault diagnosis of rotating machinery under time-varying speed based on order tracking and deep learning. Journal of Vibroengineering, 22(2), 2020, 366-382. doi: 10.21595/jve.2019.20784
- Xiong L., Liu J., Song B., Dang J., Yang F. and Lin H. Deep learning compound trend prediction model for hydraulic turbine time series. International Journal of Low-Carbon Technologies 2021, 00, 1–7. Published by Oxford University Press. doi: 10.1093/ijlct/ctaa106
- Xu J.-L., Hugelier S., Zhu H., Gowen A.A., Deep learning for classification of time series spectral images using combined multi-temporal and spectral features. Analytica Chimica Acta 1143, 2021. 9-20. doi: 10.1016/j.aca.2020.11.018