Matching TCP Packets to Detect Stepping-Stone Intrusion using Packet Crossover

Adv. Sci. Technol. Eng. Syst. J. 7(6), 13–19 (2022);
 DOI: 10.25046/aj070602
Hackers on the Internet often send attacking commands through compromised hosts, called stepping-stones, for the purpose to be hidden behind a long interactive communication session. In a stepping-stone attack, an intruder uses a chain of stepping-stones as relay machines and remotely login these machines using a remote login program such as SSH (secure shell). A great number of detection methods for SSI have been proposed since 1995. Many of these existing detection approaches are either not easy to implement, or not efficient as a great number of packets have to be monitored and analyzed. Some of these detection methods for SSI are even not effective as their capabilities to detect SSI are very limited. In this paper, we propose an effective detection method for SSI by using packet crossover. Packet crossover ratios can be easily computed, and thus our proposed detection method for SSI cannot only be easily implemented, but also efficient. Well-designed network experiments are conducted and the effectiveness of the developed SSID algorithm is verified through the experiments.
1. Introduction
Today hackers usually send attacking commands through compromised hosts in order to be hidden behind a long interactive communication session. These compromised hosts involved in attacks are referred to as stepping-stone ones. While launching a stepping-stone intrusion (SSI) attack, the intruder operates on a local host and sends attacking packets that will be relayed through the intermediate stepping-stones before they reach the final target system.
The TCP protocol was designed in a way that every interactive TCP connection between the attacker host and the final target is independent of one another, even though they are relayed connections. Therefore, the target machine is only able to get information from the last stepping-stone host in the connection chain. That is, it is notoriously hard for the final victim host to obtain information about the geographic region of the origin of the intrusion.
Figure 1 shows a sample of a connection chain that can be exploit to send attacking commands with an SSI. Host 0 in the figure serves as the intruder machine, Host N the final victim machine, and Host 1, Host 2, . . . , Host i-1, Host i, Host i+1, . . . , and Host N -1 serve as the stepping stones for the attack. The purpose of SSI detection (SSID) is to determine whether a host in a network is employed as a stepping-stone one for an attack. In the process of SSID, any intermediate machine within the chain could be chosen as the sensor. A packet sniffing program such as TCPdump or Wireshark must be available on a sensor host. In this figure, Host i is employed as the sensor.
Next, we introduce some important concepts that are needed design detection algorithms for SSI. An incoming connection to Host i is defined to be a connection from Host i-1 to Host i. An outgoing connection from Host i is defined to be a connection from Host i to Host i+1. There is possibly an intrusion if an incoming connection of the sensor matches with one of its outgoing connections.
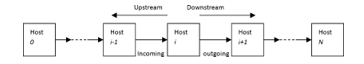
Figure 1. A sample connection chain
A great number of methods for SSID have been proposed since the first seminar work [1] in 1995. These detection approaches for SSI can be divided into two different types. Compare the incoming connections to a machine with its outgoing connections, and then make a decision to determine whether there is an intrusion based on the comparison. This type of SSI detection approach is referred to as host-based detection [1]-[6]. It is well-known that stepping-stone hosts can be used by some applications to access a remote server legally. Therefore, high false-positive errors could be generated by using host-based detection methods for SSI.
In order to reduce the false-positive errors produced by host-based detection approaches, another category of detection methods was developed to overcome the challenge by counting the number of stepping-stone machines contained in a connection, which is called the length of the connection chain. This category of SSID methods is called connection-chain based or network-based detection [7]-[11], [14], [15]. Typically, there is no need to remotely access a sever via more than three stepping-stones as a lot of unnecessary network traffic will be produced and make the data communication much slower. The threshold number here is three as applications only uses one or two stepping-stone machines to access a remote server legitimately.
Many of these existing detection approaches are either not easy to implement, or not efficient as a lot of packets have to be monitored and processed. Some of these SSID methods are even not effective as their detection capabilities for SSI are very limited. There is a need to propose an innovative detection algorithm for SSI that can be easily implemented without having to monitor a lot of TCP packets. Thus, such an algorithm for SSID is efficient in terms of processing time. In this paper, we propose an effective detection method for SSI by using packet crossover ratios. Packet crossover ratios can be easily computed, and thus our proposed detection method for SSI cannot only be easily implemented, but also efficient.
In [16], the authors used the idea of packet crossovers to identify a “long” connection chain. However, this paper made two assumptions (1) there exist packet crossovers in a long connection chain, and (2) a shorter connection chain produces less packet crossovers and a longer connection chain generates more packet crossovers. The conclusion made in [16] was based on these two assumptions. In this paper, we verify the following important statements through network experiments: if the packet crossover ratio of an incoming connection of a sensor host is almost equal to that of an outgoing connection of the sensor, then these two connections are relayed ones, and vice versa.
The remaining of this paper is organized as follows. A literature review for existing approaches for SSID is discussed in section 2. Preliminary knowledge needed in this paper is presented in section 3. In Section 4, an innovative algorithm to match TCP packets using packet crossover is proposed. In Section 5, we design and conduct network experiments to verify the correctness of Proposition 1 described in Section 4. Section 6 gives a conclusion and future research direction for this paper.
2. Literature Reviews
Let us begin our reviews with the existing host-based detection methods that have been proposed for SSI since 1995. The content thumbprint approach to detect SSI was proposed in [1]. This method determines whether a communication session is an intrusion by comparing the content of the packets from the outgoing connection of the sensor host with that of the packets from its incoming connection. It is highly possible that the session is an intrusion if there is a relayed pair between them. However, this approach cannot be used to detect SSI for computer networks with encrypted traffic. To overcome the drawback of this method, a time-thumbprint based approach for SSID was developed in [2]. This approach utilized the timestamps of the monitored packets. This approach for SSID can be used for networks with encrypted traffic as packet timestamps are not encrypted. An example of encrypted traffic is to login to a remote server using SSH.
If the network traffic is encrypted, it is much harder to detect SSI, and even more difficult if a communication session is manipulated by attackers using hacking tools. The packet counting method proposed in [5] was to address such a challenge in detecting SSI through counting the number of packets in both the incoming and outgoing connections. The methods proposed in this paper were to identify stepping-stone connections when the traffic is encrypted and the packet timestamps are jittered. This method also allows an attacker to inject certain amount of meaningless chaff packets into an attacking stream. However, in order for this method to work effectively, both the amount of chaffed meaningless packets and the percentage of the packets with jittered timestamps must be small. Therefore, the capability of the detection approach proposed in [5] is very limited to handle session manipulation by hackers.
Next, we provide a literature review on network-based approaches for SSID that estimate a connection-chain length. In 2002, the authors of [7] developed the 1st network-based approach for SSID to estimate the length of a connection chain. Yung’s method calculated the ratio between the Send-Echo RTT and of Send-Ack RTT. The RTTs of an Echo and a Send packet stand for the length of the connection chain from the sensor to the final victim host. On the other hand, an RTT for a Send packet and an Ack packet can only stand for the length from the sensor to its next adjacent machine in the downstream connection sub-chain. Therefore, a high false-negative error was generated by Yung’s method in [7] because of the adoption of the acknowledgement packets. The issues of the method proposed in [7] was addressed in the work [8], which is the 2nd network-based approach for SSID proposed in 2004. The detection algorithm proposed in [8] uses the step-function approach to calculate the length of a connection chain in a local area network (LAN). An improvement of the approach in [8] over Yung’s one in [7] is that the authors of [8] changed the way to set up the connection chain so that every Send packet can be possibly matched with a corresponding Echo packet. In a LAN, the step-function method for SSID worked well and reduced both the false positive error and the false negative error, compared to Yung’s method proposed in [7]. However, a major drawback of the detection method proposed in [8] is that this method only worked well within a LAN, but wasn’t working in the Internet environment. With the context of the Internet, a conservative and greedy packet matching algorithm for SSID was proposed [14]. However, this method in [14] only very few Send packets can be matched with corresponding Echo packets. Therefore, the method in [14] did not work effectively either in the Internet environment.
To address this issue, a clustering and partitioning data mining detection approach for SSI was proposed in [9]. In [9], the packet RTTs were computed by utilizing the clustering and partitioning data mining approach. The packet matching method proposed in this paper is accurate as it went through all the possible Echo packets for every Send packet to be matched. A major issue of the detection method in [9] is that we have to monitor a great number of TCP packets. Therefore, in terms of packet processing time, the detection method proposed in [9] is not efficient.
One of our earlier works [10] addressed the issue of the SSID method proposed in [9] and developed a detection approach via mining network traffic by utilizing the k-Means clustering data mining algorithm. This k-Means based approach proposed in [10] does not need to capture and analyze a huge number of packets, and thus it is more efficient than MMD based approach proposed in [9]. But because of the use of the k-Means clustering, the length of a connection chain must be pre-determined for this approach, which makes its performance and capability very limited for SSID. Also, this k-Means based detection approach is ineffectively if large fluctuations of the TCP packets exist.
In a recent work [11], we developed an effective network-based SSID approach by calculating the packet crossover ratios. This packet-crossover based method is easy to implement as we can easily compute the packet crossover ratios. With a modification of the k-Means clustering algorithm, [12] proposed an improved algorithm for SSID based detection approach developed in [10] by eliminating some of the packet RTT outliers. However, this paper did not provide any technical analysis regarding whether or not the SSID method is resistant to session manipulations by intruders. Another algorithm proposed for removing packet-RTT outliers is the work [13]. This outlier detection algorithm in [13] can be used to design new approaches to detect SSI. A major drawback of the outlier detection algorithm in [13] it that the accuracy of discovering the RTT outliers is low.
3. Preliminaries
Let us introduce the preliminaries that are needed for our detection algorithm design for SSID in this section.
3.1. Definitions of Send/Echo Packets
Refer to [11] for the definitions of an Echo and a Send packets. For example, when a command is entered on a terminal window in a host running Linux, such as “cd”, we assume that the command “cd” is delivered to the remote server in two separate TCP packets: one holding the letter “c” and the other holding the letter “d”. Both of these packets are Send ones. When the letter “c” is entered on the user’s machine, the packet holding “c” will be delivered to the remote server. Once this packet is received and processed at the server, an Echo packet is sent back to the user, the letter “c” displays on the command line of the user’s screen. In such a scenario, the Send packet “c” and the Echo packet “p” are matched. Similarly, a Send packet holding “d” and its corresponding Echo packet holding “d” are also matched.
3.2. Packet Crossover
Packet crossover occurs when a newly Send packet meets an Echo packet of a previous Send packet along the connection chain between a client host and a server host (see Fig. 2). In Fig. 2, we have a connection chain starting from the client (Host 1), to Host 2, then to Host 3, and finally to the server (Host 4), where Host 2 and Host 3 are the stepping-stones in this chain. The red packets S1, S2 and are Send packets, and the green packets E1, E2, and E3 are their Echo packets, respectively. First let us assume that packet crossover is observed at Host 1. In this case, the sequence of these six packets is S1, S2, E1, S3, E2, and E3. Therefore, there are two occurrences of packet crossovers in this case. Now let us observe packet crossover at Host 2. The Send and Echo packets from the connection between Host 2 and Host 3 are monitored. The sequence of these six packets observed at Host 2 is S1, E1, S2, S3, E2, and E3. Thus, only one occurrence of packet crossover is observed in this case.
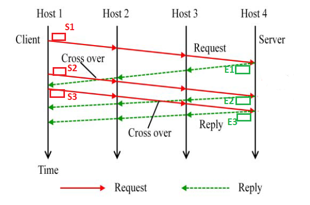
Figure 2: A sample of packet crossover in a connection chain of four hosts.
3.3. The Distribution of Packets’ RTTs in a Connection Chain
It is well-known that the number of connections in a connection chain can be represented by utilizing the packet round-trip times computed using the Send packets with their matched Echo packets.
It is well-known that the packet RTTs computed from the TCP packets captured from a connection chain from the attacker host to a target host obey Poisson distribution. This statement was verified in the seminar work [2]. This discovery has been used in the design of SSID methods in the literature. The results of a well-designed network experiment conducted by the authors of [2] is shown in Figure 3. This figure shows that the packet RTTs follow Poisson distribution. In this figure, the RTT values in micro-second are displayed on the X-axis, and the chances of the occurrences of RTT values are displayed on the Y-axis. In their network setup, the connection chain has a length of four. That is, the chain contains four connections with five machines in total. In their network experiment, µ stands for the mean of all the RTT values. From their observation, µ = 138,500. Since the packet RTTs follow Poison distribution, clearly, most values in the RTTs are very close to the value of µ (see Fig. 3).
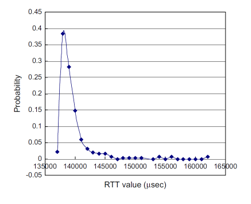
Figure 3: The Packets’ RTTs Obey Poisson Distribution
4. Matching TCP Packets Using Packet Crossover
In this section, we first present a proposition that will be used to design our algorithm for SSID. Then we describe an effective algorithm to determine whether a host is used as a stepping-stone by utilizing packet crossover.
First, we present a proposition that will be verified through well-designed network experiments in Section 5. Our detection algorithm design for SSID using packet crossover is based on this proposition.
Proposition 1: If the packet crossover ratio of an incoming connection of a sensor host is almost equal to that of an outgoing connection of the sensor, then these two connections are relayed ones. If the two packet crossover ratios are not close to each other, then these two connections are not relayed.
Next, we describe our proposed host-based detection algorithm for SSI using packet crossover:
1). Pick a host of a network as the sensor host.
2). Adopt Algorithm 1 (Compute Packet Crossover Ratio) in [11] to calculate the packet crossover ratio for every incoming connection to the above sensor host.
3). Adopt Algorithm 1 (Compute Packet Crossover Ratio) in [11] to calculate the packet crossover ratio for every outgoing connection from the above sensor host.
4). If any of the packet crossover ratios calculated for an incoming connection at Step 2) is almost the same as one of the packet crossover ratios calculated for an outgoing connection at Step 3), then it is highly suspicious that these two connections are relayed ones, and the sensor host is used as a stepping-stone.
5). If none of the packet crossover ratios calculated at Step 2) for incoming connections is close to any of the packet crossover ratios calculated for outgoing connections at Step 3), then it is almost sure that the sensor is not used as a stepping-stone.
The correctness of our above detection algorithm for SSI is clearly asserted according to Proposition 1.
5. Network Experiments
In this section, we design network experiments to verify the correctness of Proposition 1 described in Section 3 by comparing the packet crossover ratios of incoming and outgoing connections. Relayed pairs will typically result in almost equal packet crossover ratios. On the other hand, non-relayed pairs will typically result in dissimilar packet crossover ratios.
To set up our experimental environment, we created two distinct connection chains that shared the same sensor host H3 (see Fig. 4 below). The first connection chain consisted of one local host and four geographically dispersed Amazon AWS servers; all the hosts in the experiment ran Ubuntu Linux operating system. We created a long connection chain by using Secure Shell (SSH) to sequentially connect to each host in the connection chain from the attacker host H1 to the victim host H5 (see Fig. 4). In other words, a single terminal appearing on the attacker host H1 was used to create the entire connection chain by using sequential remote SSH access. From our local PC H1 in Georgia, USA with IP address 168.27.2.105, we remotely accessed host H2 (the first stepping-stone host in the chain), located in Northern Virginia, USA with public IP address 54.226.83.33. We then extended the connection chain by using H2 as a stepping-stone to remotely access the host H3 (our sensor host), located in Northern California, USA with public IP address 54.215.55.31. We then extended the connection chain again by using H3 as a stepping-stone to remotely access host H4 (the last stepping-stone in the chain), located in Tokyo, Japan with public IP address 3.115.8.190. We then extended the connection chain for the final time by using H4 as a stepping-stone to remotely access host H5, located in Central Canada with public IP address 3.99.215.22.
After the first connection chain was established, both the incoming and outgoing connections of the sensor host will be monitored and the packets will be captured using tcpDump at the sensor host (labeled respectively i1 and o1 on in Fig. 4) at H3, the sensor. All data are captured at H3 in this entire network experiment. We entered the following standard Linux commands for about three minutes into a terminal at the attacker host (H1) and captured all packets from the indicated connections at H3:
We captured ten datasets in total, with each data set comprising two files at the sensor host. After capturing the data, we ran our Packet Crossover Ratio algorithm to calculate the packet crossover ratio observed at H3 from both the incoming and outgoing connections.
We then created a second SSH connection chain that consisted of two local hosts and three geographically dispersed Amazon AWS servers, with each host again running Ubuntu Linux operating system. The sensor host H3 is the only common host shared by these two connection chains. From our local PC H6 in Georgia, USA with IP address 168.27.2.103, we remotely accessed host H7, which had an IP address of 168.27.2.106 and was co-located on the same LAN with our local PC in Georgia. We then extended the connection chain by using H7 as a stepping-stone to remotely access the host H3 (the same sensor host that was used for the first connection chain), located in Northern California, USA with public IP address 54.215.55.31. We then extended the connection chain again by using H3 as a stepping-stone to remotely access host H8 (the last stepping-stone in the chain), located in Frankfurt, Germany with public IP address 3.121.98.162. We then extended the connection chain for the final time by using H8 as a stepping-stone to remotely access host H9, located in London, England with public IP address 18.133.230.186.
After the second connection chain was established, we used tcpDump to capture both the incoming and outgoing connections (labeled i2 and o2 on in Fig. 4) at H3, the sensor. We entered the following standard Linux commands for about three minutes into a terminal at the attacker host (H1) and captured all packets from the indicated connections in the chain:
We captured ten datasets in total, with each data set comprising two files at the sensor host. After capturing the data, we ran our Packet Crossover Ratio algorithm to calculate the packet crossover ratio observed in both the incoming and outgoing connections.
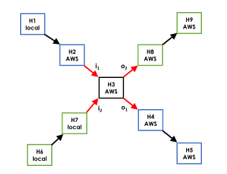
Figure 4: The experimental network setup. Depicts two distinct connection chains passing through the same sensor host H3. C=chain, i=incoming connection, o=outgoing connection, red arrows=connection captured from H3.
We then attempted to use the captured packet crossover ratios to match incoming and outgoing connections. Based on our previous research, we knew that the packet crossover ratios captured at a given sensor for the incoming and outgoing connections of a relayed pair should be close to 1. Therefore, we expected to see a matching of close to 1 for i1 and o1, as well as i2 and o2. Moreover, we expected to see a matching not close to 1 for non-relayed connection pairs such as i1 and o2. In Table 1, CR stands for Crossover Ratio, i1 for incoming connection 1, and o1 for outgoing connection 1. This table compares the CR of i1 to its respective outgoing connection. CR’s of relayed pairs should be very similar. Therefore, the incoming connection’s CR divided by the outgoing connection’s CR should and does equal approx. 1.
Table 1: CR’s of relayed pairs i1 and o1 close to 1
| Matching Relayed Pair: i1/o1 | |||
| Dataset | i1 CR | o1 CR | i1/o1 |
| 1 | 0.3554 | 0.3554 | 1 |
| 2 | 0.5202 | 0.5202 | 1 |
| 3 | 0.3889 | 0.3879 | 0.9974 |
| 4 | 0.3864 | 0.3864 | 1 |
| 5 | 0.3431 | 0.3431 | 1 |
| 6 | 0.4898 | 0.4898 | 1 |
| 7 | 0.2879 | 0.2879 | 1 |
| 8 | 0.3279 | 0.3279 | 1 |
| 9 | 0.3725 | 0.3781 | 1.0150 |
| 10 | 0.3509 | 0.3509 | 1 |
Table 2: CR’s of relayed pairs i2 and o2 close to 1
| Matching Relayed Pair: i2/o2 | |||
| Dataset | i2 CR | o2 CR | i2/o2 |
| 1 | 1.7576 | 1.7452 | 0.9930 |
| 2 | 1.7615 | 1.7626 | 1.0006 |
| 3 | 1.9298 | 1.9240 | 0.9970 |
| 4 | 1.8020 | 1.8045 | 1.0013 |
| 5 | 1.8190 | 1.8212 | 1.0012 |
| 6 | 1.8362 | 1.8384 | 1.0012 |
| 7 | 1.8635 | 1.8656 | 1.0011 |
| 8 | 1.8563 | 1.8483 | 0.9957 |
| 9 | 1.7700 | 1.7683 | 0.9990 |
| 10 | 1.9382 | 1.9403 | 1.0011 |
In Table 2, i2 stands for incoming connection 2, and o2 for outgoing connection 2. This table compares the CR of i2 to its respective outgoing connection o2. CR’s of relayed pairs should be very similar. Therefore, the incoming connection’s CR divided by the outgoing connection’s CR is approx. equal to 1.
Tables 1 and 2 depict a matching between relayed connections, where the packet crossover ratio of a given incoming connection is compared to the packet crossover ratio of its respective outgoing connection. Relayed pairs will typically result in almost equal packet crossover ratios. Therefore, the quotient of the packet crossover ratio of a given incoming connection divided by the packet crossover ratio of its respective outgoing connection should be approximately 1. All ten datasets for both connection chains demonstrate this general rule, with the quotients for connection chains 1 and 2 ranging from 0.9974 to 1.0150 and 0.9930 to 1.0013, respectively.
In Table 3, i1 stands for incoming connection 1, and o2 for outgoing connection 2. This table compares the CR of i1 to the CR of o2. Since these connections do not form a relayed pair, their crossover ratios should not be very similar. Therefore, the incoming connection’s CR divided by the outgoing connection’s CR should not approximate to 1.
In Table 4, i2 stands for incoming connection 2, and o1 for outgoing connection 1. This table compares the CR of i2 to the CR of o1. Since these connections do not form a relayed pair, their crossover ratios should not be very similar. Therefore, the incoming connection’s CR divided by the outgoing connection’s CR should not approximate to 1.
Table 3: CR’s of non-relayed pairs i1 and o2
| Matching Non-relayed Pair: i1/o2 | |||
| Dataset | i1 CR | o2 CR | i1/o2 |
| 1 | 0.3554 | 1.7452 | 4.9111 |
| 2 | 0.5202 | 1.7626 | 3.3882 |
| 3 | 0.3889 | 1.9240 | 4.9475 |
| 4 | 0.3864 | 1.8045 | 4.6703 |
| 5 | 0.3431 | 1.8212 | 5.3086 |
| 6 | 0.4898 | 1.8384 | 3.7536 |
| 7 | 0.2879 | 1.8656 | 6.4797 |
| 8 | 0.3279 | 1.8483 | 5.6366 |
| 9 | 0.3725 | 1.7683 | 4.7473 |
| 10 | 0.3509 | 1.9403 | 5.5299 |
Table 4: CR’s of non-relayed pairs o1 and i2.
| Matching Non-relayed Pair: i2/o1 | |||
| Dataset | i2 CR | o1 CR | i2/o1 |
| 1 | 1.7576 | 0.3554 | 0.2022 |
| 2 | 1.7615 | 0.5202 | 0.2953 |
| 3 | 1.9298 | 0.3879 | 0.2010 |
| 4 | 1.8020 | 0.3864 | 0.2144 |
| 5 | 1.8190 | 0.3431 | 0.1886 |
| 6 | 1.8362 | 0.4898 | 0.2667 |
| 7 | 1.8635 | 0.2879 | 0.1545 |
| 8 | 1.8563 | 0.3279 | 0.1767 |
| 9 | 1.7700 | 0.3781 | 0.2136 |
| 10 | 1.9382 | 0.3509 | 0.1810 |
Tables 3 and 4 depict a matching between non-relayed connections, where the packet crossover ratio of a given incoming connection is compared to the packet crossover ratio of another unrelated outgoing connection. Non-relayed pairs will typically result in dissimilar packet crossover ratios. Therefore, the quotient of the packet crossover ratio of a given incoming connection divided by the packet crossover ratio of an unrelated outgoing connection should typically not be close to 1. All ten datasets demonstrate this general rule, with the quotients for i1/o2 and i2/o1 ranging from 3.3882 to 6.4797 and 0.1545 to 0.2953, respectively.
We can clearly see that matched connection pairs are very similar, and non-matched pairs are dissimilar. With a true-positive threshold of 0.99-1.02, 100% of the matched pairs would be recognized as a relayed pair. Furthermore, 100% of the non-relayed pairs would be identified correctly.
6. Conclusion
Many known SSID methods are either not easy to implement, or not efficient as a large number of packets have to be monitored and analyzed. Some of them are even not effective as their capabilities to detect SSI are very limited. In this paper, we proposed an effective SSID method by using packet crossover ratios. Packet crossover ratios can be easily computed, and thus the SSID method developed in this paper cannot only be easily implemented, but also efficient in terms of packet processing time. Through well-designed network experiments, we verified that for a given sensor, if an outgoing connection and an incoming connection are detected to be relayed with each other, then the packet crossover ratios obtained from these two connections should be very close, and vice versa.
As for future research direction, one may revise and improve our proposed detection method for SSI so that it will be resistant to session manipulation by intruders using hacking techniques such as chaff-perturbation of meaningless packets or time jittering.
Conflict of Interest
The authors declare no conflict of interest.
Acknowledgment
This work of Drs. Lixin Wang and Jianhua Yang is supported by National Security Agency (NSA) NCAE-C research grant H98230-20-1-0293 with Columbus State University, Columbus GA 31907, USA.
- S. Staniford-Chen, and L. T. Heberlein, “Holding Intruders Accountable on the Internet,” Proc. IEEE Symposium on Security and Privacy, Oakland, CA, 39-49, 1995, DOI: 10.1109/SECPRI.1995.398921.
- Y. Zhang, and V. Paxson, “Detecting Stepping-Stones,” Proc. of the 9th USENIX Security Symposium, Denver, CO, 67-81, August 2000, doi: https://dl.acm.org/doi/10.5555/1251306.1251319.
- D. Donoho, A. Flesia, U. Shankar, V. Paxson, J. Coit, and S. Staniford, “Multiscale stepping-stone detection: Detecting pairs of jittered interactive streams by exploiting maximum tolerable delay,” in 5th International Symposium on Recent Advances in Intrusion Detection, Lecture Notes in Computer Science, 2516, 2002, DOI:10.1007/3-540-36084-0_2.
- T. He and L. Tong, “Detecting Stepping-stone Traffic in Chaff: Fundamental Limits and Robust Algorithms,” the 9th International Symposium on Recent Advances in Intrusion Detection (RAID 2006), April 2006.
- T. He, L. Tong, “Detecting encrypted stepping-stone connections,” In: Proceedings of IEEE Transaction on signal processing, 55(5), 1612-1623, 2007, DOI: 10.1109/TSP.2006.890881.
- A. Blum, D. Song, And S. Venkataraman, “Detection of Interactive Stepping-Stones: Algorithms and Confidence Bounds”, Proceedings of International Symposium on Recent Advance in Intrusion Detection (RAID), Sophia Antipolis, France, 20-35, September 2004, DOI:10.1007/978-3-540-30143-1_14.
- K. H. Yung, “Detecting Long Connecting Chains of Interactive Terminal Sessions,” Proc. of International Symposium on Recent Advance in Intrusion Detection (RAID), Zurich, Switzerland, 1-16, October 2002, https://doi.org/10.1007/3-540-36084-0_1.
- J. Yang, S.-H. S. Huang, “A Real-Time Algorithm to Detect Long Connection Chains of Interactive Terminal Sessions,” Proceedings of 3rd ACM International Conference on Information Security (Infosecu’04), Shanghai, China, 198-203, November 2004, DOI:10.1145/1046290.1046331; Corpus ID: 18061584.
- J. Yang, and S. S.-H. Huang, “Mining TCP/IP Packets to Detect Stepping-Stone Intrusion”, Journal of Computers and Security, Elsevier Ltd., 26, 479-484, December 2007, doi:10.1016/j.cose.2007.07.001.
- L. Wang, J. Yang, X. Xu, and P.-J. Wan, “Mining Network Traffic with the k-Means Clustering Algorithm for Stepping-stone Intrusion Detection”, Wireless Communications and Mobile Computing, 2021, Article ID 6632671, 2021, https://doi.org/10.1155/2021/6632671.
- L. Wang, J. Yang, and A. Lee, “An Effective Approach for Stepping-Stone Intrusion Detection Using Packet Crossover,” the 23rd World Conference on Information Security Applications (WISA), August 24-26, 2022, DOI: 10.26599/TST.2021.9010041.
- L. Wang, J. Yang, M. Workman, and P.-J. Wan, “Effective algorithms to detect stepping-stone intrusion by removing outliers of packet RTTs,” Tsinghua Science and. Technology. 2021(27), 432-442, https://doi.org/10.26599/tst.2021.90100432-4421.
- O. Alghushairy, R. Alsini, X. Ma, and T. Soule, “Improving the Efficiency of Genetic-Based Incremental Local Outlier Factor Algorithm for Network Intrusion Detection,” Advances in Artificial Intelligence and Applied Cognitive Computing. In Transactions on Computational Science and Computational Intelligence; Arabnia, H.R., Ferens, K., Fuente, D., Kozerenko, E.B., Olivas, J.A., Tinetti, F.G., Eds.; Springer, Cham: New York, NY, USA. 1, 1011–1027, 2021, http://dx.doi.org/10.1007/978-3-030-70296-0_81.
- J. Yang, S.–H. S. Huang, “Matching TCP Packets and Its Application to the Detection of Long Connection Chains,” Proceedings of 19th IEEE International Conference on Advanced Information Networking and Applications (AINA 2005), Taipei, Taiwan, China, 1005-1010, March 2005, 10.1109/AINA.2005.240.
- J. Yang, B. Lee, and S.S.-H Huang, “Monitoring Network Traffic to Detect Stepping-Stone Intrusion,” the Proceedings of 22nd IEEE International Conference on Advanced Information Networking and Applications (AINA 2008), Okinawa, Japan, 56-61, March 2008, DOI: 10.1109/WAINA.2008.30.
- S. S.-H Huang, H. Zhang, and M. Phay, “Detecting Stepping-stone intruders by identifying crossover packets in SSH connections”, the Proceedings of 30th IEEE International Conference on Advanced Information Networking and Applications, Fukuoka, Japan, 1043-1050, March 2016, DOI: 10.1109/AINA.2016.132.